

The rise of the tracker fund has meant many investors are betting that today’s winners, or a market’s biggest constituents, will stay on top.
This can be seen particularly clearly in the way that many investors tend to back US-heavy MSCI World trackers, or focus on global and US products rather than those from other regions.
This has been an approach with merit. The S&P 500 has returned around 293 per cent over 10 years, and 93 per cent over five. And while its performance has certainly been rockier this year, over longer periods both it and the MSCI World index are comfortably ahead of major indices in Japan, Europe, the UK and Asia.
So there is a strong argument for running your winners. But it’s worth noting that some less loved equity regions have really started to deliver the goods in recent years, and DIY investors have been missing out on these gains by focusing on the US.
Read more from Investors’ Chronicle
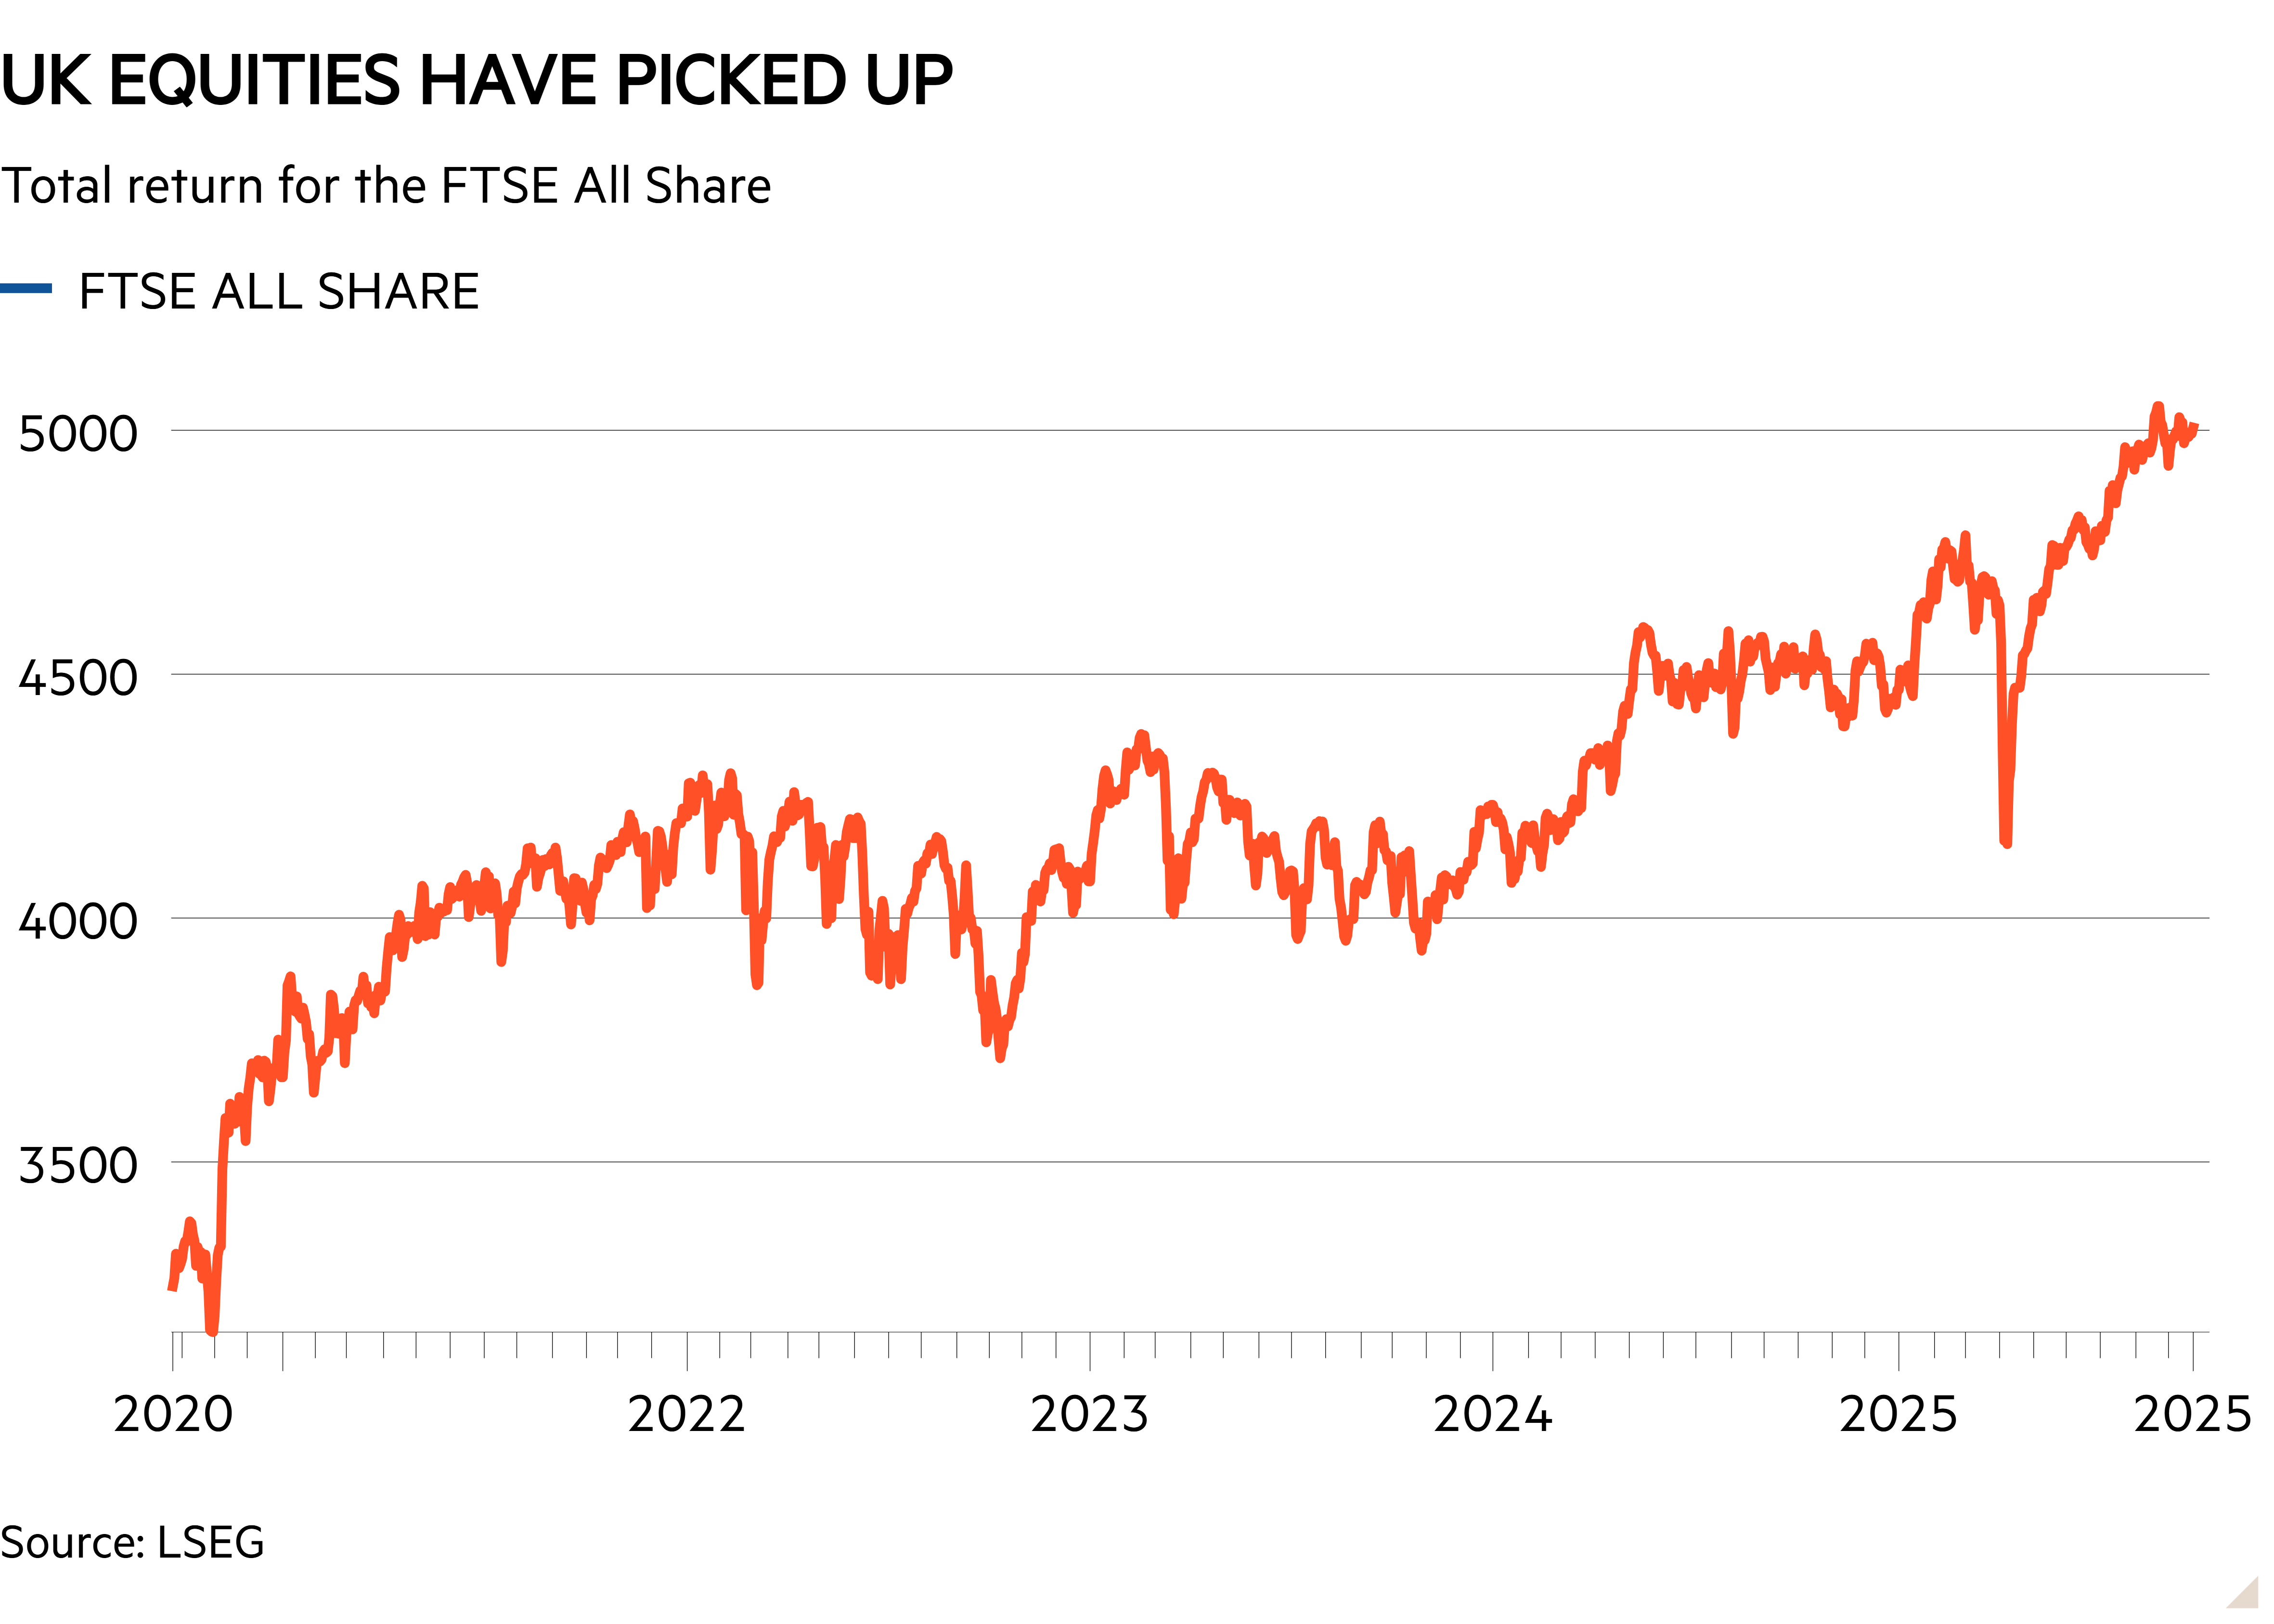
To start with an obvious one, the UK equity market has regained its poise, even if it hasn’t delivered the outlandish gains sometimes associated with US tech. The FTSE All-Share has gained almost 15 per cent on a total return basis so far in 2025, compared with 9.5 per cent in 2024 and 7.8 per cent in 2023.
The average fund in the Investment Association’s UK All Companies sector is also sitting on nice gains, but investors are not buying in. Data from the IA shows that retail investors have continued to yank huge volumes of money from UK equity funds, this year included. Those funds now haven’t been in the black in terms of inflows for a calendar year since 2015.
It has been a similar story in Europe, although the market there might finally have turned. European indices are up massively in 2025, perhaps partly as investors look to rotate away from the US, and also performed well in the previous two calendar years.
The March to July period – the latest for which data is available – saw investors consistently put money into Europe funds (on a net basis), interrupting a broader trend of outflows.
There are a couple of potential explanations for this difference between the UK and Europe. For one, investors are more likely to already have money invested in a UK fund covered by this data than the European equivalent. The UK All Companies sector had £143bn of assets at the end of July, making it the second-biggest cohort after the IA Global sector, while the Europe excluding UK group had £58bn.
As investors are likely to have already held much more in the UK – be it via these funds, investment trusts or individual stock picks – than in Europe, this might be a case of rebalancing to an extent. But the figures do remind us that good returns can still come from unpopular regions.
It’s also worth adding that, while the average fund in an IA sector has tended not to outperform rising UK and European equity markets, some active funds have generated exceptional returns in recent years.
Artemis SmartGarp European Equity (GB00B2PLJD73) has made a return of more than 100 per cent over three years, while in the UK Ninety One UK Special Situations (GB0033063636) has returned around 94 per cent. That’s more than double the returns for the relevant markets – although, as ever, picking the top performer is extremely difficult.
However, having some exposure to these markets, in some form, could benefit your portfolio.