

Here are the key things you need to know before you leave work today (or if you work from home, before you shutdown your laptop).
MORTGAGE RATE CHANGES
No changes to report today so far other than a rise by First Credit Union. All current mortgage rates are here. And note, you can compare mortgage offers with our unique calculator that takes into account other costs and cashback incentives, here.
TERM DEPOSIT/SAVINGS RATE CHANGES
First Credit Union was the only change, a rise. All updated term deposit rates less than 1 year are here, for 1-5 years, they are here.
STILL DEEPLY NEGATIVE, BUT LESS SO
The May version of the ANZ-Roy Morgan consumer confidence survey found a lift from the very low April levels (which had approached the lows in the pandemic). The net proportion of households thinking it’s a good time to buy a major household item (the best retail indicator) rose 5 points to -20. So still very negative. Inflation expectations (2-years ahead) eased from 6.6% in April to 5.3% in May, while house price expectations dropped 0.7ppts to 2.6%. Wellington is much more downbeat than the rest of the country.
A PARTIAL BOUNCE-BACK
However, business confidence bounced back strongly in May in the ANZ survey, lifting lifted 21 points in the month, but at +10 it is still well down on levels prevailing before the Middle East conflict. Expected own activity rose 6 points from 19.6 to 25.6. Past own activity eased from 16.1 to 14.8. Inflation indicators were slightly lower. Inflation expectations eased from 3.81% to 3.63%, while pricing intentions fell 1 point to 56.7. Expected price and cost increases also eased a touch.
ANZ NZ APPEALS
ANZ NZ has appealed the recent High Court decision that went against it in a class action law suit, from which the bank says it faces a maximum potential liability of $125 million. ANZ NZ CEO Antonia Watson says the bank’s appealing the decision becauset the High Court incorrectly applied the law.
PROVING SUPPLY IS A KEY ISSUE FOR AFFORDABILITY
The number of new homes being completed in Auckland increased steadily over the March quarter. A lift in new dwelling completion numbers suggests Auckland’s building industry may be on the road to recovery after its recent slump. But rising supply may keep a cap on selling prices.
STEADY INCREASES
The April RBNZ data shows that total lending for housing is now up to $397 bln, with 98.7% at banks. The expansion of this book is unremarkable in April, rising at the same clip it has all year (+5.8% from the same month a year ago). It will be touch-n-go, but it is possible lending for housing will hit $400 bln at the end of May, maybe the first week of June. Lending to all other sectors is expanding at a similar pace to prior recent months too.
TDs BACK IN FAVOUR
Household bank deposits rose a respectable +$2.4 bln in April from March to $272.8 bln. Transaction accounts were up +$690 mln, at-call savings accounts were up +$380 mln, and household term deposits rose +$1.3 bln and their most since September 2024.
KIWISAVER FUNDS DELIVER SHOCKINGLY POOR RETURNS
According to RBNZ data, the value of KiwiSaver assets actually fell in March from December, down -$650 mln. This was despite members adding +$2.7 bln to their accounts in the same quarter (EE+ER+Govt). So that means fund managers lost them -$3.5 bln. Not a great look. From a year ago, these fund values rose a net +$13.5 bln after members contributed +$11.1 bln. So the industry net performance was +1.9% for the year. Move to someone/something that can consistently do better than that. Use this tool to check your KiwiSaver fund performance. Politicians who want to force more fund flows into KiwiSaver should first address this chronic under-performance before they act. We estimate that fund managers ‘earned’ (?!) more than $900 mln in the year to March.
STARTING LOW
In an interesting twist, Westpac has set its 2026/267dairy season payout forecast to $9.50/kgMS. This is interesting because it is recent and it is below what Fonterra indicated earlier in the week, at $9.75/kg/MS. Westpac’s forecast is the lowest of any analyst who has made a new season forecast. The current 2026/27 dairy season formally starts on June 1, 2026.
HIGH LIVESTOCK PRICES
Livestock processors are reporting stronger pricing for mutton into China and Taiwan, driven mainly by tighter supply out of Australia. Lamb prices, however, have remained relatively stable. For beef, there has been limited activity out of the US this week. However at the farm gate, prices are firming across the board, although more so in the North Island than the South Island. Of note is the continuing rise for venison which are now approaching their record highs of mid 2018.
HIGH WOOL PRICES
Prices for coarse wool continue to impress with further rises at sales this week. The fiber is having its day in the sun, again, after a very long low period. Prices are back or above their brief 2016 high levels. Lack of supply is helping those who kept the faith and stayed in the sheep industry. (It isn’t just a New Zealand thing, it is global.)
NZX50 MOVES UP MODESTLY
As at 3pm, the overall NZX50 index is up +0.2% so far today, with a weekly rise of +1.9%. It is down -1.6% from six months ago. From a year ago it is now up +7.8%. Market heavyweight F&P Healthcare is little-changed, down less than -0.1% from yesterday. Tourism Holdings, Serko, Summerset, and Kiwi Property lifted the NZX50 into the weekend; while a2 Milk, Gentrack, Channel Infrastructure, and Infratil are the main decliners.
STRONG DEMAND PERSISTS
There were three NZGB maturities offered at today’s Budget-delayed tender of a total of $450 in three maturities. There were 99 bids totaling almost $1.4 bln. Yields were slightly lower, except for the April 2029 bond which was last offered 15 weeks ago.
JAPANESE RETAIL STRONG
Japanese retail sales have risen to a one year high in April, up +2.1% from a year ago and besting forecasts of +1.3%. It is being driven by resilient consumer demand from ongoing government stimulus and rising wages.
SWAP RATES SOFT
Wholesale swap rates will probably show a small fall today at the short end. Keep an eye on our chart below which will record the final positions closer to 5pm. The 90 day bank bill rate was up +1 bp at 2.63% on Thursday. Today, the Australian 10 year bond yield is down -8 bps at 4.83%. The China 10 year bond rate is unchanged at 1.72%. The Japanese 10 year bond is also down -4 bps at 2.65% today. The NZ Government 10 year bond rate is now at 4.57%, down -8 bps from this time yesterday. (The RBNZ data is now ‘prior day’ with the Thursday rate up +3 bps at 4.62%.) The UST 10yr yield is down -7 bps at 4.44%.
EQUITIES MOSTLY HIGHER
The local equity market is up +0.2% from yesterday. The ASX200 is up +1.0% in afternoon trade, recovering Wednesday’s drop. Tokyo is up +1.9% at its open. Hong Kong is up +0.4% but Shanghai is little-changed at its open today. Singapore is up +0.6%. Wall Street ended its Thursday trade with the S&P500 up +0.6%.
OIL PRICES DROP
American oil prices are down -US$3 with the WTI benchmark now just under US$88/bbl, and the international Brent price is now just under US$92/bbl and down -US$4.50.
CARBON PRICE QUIET
There have been few trades today on the secondary market, and the price has held at $52.25/NZU. See our daily chart tracker of the NZU price for carbon, courtesy of emsTradepoint.
GOLD RECOVERS
In early Asian trade, gold is up at US$4505/oz, back up +US$110 from this time yesterday and recovering its 24 hr fall. Silver is now just under US$76/oz and up +US$3.
NZD MUCH FIRMER
The Kiwi dollar is up +60 bps from this time yesterday open against the USD, now just on 59.5 USc. Against the Aussie we are up +40 bps at 83.1 AUc. Against the euro we are up +40 bps at 51.1 euro cents. This all means the TWI-5 is now just over 63 and up +60 bps from this time yesterday.
BITCOIN LOWER AGAIN
The bitcoin price is now at US$73,2182 and down -1.2% from this time yesterday and a five week low. Volatility has been modest at just over +/- 1.3%.
Select chart tabs
US$
AU$
TWI-5
¥en
¥uan
€uro
GBP
Bitcoin
Select chart tabs
1 year %
2 years %
3 years %
4 years %
5 years %
7 years %
10 years %
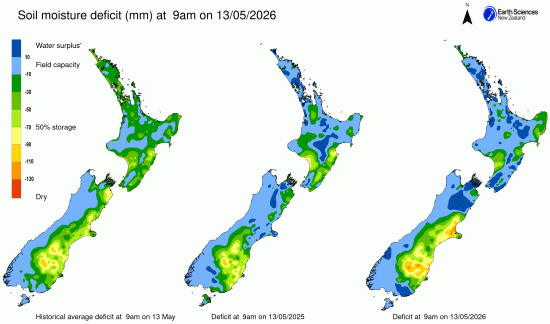
This soil moisture chart is animated here.
Keep abreast of upcoming events by following our Economic Calendar here ».