
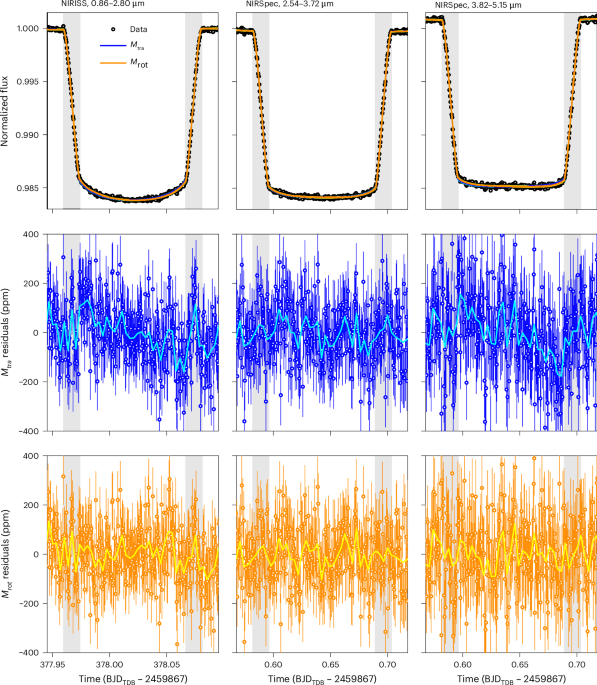
Observations and data reductionsJWST/NIRSpec G395H observations
The JWST observed the ultrahot Jupiter WASP-121 b starting 145 min before the beginning of the planet’s eclipse behind the star on 14 October 2022 (UTC), and finishing the observation 105 min after the end of the eclipse on 15 October 2022 (UTC). This observation was carried out as the telescope’s observing programme GO 1729 (principal investigators (PIs): Evans-Soma and Kataria) using NIRSpec with the G395H grating and naturally included the transit of the planet in front of the star between these two eclipses. The observations were conducted using NIRSpec’s SUB2048 subarray and NRSRAPID readout pattern with 42 groups per integration and were reduced using the Fast Infrared Exoplanet Fitting Lightcurve (Firefly)36,37,38 and Eureka!39 pipelines. The details of the two data reductions performed with the two different pipelines are listed in refs. 21,22.
JWST/NIRISS SOSS observations
JWST also observed a phase curve of WASP-121 b using the NIRISS instrument starting before a planetary eclipse on 10 October 2023 (UTC) and ending 43.85 h later after a second eclipse event. This observation was part of observing programme GTO 1201 (PI: Lafrenière) and used the SOSS mode with the SUBSTRIP256 subarray with six groups per integration.
The observations were reduced starting from the uncalibrated (uncal.fits) images using the Firefly reduction suite36,37,38, which has been adapted for SOSS data40 with further details available in refs. 40,41,42. A notable recent addition is the removal of 1/f noise at the group-level stage, as described in ref. 43. From the cosmic ray, bad pixel, 1/f-removed, background-removed two-dimensional images, we summed the white-light curve using an aperture width of 34 pixels, which produced a first-order white-light curve that minimized the light curve scatter, found to have a standard deviation of 110 ppm and a median absolute deviation of 83 ppm as characterized by a near-flat 100 integration segment shortly before transit.
We also performed a NIRISS SOSS reduction independent of the Firefly reduction using steps as outlined in ref. 44 (hereafter labelled the ‘Fu’ reduction). It starts with the uncalibrated (uncal.fits) files, and we used the default JWST pipeline to produce the rampfitsstep.fits. Then, we did background and 1/f subtraction using pixels in the bottom 50th percentile in flux for column median subtraction and extracted the time series two-dimensional spectra. Based on the 100 points right before transit, we measured a standard deviation of 116 ppm and a median absolute deviation of 88 ppm.
JWST data analysis
We approximate the rotation-induced change of the planet’s transit radius with a second-order polynomial in time (see ‘Rotational light curve model’). We implemented this light curve model using the Batman package18, in which the planet-to-star radius ratio is a constant. To calculate light curve models with time-dependent planet radii, we set up a Batman model for each data point of the time-series observation and set the planet-to-star radius ratio in the series of Batman models according to equation (1).
To measure WASP-121 b’s phase-resolved transmission spectrum, we analyse a cut-out of the light curves that includes the data taken during both full eclipses and from 3.5 h before to 3.5 h after the transit mid-time output from both reductions of both the NIRSpec and NIRISS observations. Including the adjacent eclipses into the transit analysis is needed, because the planet’s rotation around the transit results in a variation of its emitted flux as a function of time that would contaminate the transmission spectrum if it were not separated from the systematics’ baseline23. The full model we use to fit the observations is
$${{\mathcal{M}}}_{\mathrm{rot}}=({c}_{0}+{c}_{1}t)\times \left(T(\theta )+P(\,{p}_{0},{p}_{1},{p}_{2})\right),$$
(2)
where (c0 + c1t) is the stellar and instrumental baseline, T(θ) is the modified Batman model with transit parameters θ, and
$$P(\,{p}_{0},{p}_{1},{p}_{2})=\left\{\begin{array}{ll}0 \qquad\qquad\qquad\quad{\mathrm{during}}\,{\mathrm{secondary}}\,{\mathrm{eclipse}}\\ {p}_{0}+{p}_{1}t+{p}_{2}{t}^{2}\quad\,{\mathrm{else}}\end{array}\right.$$
(3)
is an approximation of WASP-121 b’s partial phase curve around the transit. The translational light curve model \({{\mathcal{M}}}_{\mathrm{tra}}\) we use as a null hypothesis is identical to \({{\mathcal{M}}}_{\mathrm{rot}}\) apart from prescribing R1/R* = R2/R* = 0.
White-light curve fits
In JWST/NIRSpec’s G395H observing mode, the incoming radiation gets dispersed over two detectors, NRS1 and NRS2. We integrated the time series of stellar spectra from pixel column 300 to 2,042 on the NRS1 and from pixel column 5 to 2,010 on the NRS2 detectors to yield wavelength-integrated light curves for both detectors. The two light curves were then fit simultaneously. For the orbital parameters shared between both light curves, we adopted an eccentricity of zero, an argument of periapsis of 90° and a period of 1.27492504 days45 and fit for the impact parameter (b) and semi-major axis normalized by the star’s radius (a/R*). All other model parameters—the baseline coefficients c0 and c1 (equation (2)), the partial phase curve parameters p0, p1 and p2, the transit radius coefficients (Ri/R* in equation (1)), t0, and the limb darkening coefficients—were kept different between both light curves. For the limb darkening, we adopted a quadratic law with two free parameters (u1 and u2). The JWST/NIRISS white-light curve was calculated by integrating the flux from detector column 33 to 2,033 in the first grating order and fit in the same manner as the NIRSpec white-light curve, but without the need to fit two independent light curves jointly.
We first fit the data from both instruments with a least-squares algorithm implemented into the lmfit package46. Then, we explored all fit parameters’ posterior probability distributions using the Markov chain Monte Carlo (MCMC) package emcee47 and estimated the models’ Bayesian evidences using the nested sampling package dynesty48. In both sampling approaches, we included systematic noise terms (σsys) added in quadrature to the uncertainties of each integration (σp,i) to determine the total uncertainty
$${\sigma }_{{\rm{tot}},{\rm{i}}}^{2}={\sigma }_{p,i}^{2}+{\sigma }_{{\rm{sys}}}^{2}$$
(4)
of each integration. This approach accounts for potentially underestimated uncertainties in each light curve. For both sampling approaches, we adopted wide uniform priors for all model parameters (Supplementary Table 1). In the MCMC, we used 500 walkers with 50,000 steps each, discarding the first 20,000 steps as burn-in and thinning the remaining samples by a factor of 100. The results of all fit parameters’ posteriors for both observations’ reductions are listed in Supplementary Tables 2–5. For the nested samplings, we used 500 live points.
For model comparisons, we calculate all model fits’ Bayesian information criteria (BIC) from the MCMC samplings and their Bayesian evidences (Z) from the nested samplings. To calculate the statistical significances of the rotation-induced radius change delivered by the observations, we then calculate the differences in BIC (ΔBIC) and the normal logarithm of the Bayes factors (\(ln(B)\)) of \({{\mathcal{M}}}_{\mathrm{rot}}\) relative to \({{\mathcal{M}}}_{\mathrm{tra}}\), which suggest conclusive detections in all observations and data reductions (Extended Data Tables 1 and 2). We also compare \({{\mathcal{M}}}_{\mathrm{rot}}\) with free R2/R* with setting R2/R* = 0, thus comparing two rotational light curve models with either a quadratic or a linear polynomial for the planet-to-star radius ratio as a function of time. In the NIRISS SOSS data, the light curve modelling approach with free R2/R* is slightly preferred over the model with R2/R* = 0 with \(ln(B)=1.6\) in the Firefly and \(ln(B)=1.5\) in the Fu reduction. In the NIRSpec G395H data, setting R2/R* = 0 is slightly preferred over fitting for a free R2/R* with \(ln(B)=1.9\) in Firefly and \(ln(B)=1.2\) in Eureka!. Thus, there is no indication to prefer either approach over the other26 in any of the observations or data reductions.
Spectroscopic light curves
To investigate the change of WASP-121 b’s transmission spectrum induced by its rotation, we integrated the NIRSpec light curves over bins of 244 pixel columns of the NRS1 and 237 pixel columns of the NRS2 detector to generate 14 spectroscopic light curves. As in the white-light curve fit, we fit these light curves simultaneously, adopting the same eccentricity, argument of periapsis and period as before and fitting for b and a/R*, which are shared between all light curves. All other parameters are different for all light curves. Again, we first ran a least-squares fit and sampled the parameters’ posterior distributions using an MCMC. In the MCMC, we initiated 500 walkers in a tight Gaussian ball around the least-squares solution and ran 100,000 steps for each walker, discarding the first 50,000 steps as burn-in. The final samples were thinned by a factor of 200.
We applied three modelling approaches to fit the spectroscopic light curves in order to estimate the model assumptions’ impacts on the inferred planet radius coefficients Ri/R*. These three approaches were
(1)
R2/R* = 0 and wide uniform priors on the limb darkening coefficients,
(2)
R2/R* as a free parameter and wide uniform priors on the limb darkening coefficients, and
(3)
R2/R* as a free parameter and Gaussian priors on the limb darkening coefficients that we adopted from the exotic-LD package49 using the ‘stagger’ grid of stellar models50.
The MCMCs’ posteriors of the planet radius polynomial coefficients from these three modelling approaches analysing the data from the Firefly reduction and modelling approach number one applied to the Eureka! reduction are plotted in Extended Data Fig. 5. They reveal that the R1/R* coefficient, which gives the linear rate of the planet’s radius change relative to the star’s radius during transit, is indifferent toward the choice of priors for the limb darkening. This is because R1/R* is the coefficient for a polynomial term that is odd about the point of conjunction. As such, a non-zero R1/R* will induce a transit shape that is asymmetric about the point of conjunction that cannot be replicated by changing the limb darkening or the orbital parameters. When we adopt R2/R* = 0 in \({{\mathcal{M}}}_{\mathrm{rot}}\), the measurements of R1/R* again do not change (Extended Data Fig. 5), and thus, our measurements of R1/R* are robust against choices of limb darkening priors and the value of R2/R*.
In contrast to R1/R*, the measurements reveal that R0/R*, giving the planet-to-star radius ratio at the point of conjunction, and R2/R*, describing the curvature of the radius function in time, are both sensitive to modelling approaches of the stellar limb darkening, as their uncertainties greatly increase when moving from tight Gaussian priors to uninformative uniform priors on u1 and u2. The reason for this degeneracy is that R2/R* describes an even term about the point of conjunction and is correlated with R0/R* (Extended Data Fig. 2). Any even changes about the point of conjunction (such as a decrease of the radius in the first and a converse increase in the second half of the transit) has a similar effect on the light curve as the limb darkening that is symmetric about the centre of the stellar disk. Therefore, R2/R* and the correlated R0/R* cannot be reliably disentangled from the limb darkening using the JWST data.
SPARC/MITgcm predictions
Synthetic light curves have been generated from the output of a SPARC/MITgcm simulation of WASP-121 b16,17, postprocessed using Pytmosph3R2,3,51. The SPARC/MITgcm solves the primitive equations on a cubic-sphere grid. In the simulation, the pressure ranges from 200 bar to 2 μbar over 53 levels, with a horizontal resolution equivalent to 128 longitudes and 64 latitudes. The model includes optical absorbers such as TiO and VO, assumes solar metallicity and a solar C/O ratio, and does not include clouds. As an indication, the temperature on the dayside is ~2,800 K.
Pytmosph3R is an open-source Python package that provides tools to compute synthetic observations, transmission and emission spectroscopy, transit light curves and phase curves, from three-dimensional atmospheric models such as general circulation models (GCMs). Its inputs are the planetary, stellar and orbital characteristics, along with the temperature map provided by the GCM, and the abundances of species present in the atmosphere. It computes absorption, Rayleigh and Mie scattering, and continuum absorption (collision-induced absorption) along a set of light rays passing through the atmosphere. The species included are He, H2, H, H2O, CO, TiO, VO, Na, K and SiO, for which we account for the absorption opacity (except for He, H2 and H), and the continuum includes H2–H2 and H2–He. Opacities have been downloaded from Exomol52. The orbital period has been set to 1.274925 days, with an orbital radius of 0.025 au, a planet radius of 1.61 Jupiter radii and a surface gravity of 8.436 m s−2.
To compare the simulation results with the observations, we generated light curves for WASP-121 b in NIRSpec G395H’s wavelength range with the star’s limb darkening set to zero. That way, the depth of the model light curve during the full transit (between contact points 2 and 3) can be converted into the planetary-to-stellar radius ratio using
$${R}_{{\rm{p}}}/{R}_{* }(t)=\sqrt{1-F(t)},$$
(5)
where F(t) is the model light curve’s flux. To facilitate the comparison between model light curves and the observations of Rp/R*(t) approximated as a polynomial (see equation (1)), we fit quadratic polynomials to the model Rp/R*(t) of each spectral channel to infer the model predictions for R0/R*, R1/R* and R2/R* as functions of wavelength (examples for this approximation are shown in Extended Data Fig. 3). All relative deviations of the fit polynomials to the GCM’s Rp/R*(t) are smaller than 0.1% in all simulated time steps, and thus, the approximation as quadratic functions for the comparison with the observations is justified.
Like the observations, the SPARC/MITgcm shows positive R1/R* for most and negative R1/R* with much smaller absolute values for some spectroscopic channels (Extended Data Fig. 5); however, it systematically underestimates the values for R1/R* over the entire wavelength range. One limitation that could contribute to the model’s underestimation of R1/R* is the lack of clouds in the atmosphere that might be present around the morning terminator. In addition, a previous phase curve analysis of WASP-121 b showed that the SPARC/MITgcm delivers too high nightside temperatures compared with the measurements21. With an overestimated nightside temperature, the model underestimates the day-to-nightside temperature contrast, leading to underestimated longitudinal temperature gradients across the terminators, consistent with the observed discrepancy with the observations. Another reason for the mismatch between the observations and the model could be an inaccurate atmospheric chemical composition in the model due to the assumed solar metallicity and C/O = 0.55, as recent observations have consistently shown that WASP-121 b’s C/O is much higher than 0.55 (refs. 22,28,29). These differences in chemistry might also be responsible for the deviations of the model’s transmission spectrum at the point of conjunction from the observations (Extended Data Fig. 5, top, blue diamonds), namely, the too steep H2O feature and the underestimation of the CO feature between 4.3 μm and 5.2 μm.
To simulate the effect of a colder morning terminator, we modified the ‘nominal’ SPARC/MITgcm by setting the vertical temperature structure from 240° to 302° in longitude to its structure at 240° (Extended Data Fig. 7). With this modified temperature field (labelled the ‘muted leading limb’ model in Extended Data Fig. 5), the model predictions for R1/R* increase in all wavelengths because the planet’s rotation no longer leads to a shrinking of the leading limb, due to a temperature structure that is vertically constant in longitude. With this modification, the model predictions for R1/R* are larger than the observations between 3.05 μm and 4.0 μm where H2O is the dominant molecular absorber23. At wavelengths larger than 4.3 μm where CO is the strongest absorbing molecule23, the model values for R1/R* are smaller than the data (Extended Data Fig. 5), although the lower limits of four of the five data points’ 1σ intervals overlap with the model predictions. Thus, the order of magnitude of the transit asymmetry observed with NIRSpec G395H NRS2 can be reproduced by the longitudinal temperature gradient around the evening terminator in the SPARC/MITgcm, when the longitudinal temperature gradient around the morning terminator is muted.
The SPARC/MITgcm predicts negative R2/R* through the whole spectrum, suggesting a local maximum of the planet’s cross-sectional area during transit. When adopting Gaussian priors on the limb darkening in the light curve analysis, we find consistently positive R2/R* (Extended Data Fig. 5), implying a local radius minimum during transit. The SPARC/MITgcm does not include any tidal deformation of the planet, and thus, the local maximum during transit in the model is caused solely by the atmospheric structure. The tidal deformation of WASP-121 b would lead to an elongation of the planet along the planet–star axis53, which, together with the planet’s rotation, would cause a local minimum of its cross-sectional area during transit3. Thus, the observed tendency to positive R2/R* might be a hint at the planet’s tidal deformation. Measuring the planet’s tidal deformation from this observation would be dependent on the assumption that the adopted limb darkening priors are accurate. However, their degree of precision is unknown, and thus, we refrain from attempting to constrain WASP-121 b’s tidal Love number, which quantifies its tidal deformation.
Other sources of asymmetric transits
A phase-dependent transmission spectrum of WASP-121 b is not the only possible cause of asymmetric transit light curves. Thus, we examine the plausibility of the observed transit asymmetries originating in the observing instruments or the planet’s host star WASP-121 A.
Instrumental systematics
Instrumental systematics causing the observed asymmetric light curve shapes would require an instrumental effect that impacts the NIRISS SOSS and NIRSpec G395H’s NRS2 data that show a transit asymmetry, but not NIRSpec G395H’s NRS1 observations that deliver a symmetric transit light curve (Fig. 1 and Extended Data Fig. 1). Considering that past observations suggested the NRS2 detector to be less affected by instrumental systematics than NRS1 (see, for example, refs. 21,54,55) and the coincidence of systematics required during the precise time span of the transit to create the observed signal in both the NIRISS SOSS and the NIRSpec G395H observations, such a scenario appears unlikely. Therefore, the transit asymmetry is probably a signal from either WASP-121 b or its host star.
Stellar activity and gravity darkening
In NIRSpec’s wavelength range, the observed transit asymmetry is more pronounced in the longer than in the shorter observed wavelengths. This is the opposite of how transit asymmetries caused by temperature inhomogeneities on the star’s surface driven by, for example, star spots or faculae would change with wavelength56,57. In addition, as an F6-type star58, WASP-121 A is expected to display less activity-driven flux variations throughout its surface that could induce asymmetric transit light curves than later stellar types59. Indeed, previous transit observations in the optical have not revealed any signs of photometric contamination caused by stellar activity60, making stellar activity an increasingly unlikely explanation for the observed transit asymmetries. As an early spectral type, however, WASP-121 A might be a fast rotator, leading to gravity darkening of its equator relative to the poles due to the reduction of the equator’s surface gravity caused by centrifugal forces and an oblate shape of the star61. Together with the misalignment of WASP-121 b’s orbital axis with the star’s rotation axis45,58, this system configuration can induce a transit asymmetry62.
From the nearly pole-on inclination of WASP-121 A45, we estimate the rotation rate of the star to be between 0.15 and 0.28 as a fraction of the critical rotational velocity. As such, gravity darkening of the host star should be a significant effect, causing a difference in emission intensity between the equator and pole of 6.4–20.8% in the optical and 2–6% in the JWST/NIRSpec passband. To quantify the possible impact of gravity darkening on our observations, we analysed all available TESS observations of WASP-121 b, given the proportionally higher contribution of gravity darkening to transit asymmetry in the optical. We query five sectors of 20-s cadence light curves and one sector of 120-s cadence, including only data ~0.25 days around the centre of each transit. To model the transit of a rapidly rotating, gravity-darkened star, we use the method described in ref. 33, but instead rewrite the spherical-harmonic decomposition of the gravity-darkened surface using Planck’s blackbody law into JAX. This allows us to use eclipsoid63 as the model within the JAX ecosystem. We use NumPyro64 to construct a probabilistic model for the gravity-darkened transit, using priors from ref. 21 for the stellar and planet parameters and ref. 45 for the projected orbital obliquity. We also sample the sine of the stellar inclination using an isotropic prior on the spin axis, restricted to the range 0–0.25 to ensure the star is relatively pole-on, as suggested by ref. 45, and place a uniform prior on the dimensionless stellar rotation rate ω between 0 and 0.3. We fix the gravity-darkening exponent β, which governs the temperature difference produced by a given surface gravity contrast between the star’s equator and poles, to 0.23, as allowing it to vary can lead to unphysical values65. Finally, we use Hamiltonian Monte Carlo with the NUTS sampler66 to obtain posteriors on the parameters of interest. We also performed inference using the same priors but without the gravity-darkening map on the star as a comparison with a standard transit fit to examine the amplitude of a transit asymmetry the star’s gravity darkening induces.
TESS’s light curves confirm that WASP-121 A is measurably gravity-darkened, creating a transit asymmetry with an amplitude on the order of 100 ppm in the optical light curves between contact points 2 and 3 as well as upward residuals reaching up to ~300 ppm during egress (Extended Data Fig. 4). The posteriors of the planet’s and star’s inclination as well as the projected and true spin–orbit angles (Supplementary Table 6) are consistent with previous radial-velocity observations of the system45. For the stellar rotation rate, we find (12.6 ± 0.19)% times the critical rotational velocity, which is slightly lower than the (15–28)% estimated before45 and thus suggests that the star’s rotation rate lies on the lower end of previous constraints. One possible reason for the small discrepancy between our result and the radial-velocity observation’s lower limit might be the star’s gravity-darkening exponent we fixed at β = 0.23. β can be lower than the value of β = 0.25 predicted theoretically67, reducing the temperature contrast between stellar equator and pole for a given rotation rate. Thus, if WASP-121 A’s β were lesser than 0.23, our measured ω would be biased to smaller values, which would be in line with our measurement being slightly lower than the Doppler tomography’s lower limit.
Because the wavelength bands of TESS and JWST/NIRISS SOSS Order 1 overlap, the NIRISS SOSS light curve will also be affected by gravity darkening. Indeed, both the asymmetry between contact points 2 and 3 and the even stronger upward residuals during egress caused by gravity darkening in TESS (see Extended Data Fig. 4) are clearly visible in the white-light curve of NIRISS SOSS Order 1 (see middle rows of Fig. 1 and Extended Data Fig. 1).
To examine whether the transit asymmetry observed with JWST/NIRSpec G395H NRS2 is consistent with WASP-121 A’s gravity darkening observed with TESS, we fit the JWST/NIRSpec G395H NRS2 data in the same manner as before, but using a maximum a posteriori method. The stellar rotation rate required to fit the NRS2 light curve is ω = 19.8% (Supplementary Table 6) and, thus, deviates from the TESS result by >30σ. This demonstrates that gravity darkening of WASP-121 A is insufficient to explain the transit asymmetry observed with JWST/NIRSpec. In addition, the gravity darkening model does not explain the lack of a transit asymmetry in NRS1 if NRS2 is affected by gravity darkening, as the gravity-darkening-induced asymmetry would be expected to decrease monotonically at longer wavelengths62. Therefore, in NRS2, gravity darkening must be a minor effect compared with WASP-121 b’s phase-dependent transmission spectrum as the symmetric NRS1 light curve demonstrates that gravity darkening has already dropped below a measurable level at that wavelength range (Fig. 1 and Extended Data Fig. 1).
Phase-dependent CO absorption
JWST/NIRISS’s and JWST/NIRSpec G395H’s bandpasses include one CO band each. To examine whether WASP-121 b’s radius change is consistent between both observed CO bands, we integrated both detectors’ light curves over the heads of the two CO bands and fit both \({{\mathcal{M}}}_{\mathrm{tra}}\) and \({{\mathcal{M}}}_{\mathrm{rot}}\) with R2/R* = 0 using least-squares approaches and MCMCs as before to the light curves. In these fits, the orbital parameters were fixed to the two observations’ white-light curve fit results. The fits to the observations (Extended Data Fig. 6) reveal that WASP-121 b’s rotation-induced radius change results in residuals on the order of 250 ppm between contact points 2 and 3 when \({{\mathcal{M}}}_{\mathrm{tra}}\) is used in both the NIRISS and NIRSpec light curve, although the NIRISS data suffer from a lower signal-to-noise ratio due to the probed CO band being narrower than the one in NIRSpec. The MCMC posteriors of R1/R* are \(65{0}_{-189}^{+188}\,\mathrm{ppm}\,{{\rm{h}}}^{-1}\) in NIRISS and \(58{0}_{-91}^{+90}\,\mathrm{ppm}\,{{\rm{h}}}^{-1}\) in NIRSpec and thus consistent between both observations.
The slightly stronger increase of WASP-121 b’s apparent radius as a function of time in NIRISS compared with NIRSpec might be the result of contamination with gravity darkening. We note, however, that the linear rate of radius change in the white-light curve of NIRISS (\(40{9}_{-53}^{+53}\,\mathrm{ppm}\,{{\rm{h}}}^{-1}\); Supplementary Table 4) is smaller than the rate measured from the light curve integrated over the CO band (\(65{0}_{-189}^{+188}\,\mathrm{ppm}\,{{\rm{h}}}^{-1}\)). Gravity darkening monotonically decreases with wavelength, and because the CO band in NIRISS is located on the long-wavelength end of the detector, there has to be an additional source of an asymmetric light curve that elevates the R1/R* measurement over that from the white-light curve. Thus, both the NIRISS and the NIRSpec data point towards increasing CO absorption in the planet as a function of orbital phase with quantitatively consistent amplitudes. This demonstrates JWST’s remarkable capability to measure phase-dependent absorption in transiting exoplanets consistently between different observations and instruments.