
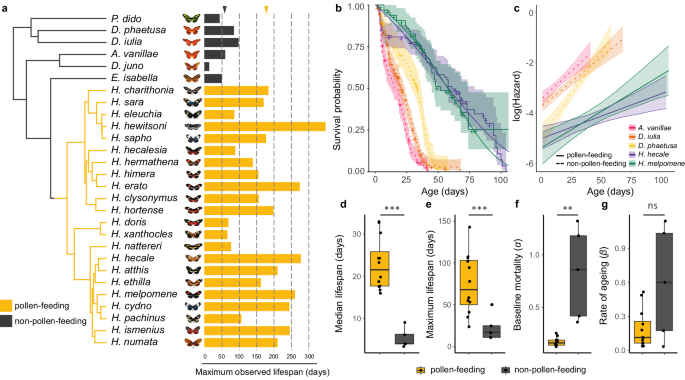
Heliconiini maximum reported lifespan data collation
Data on maximum reported lifespan for species across the Heliconiini tribe (Table 1 and Supplementary Data 2) were collated from a literature search within PubMed, Google Scholar, and Web of Science for long-term studies of Heliconius and other Heliconiini butterflies, using combinations of the search terms “Heliconius”, “Heliconiini”, “lifespan”, “longevity”, “survival”, “mark”, “release”, “recapture”, and “population dynamics”, first between January and April 2021, and then again in November 2025. However, considering the popularity of Heliconiini species in commercial butterfly houses, active exhibits listed on the International Association of Butterfly Exhibitors and Suppliers were also contacted to enquire if they had collected lifespan data. For many species, multiple records of maximum longevity were found, sourced from data from butterfly exhibitors, mark-release-recapture studies, and insectary populations (Supplementary Data 2). In all such instances, maximum longevity records from butterfly exhibitors eclipsed those from insectary populations and mark-release recapture studies in the wild. One study in particular (Kelson, unpublished) was responsible for many of the highest maximum longevity records; for further details of this study design, see Supplementary Note 5.
Butterfly husbandry and survival data collection
All wild-caught Panamanian butterflies were collected under permit numbers SE/A-82-19 and SE/A-14-18.
Survival data from a multi-species cognitive experiment cohort
Survival data were collected for Heliconius hecale melicerta, Heliconius melpomene rosina, Dryadula phaetusa, and Agraulis vanillae during a previous cognitive experiment by Young et al.19. Survival data for Dryas iulia were obtained during a similar cognitive experiment56 generated under the same experimental conditions. In both studies, all butterflies were captive-reared from stock populations at the Smithsonian Tropical Research Institute (STRI) outdoor insectaries in Gamboa, Panama. These populations were established from wild-caught individuals collected within a 2 km radius of Gamboa, between January-May 2019 (for H. melpomene, H. hecale, D. phaetusa, and A. vanillae), or between January-November 2022 (for D. iulia). Eggs were collected daily from host-plants within these stock cages, and hatched larvae were reared in mesh pop-up cages and fed ad libitum on leaves of their preferred Passiflora host-plants. H. melpomene was fed on P. triloba, H. hecale was fed on P. vitifolia, and D. phaetusa, A. vanillae, and D. iulia were fed on P. biflora.
Upon eclosion, butterflies were marked with a unique ID using a contrastingly-coloured marker and placed into 2 m (L) x 3 m (W) x 2 m (H) cages containing a rack of 24 artificial feeders arranged in a 4 × 6 grid and placed centrally in the cage. Feeders contained approximately 0.5 ml of a sucrose-protein solution (25% w/v sucrose and 5% w/v Vetark Critical Care Formula), replaced daily. A single non-flowering Palicourea elata plant was also placed in each cage as a roosting site. Adult butterflies were subjected to long-term memory assays based on the association of a colour with a food reward, which imposed regular bouts of food deprivation during testing periods as well as frequent handling. Further details of these assays may be found in Young et al.19. Upon completing the cognitive experiment, butterflies were maintained until the end of their natural lifespans. Cages were checked daily for dead individuals, death dates were recorded, and missing or predated individuals were noted for censorship in survival analysis at the age at which they were last seen alive. In total, survival data from both sexes were analysed for 175 individuals of A. vanillae, 263 individuals of D. iulia, 108 individuals of D. phaetusa, 120 individuals of H. hecale, and 66 individuals of H. melpomene.
Semi-natural “mark-release-recapture” cohort
To obtain survival data across a broader sampling of Heliconiini, butterflies of 20 different species were released into a large semi-natural enclosure for a mark-release-recapture study. The cohort comprised all Heliconiini species available at the STRI insectaries during the study period, maximising phylogenetic coverage. All individuals were captive-reared from stock populations between January and November 2022 on leaves of their preferred Passiflora host-plants. Provenance of these stock populations varied depending on the species, with many established from local Panamanian collecting trips, and others established using pupae imported from butterfly farms in the years preceding data collection. Newly-eclosed butterflies were marked with a unique ID using a contrastingly-coloured marker and released into a large 11 m (L) x 11 m (W) x 6 m (H) cage located at the STRI insectaries. The cage was filled with trees, Passiflora host-plants, and other flowering plants, creating a semi-natural environment. Floral nectar sources were also supplemented by artificial feeders containing a 20% w/v sucrose solution, replaced every 2 days.
In total, 964 butterflies of 20 different Heliconiini species were released into the cage, including: A. vanillae (n = 12), D. iulia (n = 34), Dione juno (n = 45), D. phaetusa (n = 29), Eueides isabella (n = 59), Heliconius atthis (n = 33), Heliconius charithonia (n = 3), Heliconius cydno (n = 18), Heliconius doris (n = 32), Heliconius erato (n = 44), H. hecale (n = 47), Heliconius hewitsoni (n = 15), Heliconius himera (n = 2), Heliconius ismenius (n = 19), H. melpomene (n = 276), Heliconius numata (n = 92), Heliconius pachinus (n = 19), Heliconius sapho (n = 81), Heliconius sara (n = 71), and Philaethria dido (n = 13). All Heliconius included in this study are pollen-feeding species, and data for the four non-pollen feeding Heliconius in the Aoede clade are unfortunately not available. This reflects the understudied nature of these species, which occur at low densities and have a derived host plant and are therefore challenging to work with. The sample number reflects the availability of pupae. Both sexes were represented for all species.
Data collection was carried out twice per week, with some omissions due to time constraints, and usually by a single surveyor. Approximately 15 min were spent patrolling the cage and recording the IDs of any butterflies visually identified and alive on that date. To ensure minimal intervention, butterflies were not recaptured or handled. Cage cheques were typically conducted mid-morning, when Heliconiini butterflies are most active, but an effort was made to also check at other times to re-sight individuals where this differed. Of the 959 butterflies released into the cage, 448 individuals were re-sighted on at least one occasion. Due to the size of the cage and semi-natural conditions, the largest source of extrinsic mortality in the cages was predation due to spiders or ants. In the case of natural deaths, individuals were rarely recovered before being eaten by ants, or otherwise deteriorated. In the event that a dead individual’s body was recovered intact, it was assumed to have died that day, and so its death date was noted.
Pollen-manipulation experiment cohort
All butterflies used in the longitudinal pollen-manipulation experiments were reared from stock populations at the STRI outdoor insectaries in Gamboa, Panama, between January and November 2022. Stock populations of H. hecale and D. iulia, selected for their local abundance and ease of rearing, were established from wild-caught individuals collected within a 2 km radius of Gamboa. New individuals were collected and added to stock populations bi-weekly to ensure genetic diversity, with stock populations of each species in total comprising approximately 60 females and 40 males across the 7-month study period. Stocks were maintained in 2 m (L) x 2 m (W) x 2 m (H) cages containing artificial feeders filled with a 20% w/v sucrose and 10% w/v organic, pesticide-free bee pollen solution, changed every 2 days. All stock cages contained flowering Palicourea, Lantana, and Stachytarpheta plants, and H. hecale stocks were also provided with fresh Psiguria flowers daily. Eggs were collected daily from host plants within these stock cages. Hatched larvae were reared in pop-up mesh cages and fed ad libitum on shoots of one of their preferred Passiflora host-plants, depending on availability: P. biflora, P. auriculata, P. pittieri, or P. edulis for D. iulia; and P. nitida, P. riparia, or P. vitifolia for H. hecale.
Upon eclosion, butterflies were sexed and weighed, their forewings were measured, and they were marked with a unique ID using a contrastingly coloured marker. They were then randomly assigned to either a pollen-fed or pollen-deprived treatment, with otherwise matched conditions and resources. The pollen-fed cage contained approximately 12 flowering Palicourea, Lantana, and Stachytarpheta plants, as well as fresh Psiguria flowers, replaced daily. It also contained 4 central artificial feeders filled with a 20% w/v sucrose and 10% w/v organic bee pollen solution, changed daily. The pollen-deprived cage contained approximately 12 non-flowering Palicourea, Lantana, and Stachytarpheta plants, as well as 4 central artificial feeders and approximately 20 red star-shaped feeders hung around the plant foliage, all filled with a 20% w/v sucrose solution, also changed daily. The number of artificial feeders in this cage was increased to match the number of flowers + feeders in the pollen-fed cage to ensure feeding opportunities were as standardised as possible between cages. Each cage included both species in roughly equal proportions, preventing confounding of species with treatment. Individuals were added to both cages in a staggered manner over the 7-month study period. Both cages measured approximately 4 m (L) x 3 m (W) x 2 m (H), and contained P. biflora and P. vitifolia host-plants.
Cages were checked daily for dead individuals, death dates were recorded, and missing or predated individuals were noted for censorship in survival analysis at the age at which they were last seen alive. In total, survival data from both sexes were collected across the lifespan of 96 individuals of H. hecale (n pollen-fed = 47, n pollen-deprived = 49) and 116 individuals of D. iulia (n pollen-fed = 57, n pollen-deprived = 57).
Functional senescence assays
Butterflies from the pollen-manipulation experiment cohort (n H. hecale = 96; n D. iulia = 116) were measured every two weeks for indices of functional senescence (see Supplementary Fig. S1 for a schematic). Considering evidence from several insects for age-related declines in body mass57, and muscle function55, butterflies were first weighed using a Sartorius Entris balance and then assayed for grip strength using a method adapted from Davis et al.52. Grip strength provides a proxy for whole organism condition in butterflies52 and beetles53, and is a standard biomarker of health in humans54. A custom-built device consisting of a perch mounted on a lightweight base (see Supplementary Fig. S2 for a diagram) was placed on the balance, which was then tared. Butterflies were held by their wings and allowed to grasp the perch, then gently pulled upwards until they released it. The peak negative reading on the balance from this exercise was taken as a measure of grip strength, which we took to be a proxy for muscle function. Following the methodological approach of Davis et al.52, this was repeated five times for each individual, and the maximum reading was used for statistical analysis, as we were primarily interested in each individual’s maximum capacity. However, this metric was also found to correlate extremely highly with the mean reading for each individual; see Supplementary Note 6 for further details. Data on flight behaviour were also recorded and are presented in Supplementary Note 7; see Supplementary Methods for details of how these assays were performed.
Statistical analyses
All statistical analyses were conducted using R v4.3.158. For all individuals, “age” was measured beginning from the time of adult eclosion, and so does not reflect the larval and pupal stages. These generally last about 3 weeks in Heliconiini butterflies, with only minor differences (1-2 days) between species41. All survival analyses presented in this manuscript are therefore conducted using only adult lifespan, coinciding with the earliest age at reproduction, as is traditionally suggested when modelling senescence5.
Non-parametric and semi-parametric survival analyses
Non-parametric and semi-parametric survival analyses for the pollen-manipulation experiment and multi-species cognitive experiment cohorts were conducted with the aid of the packages survival v3.5-559 and coxme v2.2-1860. Cox proportional hazards models were created for each species, including adult eclosion mass, diet, and sex (pollen-manipulation experiment cohort) or just sex (multi-species cognitive experiment cohort) as fixed effects. Interspecific models were found during diagnostics to have violated the proportional hazards assumption, and so instead separate models for each species were created within each cohort.
Parametric survival analyses
The package flexsurv v2.2.261 was then used to create parametric survival models for these cohorts fit to a Gompertz distribution (see Supplementary Note 8 for an explanation of distribution selection). The Gompertz function models how mortality risk changes with age, and is described by the equation µ(x) = αeβx, where µ(x) is the instantaneous mortality rate at age x, α is the baseline mortality independent of age, and β is the age-dependent mortality rate (i.e., the relative change in mortality with age x), also known as the rate of ageing24 (but see Supplementary Note 9 for an alternative index of the rate of ageing). A value of β > 0 reflects an increase in mortality risk with age, confirming the presence of actuarial senescence, and reflecting the process of ageing. Graphically speaking, when age is plotted against the natural log (ln) of the mortality rate, the intercept is equal to ln(α) and the slope is equal to β, facilitating easy interpretation of these parameters: a higher intercept reflects an increase in baseline mortality risk, and a higher slope reflects an increased rate of ageing. The corresponding Gompertz survival function is given as \(S(x)={e}^{\left(\right.\frac{\alpha }{\beta }(1-{e}^{\beta {{{\mathcal{x}}}}})}\), where S(x) is the probability of surviving to age x; this transformation facilitates the conversion in Figs. 1, 2 from the parametric survival curves overlaying the empirical survival data (Figs. 1b, 2a) to their corresponding log(Hazard) curves (Figs. 1c, 2b).
As the initial Cox proportional hazards models showed no evidence for effects of sex or eclosion mass on survival in the pollen-manipulation experiment and multi-species cognitive experiment cohorts, neither of these predictors were included in further parametric analyses. Instead, parametric models were fit, allowing either α – baseline mortality, β – rate of ageing, both, or neither to vary based on species (multi-species cognitive experiment cohort) or species, diet, and their interaction (pollen-manipulation cohort). The parametric model with the lowest AIC was then used to assess whether species or diet predicted either of these parameters. Bootstrapped estimates (1000 iterations) were generated for α and β for each group of interest, and the mean and 95% confidence intervals were extracted from these distributions. Estimates for these parameters were considered to be significantly different between groups if their 95% confidence intervals did not overlap. The H. melpomene dataset from the multi-species cognitive experiment cohort was subset to just those individuals surviving over 1 week due to high early mortality in this species (see Supplementary Note 10).
Bayesian survival trajectory analysis
Longevity data from the semi-natural “mark-release-recapture” cohort were analysed using the R package BaSTA v1.9.562, which facilitates the use of incomplete recapture data to provide estimates of age-specific survival under a Bayesian framework. BaSTA uses estimates of recapture probability based on the frequency of recaptures for each population to model survival trajectories. Considering that recapture probabilities likely differed between species due to factors such as behavioural differences, and given that census lengths differed for different species depending on when they were first introduced to the study, we created separate models in BaSTA for each species. Models were fit to a simple Gompertz distribution, running four parallel BaSTA simulations with 11,000 iterations, a burn-in of 1001, and a thinning rate of 200 to minimise serial autocorrelation. Median lifespan for each species was taken from estimates of survival probability in the BaSTA survQuant object. This produces estimates of survival probability for specified ages, increasing stepwise by 0.1 week each time, and so rarely included an age at which survival probability was exactly 50% (the median). Therefore, median survival was taken as the mean of the two ages for which predicted survival traversed 50%. Correlation between median lifespan estimates from BaSTA and existing reported maximum lifespans (Table 1) was assessed using Pearson’s correlation test. BaSTA also generates estimates for life expectancy as well as the Gompertz parameters b0 (equivalent to ln(α), or ln[baseline mortality]) and b1 (equivalent to β, or rate of ageing). These were also recorded for each species, with b0 back-transformed to α for ease of comparison with other cohorts. The value for maximum longevity for each species was taken as the highest age at which an individual of that species was observed alive (Table 3).
Due to the opportunistic nature of this study, data for many species suffered from low sample sizes and low recapture probabilities, which lead to wider credible intervals in BaSTA estimates and an underprediction of lifespan, respectively62. Given this, and the more thorough survival data from the other cohorts, the estimates for median lifespan for species in this cohort are almost certainly underestimates. However, these biases should apply uniformly to all species in the study. The broad patterns fit with expectations from the literature (Table 1), and we believe are still worthy of interpretation. There were several weeks over the course of this 9-month study in which cage cheques were not possible, and the reduced recapture effort for these weeks was accounted for in the models with the use of the recaptTrans argument within the basta() function. Heliconius himera, Philaethria dido, and Heliconius charithonia were excluded from BaSTAs due to low sample size and few re-sightings, and so maximum longevity was the only metric retained for these species. BaSTA also does not allow for recaptures during the “birth week”, and so 66 sightings which occurred in the first week of an individual’s life were excluded from analysis. Accounting for these exclusions, BaSTAs were performed using data from a total of 941 butterflies, with 959 recorded sightings of 378 different individuals. A full breakdown of these exclusions per species can be found in Supplementary Note 3.
Feeding habit differences
The maximum reported lifespans from Table 1 as well as the final parameters generated from the multi-species cognitive experiment cohort and the semi-natural “mark-release-recapture” cohort, were used to assess broad differences in ageing parameters between pollen-feeders (Heliconius species) versus non-pollen-feeders (the outgroup Heliconiini). The Shapiro-Wilk test of normality showed all parameters derived from the multi-species cognitive experiment cohort to be normally distributed (median lifespan: W = 0.92, p = 0.530; maximum lifespan: W = 0.89, p = 0.382; Gompertz parameter α: W = 0.83, p = 0.129; Gompertz parameter β: W = 0.97, p = 0.862), and the F-test of equality of variances showed all measures to have equal variances between the two groups (median lifespan: F2,1 = 1.95, p = 0.903; maximum lifespan: F2,1 = 93.17, p = 0.146; α: F2,1 = 86.95, p = 0.151; β: F2,1 = 3.75, p = 0.686). Therefore, these parameters were assessed using a two-tailed Student’s t test to test for differences between feeding habits.
The Shapiro-Wilk test of normality showed median and maximum lifespans derived from the semi-natural “mark-release-recapture” cohort to be normally distributed (median: W = 0.94, p = 0.335; maximum: W = 0.93, p = 0.214), and the F-test of equality of variances showed both measures to have equal variances between the two groups (median: F11,4 = 5.24, p = 0.124; maximum: F11,4 = 4.90, p = 0.214), and so these were assessed using a two-tailed Student’s t test to test for differences between feeding habits. The Shapiro-Wilk test showed the Gompertz parameters α and β derived from results in this cohort to be non-normally distributed (α: W = 0.59, p < 0.001; β: W = 0.73, p < 0.001), so these were assessed using a two-tailed Mann-Whitney U test to test for differences between feeding habits.
The Shapiro-Wilk test showed maximum lifespan values from Table 1 to be normally distributed (W = 0.96, p = 0.298), and the F-test of equality of variances this measure to have unequal variances between the two groups (F20,5 = 6.72, p = 0.044), and so these were assessed using a two-tailed Welch’s t test to test for differences between feeding habits.
To control for phylogenetic relatedness, these comparisons were then repeated using the phylANOVA() function from the R package phytools v2.3-063, run with 10,000 simulations using a trimmed phylogenetic tree taken from ref. 15. This package and tree were also used to create the phylogenetic tree in Fig. 1a, and to estimate phylogenetic signal as measured by Pagel’s λ. However, as this evolutionary transition only occurred once, we expect our results to be confounded by phylogeny, with limited power to disentangle these effects. As such, results from these phylogenetic ANOVAs are presented in Supplementary Note 1.
Functional senescence analyses
For analysis of body mass and grip strength data from the pollen-manipulation experiment cohort, linear mixed-effects models were fit using the package lme4 v1.1-3464 for two single-species datasets containing data for each species across their full lifespans (up to week 5 for D. iulia and up to week 17 for H. hecale), as well as for an interspecific dataset containing data for H. hecale and D. iulia up to week 5 (the oldest age at which there was data for D. iulia). All models included individual ID as a random effect to account for the non-independence of repeated measures within the same individual. All single-species “full” models included diet, age, sex, and their three-way interaction as candidate predictors. All interspecific “full” models included species, diet, age, and their three-way interaction as candidate predictors, as well as two-way interactions between species and any candidate predictors found to be significant in the single-species models. Additional candidate predictors included assay time (for body mass and grip strength), expressed as the fraction of the day elapsed since midnight, and eclosion mass (for grip strength), measured in grams. We were primarily interested in within-individual differences related to senescence, and so individual longevity was also included as a fixed effect to control for among-individual differences, ensuring unbiased estimates of the effect of age and thus accounting for the possibility of selective disappearance65. However, models without longevity as a fixed effect did not result in qualitatively different findings, and a brief summary of these results may be found in Supplementary Note 11.
For all models, stepwise backward model selection was implemented by performing an ANOVA on the model with and without a named predictor, to see if inclusion of the predictor significantly improved model fit. The final “best” model was then compared with an intercept-only “null” model to confirm its validity, also using an ANOVA. Age, diet, and species (for the inter-specific models) were always included in the final model as these were the effects of interest, as was longevity, which ensured unbiased age estimates. An ANOVA was then run on the final model to report the significance of named predictors. If an effect was not included in the final model, the nonsignificant result of the ANOVA from model selection resulting in its removal was instead reported.
Reporting summary
Further information on research design is available in the Nature Portfolio Reporting Summary linked to this article.