
Our analysis of 7061 climate-related disaster events from 1990 to 2020 reveals that floods, storms, and landslides account for 89% of the reported events, causing human and economic losses across regions with diverse socioeconomic conditions on all continents (Fig. 1a and Supplementary Table 1). Disasters associated with cold waves, heat waves, and wildfires are predominantly reported in mid and high latitude regions that tend to exhibit high or very high sHDI. In contrast, drought-related disasters are more frequently reported in low-latitude regions, typically characterized by lower levels of development (low or medium sHDI; see Fig. 1a and Supplementary Table 2). The heterogeneous structure of the EM-DAT sample and the geographic variability of reported impacts are reflected in the number of events and in the mix of disaster types across countries (Supplementary Figs. 1 and 2).
Fig. 1: Climate-related disasters and intra-country deviation of human development in impacted regions.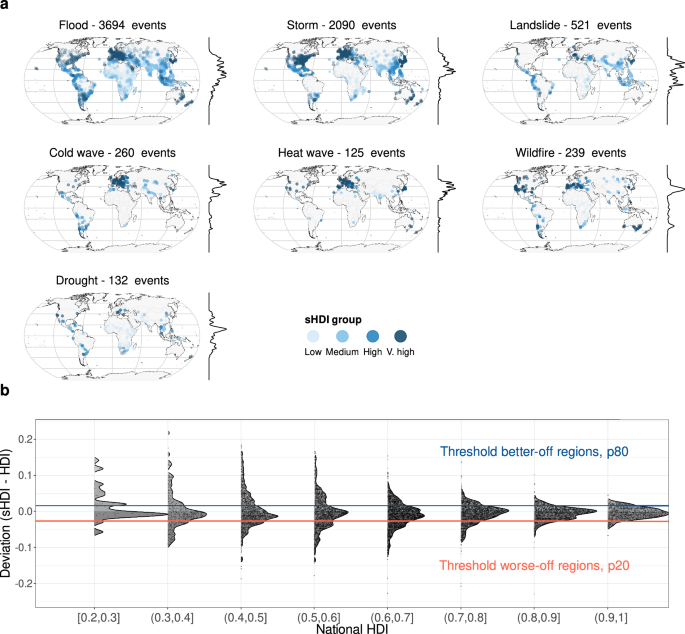
a Locations of climate-related disasters from the EM-DAT colored by sHDI group, shown separately for each disaster type between 1990 and 2020 (total n = 7061; per-type counts indicated in each panel). The four sHDI groups follow the United Nations Development Programme (UNDP) thresholds: low (sHDI < 0.55), medium (0.55 ≤ sHDI < 0.7), high (0.7 ≤ sHDI < 0.8), and very high (sHDI ≥ 0.8). Disaster counts by latitude are shown on the right of each map. Point density reflects only the number of events, and the apparent clustering results from spatial overlap of points, rather than representing any additional variable. Country boundaries and coastlines are from Natural Earth (naturalearthdata.com). Map projection: Robinson. b Difference between sHDI and national HDI for each impacted region, grouped by national HDI bin (x-axis). Horizontal lines indicate the thresholds used to define deviation groups: better-off regions (≥80th percentile, blue) and worse-off regions (≤20th, red); regions between the two thresholds are classified as national-average.
Particularly in countries with low and medium national HDI, disaster-affected regions exhibit notable within-country variability in human development (Fig. 1b). In both groups (HDI < 0.7), worse-off regions (below the 20th percentile of sHDI deviation from the national HDI) and better-off regions (above the 80th percentile) are overrepresented in our sample. While 627 of 1840 low sHDI regions (34%) fall below the national HDI, 540 medium sHDI regions (24%) exceed it (Supplementary Table 3). In contrast, only 5.7% (n = 92) of the very high sHDI regions are below their national HDI, while 12.6% (n = 202) exceed it. Overall, 13.9% of disasters occurred in regions where the sHDI classification differed from the national HDI at the time of impact (Supplementary Fig. 3 and Supplementary Table 4). For example, out of 1347 events reported in countries with high HDI, 214 occurred in medium sHDI regions and 48 in very high sHDI regions.
High and very high sHDI regions show balanced contributions of education, health and income to the composite sHDI (Fig. 2). By contrast, low sHDI regions display a pronounced imbalance, with the health index contributing more strongly than education or income (Fig. 2b). This pattern reflects the fact that health outcomes can improve relatively quickly through the diffusion of medical knowledge and targeted public health interventions, whereas progress in education and income requires long-term institutional capacity and structural transformation29. Because the sHDI is a geometric mean, weak performance in education and income substantially constrains overall development. Similar imbalances are also observed within comparable development levels (regions in the same sHDI group and even within the same country). Worse-off regions consistently lag behind in education and income, making health the dominant driver of their sHDI (Fig. 2e).
Fig. 2: Components of sHDI by sHDI group and deviation from the national HDI.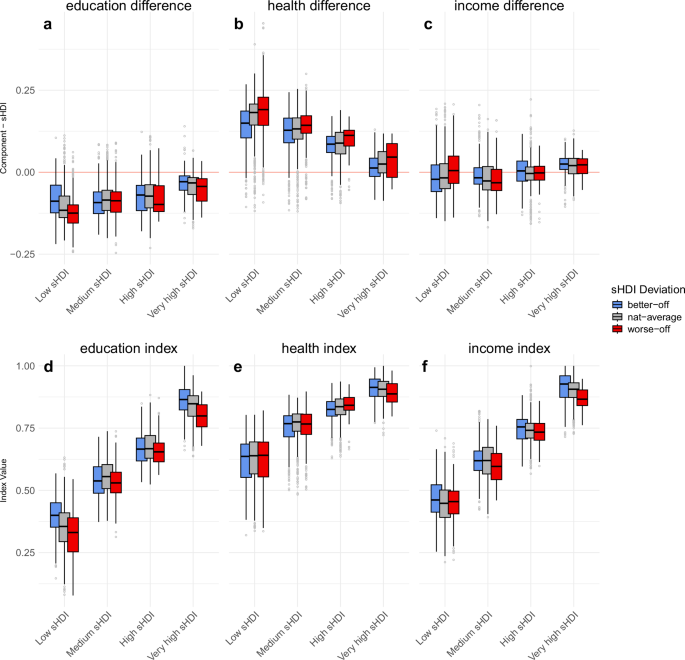
a–c Show the difference between each HDI component—education, health, and income, respectively – and the overall sHDI score (y-axis: Component − sHDI). The horizontal red line at zero indicates equal contribution of the component to sHDI. Positive values indicate an above-average contribution of the component; negative values indicate a below-average contribution. d–f Show the absolute index value of each component. In all panels, colors indicate the deviation from national HDI: better-off (≥ 80th percentile, blue), national-average (> 20th and < 80th percentile, gray; abbreviated to nat-average in the legend), and worse-off (≤ 20th, red). The box plots show the median (center line), interquartile range (box limits, 25th–75th percentiles), 1.5× interquartile range (whiskers), and outliers (individual points beyond the whiskers).
Development drives major shifts in global exposure and impact patterns
Between 1990 and 2020, the majority of population exposure (64.7%) and human losses (83.1% of people affected and 75.3% of fatalities) were reported in regions with low and medium sHDI (Supplementary Table 5). In contrast, 76.6% economic exposure, measured as gross domestic product (GDP), and 78.4% of total economic losses were concentrated in regions with high or very high sHDI (Fig. 3 and Supplementary Table 6). Annual population exposure increased significantly over the same period (p < 0.05) by an average of 150 million people per year, while economic exposure rose by US$2.4 trillion per year (2011 prices; Fig. 3a, e). Despite rising population exposure, there was no corresponding increase in human losses. However, economic losses increased by an average of US$0.98 billion per year (Fig. 3b, c, e). Floods and storms accounted for the majority of the estimated exposure (population 84.6%, economic 81.6%) and reported losses (people affected 87.2%, fatalities 71.2%, economic losses 90%; see Supplementary Fig. 4 and Supplementary Table 7). The observed increase in exposed population and GDP may also reflect underlying demographic and economic growth rather than a direct rise in disaster risk30. This highlights the need to consider relative impact rates (e.g., fatalities per exposed population or economic losses per exposed GDP), which better capture disaster impacts in relation to the scale of exposure. Moreover, as regions and countries change sHDI groups over time, the composition and resilience of their exposed populations and assets also change. Tracking both relative impact metrics and shifts in sHDI groups is therefore essential for understanding the implications of evolving exposure to climate-related disasters.
Fig. 3: Temporal evolution of exposure and disaster impacts from 1990 to 2020 by sHDI group.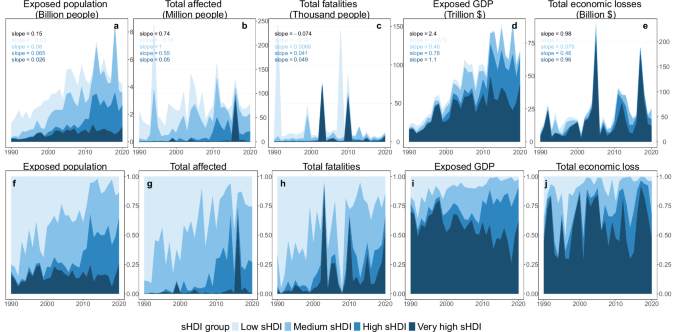
a–e Show annual sums of exposed population (billion people), affected people (million people), fatalities (thousand people), exposed GDP (trillion US dollars), and total economic losses (billion US dollars) as stacked area charts, with shades of blue indicating sHDI from lightest (low) to darkest (very high). Median trends are estimated using quantile regression (τ = 0.5, the 0.5 quantile) for the global aggregate and for each sHDI group separately; the five corresponding slopes per panel are indicated in the figure, and p-values are provided in Supplementary Table 6. f–j Show the proportional share of each sHDI group of the corresponding exposure and impact variable (y-axis, 0–1).
Exposure and impacts are unevenly distributed across the different sHDI groups. As countries and regions achieve higher human development levels, the socioeconomic composition of the exposed populations changes. In 1990, low sHDI regions accounted for the highest share of global population exposure and human losses: over 75% of the exposed population, 88% of people affected, and 65% of fatalities (Fig. 3f–h). By 2020, these values decreased to 14% of the exposed population, 25% of people affected, and 15% of fatalities (Fig. 3f–h). In the past three decades, the share of global exposure in low sHDI group as a whole declined, while increasing in medium, high, and very high sHDI groups both for population and economic assets (Supplementary Fig. 5). These patterns in exposure coincide with observed global development trends26, particularly in India and China (Supplementary Fig. 6). Since 2000, climate-related disaster events have been increasingly reported in medium, high, and very high sHDI regions within these countries. This shift partly explains the increase in population exposure and reported impacts in the medium and high sHDI groups (Fig. 3f, g). The improvement in subnational human development is notable across Asia, which remains the main hotspot for population exposure and human loss (Supplementary Figs. 7 and 8). The same shift did not happen in Africa, where most reported events occurred in low sHDI regions throughout the study period (Supplementary Fig. 9). This heterogeneity reflects distinct country-level development trajectories within each continent (Supplementary Fig. 10). However, the majority of estimated economic exposure and reported losses continue to be concentrated in high and very high sHDI regions (Fig. 3d, e, i, j and Supplementary Fig. 11).
Uneven impact trends across human development groups
To understand the dynamics of vulnerability and adaptive capacity, we used quantile regression to estimate robust median trends in impact rates (affected populations, fatalities, and economic losses), offering insights that are less sensitive to outliers and better reflect typical event outcomes. The analysis shows statistically significant trends (p < 0.05) estimated globally across different sHDI groups (Fig. 4). Overall, median fatality rates show a pronounced negative trend (Fig. 4b), declining 69.8% globally from 1990 to 2020 (Supplementary Table 8). Fatality rates in medium and high sHDI groups also show significant (p < 0.05) negative trends, with values converging to levels similar to those of very high sHDI regions by 2020. The higher fatality rates in low sHDI regions confirm the link between lower socioeconomic development and increased disaster fatalities. In 2020, the median fatality rate in low sHDI regions was approximately 0.05 per 10,000 people—three to five times higher than in other sHDI groups. This negative association between human development and disaster impacts holds consistently across continents and across all impact variables (Supplementary Fig. 12).
Fig. 4: Trends in event-level disaster impact rates from 1990 to 2020 by sHDI group.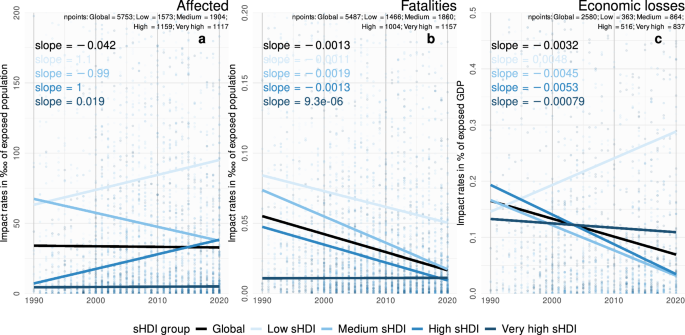
Impact rates are defined as the ratio of reported impacts to potential exposure: affected or fatality counts divided by exposed population, and economic losses divided by exposed GDP. a Shows affected rates, b fatality rates (both in parts per 10,000 of exposed population), and c economic loss rates (as a percentage of exposed GDP), pooled across disaster types. Trends are estimated using quantile regression (τ = 0.5, the 0.5 quantile) for the global aggregate (black line) and for each sHDI group separately; slopes are indicated in the figure, and full results are reported in Supplementary Table 8. The number of observations per sHDI group and globally (n) is indicated in each panel.
The overall reduction in fatality rates at both the global and sHDI group levels is largely driven by a decline in fatalities caused by floods and storms (Supplementary Fig. 13 and Supplementary Tables 9–13). For both disaster types, we observe a convergence among medium, high, and very high sHDI groups. In medium sHDI regions, median fatalities per event decreased by 78.6% for floods and 65.3% for storms (Supplementary Table 14). Although fatalities due to floods also declined significantly in low sHDI regions (by 61.2%), storm-related fatalities in these regions remain disproportionately—four to eight times—higher than in other sHDI groups. This global decline in vulnerability to floods is well documented in the literature14,16,17. While a recent study19 suggests limited progress in reducing vulnerability to floods after the year 2000, our findings strongly indicate substantial improvements during the period from 1990 to 2020. This discrepancy may be attributable to the larger sample size in our analysis (913 events from ref. 19, compared to 3694 in our sample for the whole study period and 3,099 events since 2000). Nonetheless, fatality rates in low sHDI regions remain disproportionately high.
Regarding other disaster types—storms, landslides, and droughts—residents of low and medium-HDI regions experience higher impact rates, in line with previous research14. Higher impact rates are observed for low sHDI regions for both human and economic losses (Supplementary Fig. 13). Only extreme temperature events (heat waves and cold waves) show a contrasting pattern. However, these disaster types represent only 5.5% of the events in our sample, so the lower rates may reflect a weak link between the hazard and the impacted regions’ vulnerability, or may result from limited data availability.
Despite substantial declines in the rates of fatalities and economic losses, the rate at which exposed people are affected in high sHDI regions increased significantly, particularly for floods, storms, landslides, and cold waves (Fig. 4a, Supplementary Fig. 13, and Supplementary Tables 14 and 16). This suggests that rapid urban expansion (especially in high HDI countries31) may increase exposure to hazards like floods32,33, storms, and landslides34 potentially limiting efforts to reduce vulnerability. While improved infrastructure and other social factors can limit fatalities and economic losses, they do not necessarily prevent exposed populations from being affected by these hazards in other ways.
Impact rates are imperfect proxies for vulnerability because they encode information about all elements of the disaster risk, including hazard intensity10,11. Nevertheless, their trends suggest underlying reductions in vulnerability across sHDI groups and continents. Low sHDI regions—concentrated mainly in Sub-Saharan Africa– experience the highest relative human and economic losses, consistent with higher underlying vulnerability. By contrast, Central and South America and large parts of Asia show more heterogeneous patterns, with many regions transitioning to medium and high sHDI levels. Overall, these disparities highlight the uneven global distribution of climate-related disaster impacts and the underlying disaster risk, as well as the importance of local development dynamics in shaping vulnerability. Consistent with these global patterns, the continent-level co-evolution trajectories of sHDI and disaster impacts also indicate gradual improvements in development alongside declining impact rates (Supplementary Figs. 14–16). However, these results do not isolate the influence of hazard intensity on the observed impact patterns. Typically, disaster impact and risk assessment studies14,16,17,18,19 omit the analysis of hazard intensity, and estimate vulnerability from the ratio of reported impacts to modeled or estimated exposure instead. In the following, we aim to address this limitation.
Effects of hazard intensity on impacts are strongly modulated by development level
To understand the influence of hazard intensity on observed impacts, we calculated a composite of meteorological anomalies (Fig. 5) that describes the typical evolution of the hazard associated with each disaster type. Overall, the anomalies exhibit similar patterns across all sHDI regions: floods, storms, and landslides are associated with anomalously high precipitation, runoff, soil moisture, and relative humidity (Fig. 5 and Supplementary Fig. 17). In contrast, heat waves, droughts, and wildfires are associated with concurrent positive temperature anomalies and negative moisture anomalies. The stratification of the climate anomalies by sHDI group shows that hazards tend to be, on average, more intense in regions with higher levels of human development to be reported in EM-DAT (Fig. 5). This pattern, previously observed at the national scale21, suggests that higher human development is associated with a higher hazard intensity threshold required to result in a disaster (Supplementary Fig. 18). In contrast, in regions with low sHDI, higher vulnerability and variable adaptive capacity mean that weaker hazards can already lead to significant adverse impacts.
Fig. 5: Composite climatological anomalies stratified by disaster type and sHDI.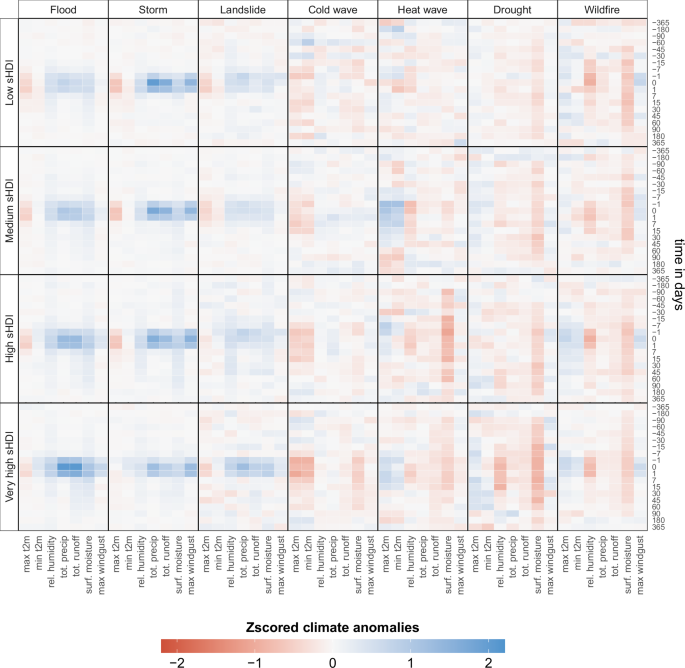
Average climate anomalies are shown per disaster type (columns) and sHDI group (rows). Each panel represents the temporal behavior of selected climate anomalies of a specific disaster type at selected dates ranging from one year before to one year after the reported start of the events (y-axis). Composite anomaly profiles were estimated using SEA67. All climate variables (x-axis) are standardized (zero mean, unit variance) for comparability. Color indicates the z-scored anomaly magnitude, with red denoting positive anomalies and blue denoting negative anomalies. Climate variables: maximum temperature at 2 m (max t2m), minimum temperature at 2 m (min t2m), relative humidity (rel. humidity), total precipitation (tot. precip), total runoff (tot. runoff), surface moisture (surf. moisture), and maximum wind gust (max windgust).
We also examine the association between impact rates and the intensity of hazard-related hydrometeorological anomalies. Overall, the distance correlation between impact rates and hazard intensity is weak, particularly for floods (Supplementary Fig. 19). However, when we stratify these correlations by sHDI groups, stronger and statistically significant associations emerge (Supplementary Fig. 20; p < 0.05). In the case of floods, the distance correlations between total daily precipitation, total daily runoff, and all impact rates are statistically significant and systematically higher in the low, medium, and high sHDI groups (Supplementary Fig. 20). For heat waves, higher rates of affected people and fatalities in very high sHDI regions are significantly correlated with maximum daily temperature. Not all correlations are meaningful, though. Low correlations in fatality rates due to floods do not imply that hazard intensity is unrelated to impacts, as disasters cannot occur without the hazard itself. Rather, we interpret these cases as instances where the effect of hazard intensity on impacts is strongly modulated by the socioeconomic status of the impacted region (i.e., sHDI) and the corresponding vulnerability levels. To assess whether these patterns persist when hazard intensity is held approximately constant, we further stratified flood and storm events into intensity bins. Across all comparable hazard intensity ranges, the development-impact gradients remain evident (Supplementary Figs. 21 and 22).
Together, these findings indicate that climate-related hazards need to be more intense to cause impacts in regions with higher levels of socioeconomic and human development. This underscores the importance of incorporating hazard intensity into impact and vulnerability assessments. Furthermore, it provides evidence of the higher vulnerability in low sHDI regions: less severe climate hazards result in higher impact rates, thereby putting these regions disproportionately at risk compared to other groups.
Unequal human development, unequal disaster risk
To quantify the comparative risk of different disaster types per sHDI group, we calculated the odds of impacts within each sHDI group and compared them to those in very high sHDI regions, which serve as the baseline. A coefficient greater than 1 indicates a higher risk of impact in the considered sHDI group, whereas a coefficient less than 1 indicates a higher risk of impact in the very high sHDI group.
Given the available data, significant odds ratios (p < 0.05) show that the likelihood of human losses—both people affected and fatalities—is disproportionately higher in low and medium sHDI groups (Fig. 6; p-values and 95% CI in Supplementary Tables 17–19). For example, when exposed, a resident of a low sHDI region faces, on average, a risk of fatalities three times higher due to floods and 8.2 times higher due to storms, compared to a resident of a very high sHDI region. In high sHDI regions, these comparative risk factors drop to 2.4 for floods and 0.45 for storms. The likelihood of being affected shows a similar pattern; overall, across all disaster types, the risk is 3.4 times higher in low sHDI, 2.4 times in medium sHDI, and 1.6 times in high sHDI than in regions with very high sHDI.
Fig. 6: Odds ratios comparing disaster impact likelihood across subnational human development groups and disaster types.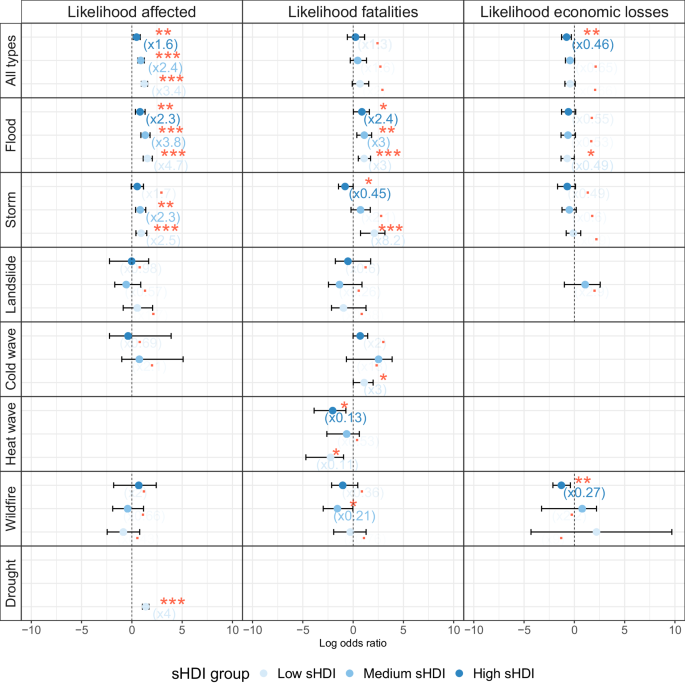
Odds ratios (ORs) from logistic regression comparing the likelihood of impacts – affected people, fatalities, and economic losses – between low, medium, and high sHDI groups and the very high sHDI reference group, shown both pooled across all disaster types and stratified by individual disaster type. Points represent \({\log }_{10}\)-transformed odds ratios (\({\log }_{10}({{\rm{OR}}})\); x-axis), while adjacent labels indicate the corresponding OR values. The vertical dashed line (\({\log }_{10}({{\rm{OR}}})=0\)) denotes no difference relative to the reference group (OR = 1); OR > 1 indicates a higher likelihood of impact occurrence, whereas OR < 1 indicates a lower likelihood relative to the very high sHDI group. The horizontal bars indicate 95% confidence intervals estimated by bootstrapping the logistic regression coefficients (5000 iterations). Asterisks indicate statistical significance (non-significant, *p < 0.05, **p < 0.01, ***p < 0.001).
Heat waves are an exception. The risk of human loss from heat waves is significantly higher in very high sHDI regions (Fig. 6). On average, fatalities in these regions are nine times higher than in low sHDI regions and 7.9 times higher than in high sHDI regions. One potential explanation is that the estimated vulnerability or resilience to one specific hazard type is not necessarily applicable to another, since different hazard types have distinct impact mechanisms and, consequently, different vulnerability factors. In this case, demographics may play an important role, as aging populations—more prevalent in very high sHDI regions—are more vulnerable to heat mortality35. However, the reported odds ratios only reflect the events included in our dataset. Therefore, another explanation could be reporting bias for heat waves: such events may be underreported in low and medium sHDI groups36,37. Very high sHDI regions, where impact estimates are also of higher quality37, account for 58% of reported heat waves.
Similarly, in the case of droughts, we hypothesize that the calculated coefficient may not reflect the real disparity in comparative risk for low sHDI regions—the sHDI group where the affected numbers and rates associated with droughts have the sharpest increase (Supplementary Figs. 5 and 13). In very high sHDI regions, too few droughts are considered and reported as climate-related disaster events, which limits comparability. In high and very high sHDI regions, droughts are perceived mainly as financial or insurance issues, unlike in low sHDI regions, where droughts represent food security threats38.
Regarding economic losses, we find that very high sHDI regions are at greater risk in only a few cases. For example, they face greater risk compared to high sHDI regions across all disaster types, and compared to low sHDI regions specifically in the case of floods. The absence of significant coefficients in most other cases —especially for floods and storms, where far more observations are available— suggests comparable risk levels of relative economic losses. This finding is supported by the comparable levels of economic loss rates observed across storms and floods (Fig. 4c and Supplementary Fig. 13), where sample sizes are robust (Table 1). For the low sHDI group, and landslides and wildfires as a whole, data are scarce, and results should be interpreted with caution. Overall, the absolute economic losses are orders of magnitude higher in very high sHDI regions compared to all other groups (Fig. 3e and Supplementary Fig. 4). However, event-level consequences may be more severe for low and medium sHDI regions due to reduced insurance penetration39 and weaker social safety nets in general.
Table 1 Counts and percentages of missing values for the three impact variables (number of affected people, number of fatalities, and economic losses) per disaster type and sHDI group
To account for intra-country inequalities in the risk assessment, we recalculated the comparative risk coefficients using very high sHDI as the baseline, comparing all other sHDI groups stratified by the deviation from national HDI. Due to the limited number of observations available for most disaster types, we only present results for floods, storms, and all disasters combined. Although the recalculated comparative risk coefficients follow similar patterns to the previous analysis, the risk of human loss is amplified for lower human development levels associated with negative deviations from the national HDI (Fig. 7; p-values and CI in Supplementary Tables 20–22).
Fig. 7: Odds ratios comparing disaster impact likelihood across subnational human development groups, stratified by deviation from national HDI and disaster types.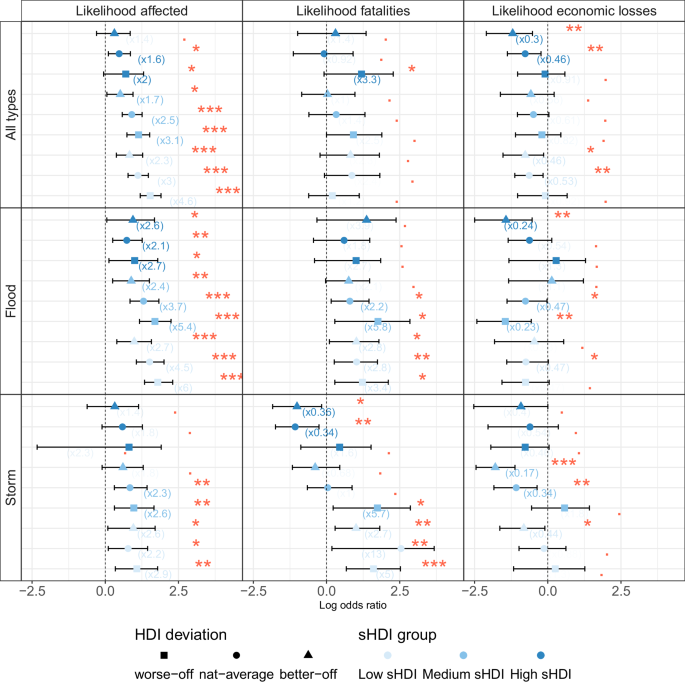
Odds ratios (ORs) from logistic regression comparing the likelihood of impacts – affected people, fatalities, and economic losses—between the very high sHDI reference group and all combinations of sHDI group (low, medium, and high) and deviation from national HDI (better-off, national-average, worse-off), shown pooled across all disaster types and separately for floods and storms. Points represent \({\log }_{10}\)-transformed odds ratios (\({\log }_{10}({{\rm{OR}}})\); x-axis), while adjacent labels indicate the corresponding OR values. The vertical dashed line (\({\log }_{10}({{\rm{OR}}})=0\)) denotes no difference relative to the reference group (OR = 1); OR > 1 indicates a higher likelihood of impact occurrence, whereas OR < 1 indicates a lower likelihood relative to the very high sHDI group. The shape represents the deviation category (better-off, national-average, or worse-off relative to national HDI), and color indicates the sHDI group. Horizontal bars indicate 95% confidence intervals estimated by bootstrapping the logistic regression coefficients (5000 iterations). Asterisks indicate statistical significance (non-significant, *p < 0.05, **p < 0.01, ***p < 0.001).
In medium and low sHDI regions, deviations from the national HDI have a clear influence on the likelihood of impact. The risk of being affected, across all disaster types, is higher in subgroups with negative deviations from national HDI (worse-off) and lower in subgroups with positive deviations (better-off) or those matching the national average. This effect is particularly pronounced for floods and storms. Overall, these results indicate that both between-group and within-group sHDI inequalities are relevant for determining risk. More importantly, the most vulnerable people are typically the most disadvantaged in terms of human development at both levels.
However, there are some diverging patterns. For example, in low sHDI regions, the highest risk of fatalities from storms is observed in the national-average subgroup (13 times higher than in very high sHDI) rather than in the worse-off subgroup (5 times higher). Such discrepancies may be attributed to natural factors, like geographic location or topography, which can exacerbate vulnerabilities beyond regional development levels. Another notable exception is the worse-off subgroup of the medium sHDI regions. In all examined cases, the comparative risk of human loss is distinctly higher for this subgroup and approaches levels observed in low sHDI subgroups. In fact, medium sHDI regions show the widest range of risk coefficients, with the better-off subgroup exhibiting similar risk levels to high sHDI regions. Given that medium sHDI regions have the widest range of deviations from the national HDI (Fig. 1b), this emphasizes the importance of considering both between-group and within-group inequalities in human development when estimating the risk of adverse impacts caused by climate-related hazards.