
Study populationRotterdam Study
The Rotterdam Study is a prospective population-based study from the Ommoord district of Rotterdam, The Netherlands. In 1990, the study was initiated with the inclusion of 7,983 partcipants aged 55 years or older (RSI). It was expanded with the addition of a new cohort of 3,011 participants ≥55 years of age (RSII) from 2000 to 2001 and a further cohort of 3,932 participants aged 45 years or older recruited during 2006−2008 (RSIII). All study participants were extensively interviewed and physically examined at their baseline visits and after every 3−6 years. The study has been approved by the Medical Ethical Committee of Erasmus Medical Center and by the Ministry of Health, Welfare and Sport of The Netherlands. Written informed consents were obtained from each study participant to participate and to collect information from their treating physicians67. In the present work, we included data from participants of the RSIII cohort collected at the second follow-up (RSIII-2) for which gut microbiota, metabolomics and genetic data were available. We replicated our findings on general cognition in an independent sample from the fourth follow-up of the RSI cohort (RSI-4), which is unrelated to the discovery RSIII cohort (that is, independent recruitment without overlaps in participants). In RSI-4, metabolomics data were available for 874 participants without dementia or stroke diagnosis during follow-up (9.16 ± 3.33 years) and for 355 participants with incident AD. Note that this sample was enriched for incident AD cases and dementia/stroke-free controls. The mean follow-up time between blood collection and onset of AD symptoms was 5.14 years (s.d. = 4.05 years).
Assessment of lifestyle, clinical factors and medication intake
In the Rotterdam Study cohorts, information about lifestyle, clinical factors and medication intake was collected using structural interviews, medical records and pharmacy data during multiple visits. Information about lifestyle factors such as smoking, alcohol consumption and educational attainment was collected based on structured home interviews. Smoking data were classified as never, former or current smokers. Educational attainment was assessed at the baseline visit of the Rotterdam Study cohort and categorized into four groups based on the United Nations Educational, Scientific and Cultural Organization (UNESCO) classification: (1) primary education, (2) lower/intermediate general education or lower vocational education, (3) intermediate vocational education or higher education and (4) higher vocational education or university level68. In our study, we combined the education categories (1) and (2) into primary education. Alcohol consumption was assessed as part of dietary interviews, and alcohol intake in grams per day was calculated based on the number of drinks multiplied by the average amount of ethanol in one drink of the alcoholic beverage69. BMI was calculated based on height and weight (kg m−2), which were assessed in participants in standing positions without shoes and heavy outer garments. Medical history (clinical factors) and medication intake were compiled based on various sources, including general practitioner records, pharmacy prescription records or a physical examination at the study center. Blood pressure was recorded at the time of the patients’ visit to the study center at the right upper arm in a seated position; the mean of two measurements was recorded. Glucose levels were measured after overnight fasting (8–14 hours); diabetes was defined as fasting serum glucose levels ≥7.0 mmol l−1, non-fasting serum glucose levels ≥11.1 mmol l−1 and/or the use of antidiabetic medication (Anatomical Therapeutic Chemical (ATC) code A10)70.
Genotyping and imputations
Blood from the Rotterdam Study participants was collected during the baseline visit of RSIII. DNA was extracted from blood, and genotyping was performed using the 550K, 550K duo or 610K Illumina arrays. During the genotyping quality control for genetic variants, we applied exclusion criteria, including call rate <95%, Hardy−Weinberg equilibrium P < 1.0 × 10⁻⁶ and minor allele frequency (MAF) < 1%. Sample exclusion criteria included excess autosomal heterozygosity, call rate <97.5%, ethnic outliers and duplicates or family relationships. Genotypes were imputed using the Markov Chain Haplotyping (MACH) package and minimac software71 to the 1000 Genomes phase 1 version 3 reference panel72. Among the 1,068 participants with metabolomics data (after preprocessing), genotyping information was available for 925 participants.
Metabolomics profiling
We profiled blood plasma samples of 1,082 participants of the RSIII-2 cohort using the untargeted Metabolon HD4 platform. The resulting dataset includes 1,387 metabolites of different classes (lipids, amino acids, xenobiotics, nucleotides, cofactors and vitamins, peptides, carbohydrates, energy-related metabolites and uncharacterized metabolites). The details of the Metabolon HD4 analytical methods and data extraction procedure were described elsewhere and are briefly summarized in the Supplementary Text. Based on the batch-normalized data as provided by Metabolon, additional preprocessing steps were performed. First, 14 participants for whom the proportion of missing values across metabolites was greater than 5 × s.d. of the mean missingness in all participants were excluded. Then, metabolites with missingness greater than 70% were excluded. For the remaining metabolites, the coefficient of variance of the 64 aliquots of the NIST Standard Reference Material (SRM) 1950 sample, which were measured throughout the experiment, was determined, and metabolites with coefficient of variance greater than 30% were excluded, leaving 1,111 metabolites after the quality control steps. For the present work, we used data on only the 991 frequent metabolites (missingness less than or equal to 30%). After log2 transformation, we imputed the missing values applying a k-nearest neighbor approach, which has been shown to provide robust imputation for metabolomics data73. z-transformation (µ = 0, s.d. = 1) was applied for each metabolite before the association analysis. A detailed flowchart of quality control and preprocessing steps is provided in Supplementary Fig. 1.
Gut microbiome profiling
Detailed information regarding the collection of fecal samples in the RSIII cohort and the subsequent sequencing procedures were described previously74. These sequence data were subjected to a specific 16S rRNA profiling pipeline. In short, raw reads were demultiplexed using a custom script to separate sample FASTQ files based on the dual index. Primers, barcodes and heterogeneity spacers were trimmed off using TagCleaner version 0.16 (ref. 75). Trimmed FASTQ files were loaded into R (version 4.0.0) with the DADA2 (ref. 76) package version 1.18.0. Quality filtering was performed in DADA2 using the following criteria: trim = 0, maxEE = c(2,2), truncQ = 2 and rm.phix = TRUE. Filtered reads were run through the DADA2 amplicon sequence variant (ASV) assignment tool to denoise, cluster and merge the reads. ASVs were assigned a taxonomy from the SILVA version 138.1 rRNA database77 using the Ribosomal Database Project naive Bayesian classifier78. The resulting data tables were combined into a phyloseq object using phyloseq79.
To remove spurious and likely false-positive ASVs, both an abundance and a prevalence filter were applied to the data. ASVs had to contain at least 0.005% of the total reads to remain in the dataset as well as to be present in at least 1% of the samples and were otherwise removed. Samples were also removed based on several other criteria such as being a possible sample swap, ≥8 days in the mail, known duplicates or poor quality control statistics. For this step, samples with fewer than 4,500 reads or those that lost more than 50% of reads in the last steps of the DADA2 quality control (that is, samples with many reads but for which reads were distributed mainly at rare ASVs) were removed from the data. Also, samples with 4,500−6,000 reads that lost more than 20% of reads in the last steps of the DADA2 quality control were excluded. Alpha diversities were calculated based on this filtered phyloseq object. Additionally, a phylogenetic tree was constructed based on the center sequences of each ASV using the phangorn package, and the result was added to the phyloseq object80. Finally, ASV IDs were recoded to numerical IDs, ordered on ASV abundance within the population.
Assessment of general cognition
A neuropsychological assessment battery was introduced in the Rotterdam Study between 2002 and 2005 for evaluating cognitive function. This battery of tests included the Stroop test (reading, color naming and interference tasks), a letter-digit substitution task (LDST), a categorical Word Fluency Test (WFT), Purdue Pegboard (PPB) tests for both hands individually and combined and a 15-word verbal learning test based on Rey’s recall of words (15-WLT). A composite measure of overall cognitive function known as ‘gfactor’ was calculated using principal component analysis, as detailed previously81. This gfactor consists of scores from the Stroop interference test, LDST, verbal fluency task, PPB test and 15-WLT delayed recall score.
MRI features
MRI scanning has been performed within the Rotterdam Study using a 1.5-Tesla MRI unit equipped with a dedicated eight-channel head coil (Signa HD platform; GE Healthcare). Brain volumetric measurements, including brain volume, WML volume and intracranial volume, were estimated through automated segmentation82,83. Left and right hippocampal volumes were obtained using FreeSurfer (version 5.1) and averaged to determine total hippocampal volume. Participants with severe strokes that could potentially affect segmentation were excluded from the MRI marker analysis. Further details regarding MRI scanning and preprocessing can be found elsewhere84. In our MRI sample (n = 925), the mean interval between blood collection and MRI was 0.86 years (s.d. = 1.54), with a median of 0.18 years (interquartile range (IQR) = 0.97) and a range of 0−7.97 years.
Statistics and reproducibility
No statistical method was used to predetermine the study sample size; however, the sample size was similar to previous large-scale metabolomics investigations in population-based settings4,5,6,7,8,9,10,11,12,13,14,15. For metabolite profiling, samples were blinded to the metabolomics service provider (Metabolon) and were randomized across analytical plates to minimize batch effects. During metabolomics data preprocessing, samples with a high proportion of missing metabolite measurements were excluded, as detailed in the metabolomics preprocessing workflow (Supplementary Fig. 1). Associations between metabolites and study outcomes were evaluated primarily using linear regression models or Cox proportional hazards models. Gradient boosting decision tree (GBDT) models were used to evaluate the proportion of variance in blood levels of metabolites explained by different classes of features. Detailed descriptions of the statistical analyses, including specific sample sizes, data transformations and coding of variables, type of statistical model and model parameters, covariates, software packages and R libraries, are provided in the corresponding subsections below. Where applicable, multiple testing was controlled using the Benjamini−Hochberg FDR procedure85. All analyses were performed using R (versions R 4.1 and 4.5.1) and Python (version 3.8.5).
Association of metabolites with general cognition and MRI markers
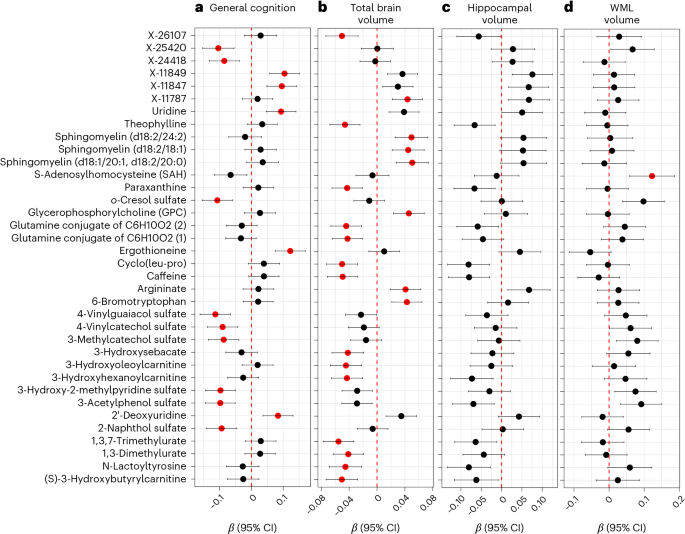
To evaluate the association of metabolites with general cognition and MRI markers, we performed linear regression analysis. In the association analyses between general cognition and metabolites, we adjusted the models for age, sex, BMI and lipid-lowering medication (model 1) and additionally for education (model 2). In sensitivity analyses, we further adjusted for smoking, hypertension and diabetes (model 3). Among the MRI markers, we selected total brain volume, hippocampal volume and WML volume as brain markers of neurodegeneration and vascular health. Natural log transformation and z-transformation (µ = 0, s.d. = 1) were applied before the linear regression analysis. Distributions of log-transformed phenotypes and metabolite levels were visually inspected to confirm that distributions were close to a normal distribution, but this was not formally tested. In the linear models, we adjusted for age at blood collection, the time difference between blood collection and MRI scan, sex, BMI, lipid-lowering medications use and intracranial volume (model 1). In model 2, we additionally adjusted for smoking, hypertension and diabetes. In sensitivity analyses of MRI associations, we performed the regression analysis using model 1 after excluding participants with more than 1 year between blood collection and MRI (n = 688). Associations were considered statistically significant at FDR < 0.05.
We also performed a longitudinal analysis of the association between baseline metabolite levels and changes in cognition in the discovery (RSIII-2) cohort. Follow-up cognitive assessment was available for 510 participants at the third visit (RSIII-3), with mean follow-up duration of 9.88 years (s.d. = 1.03; range, 7.18–11.77 years). The mean age at baseline for these participants was 61.27 years (s.d. = 4.85). We used linear mixed-effects models with the nlme R package86, including participant ID as random intercepts to account for interindividual variation. Follow-up time in years was calculated from the baseline metabolomics visit. Fixed effects included baseline age, sex, BMI, lipid-lowering medication use, follow-up time, metabolite level and their interaction (follow-up time × metabolite). The interaction coefficients estimate the difference in annual cognitive change per 1 s.d. increase in metabolite level.
In addition to the univariate association analyses, we applied elastic net regularization to model general cognition and MRI phenotypes in the RSIII-2 cohort based on all metabolites, using the glmnet package in R87. The dataset was randomly divided into 80% for training and 20% for testing. Hyperparameters were optimized through 10-fold cross-validation, using the root mean squared error (RMSE) as the performance criterion. Model performance was reported as the proportion of variance explained for each phenotype. In addition, we provide the sets of metabolites with non-zero β coefficients from the elastic net models as multivariate metabolic signatures for the respective traits.
Sex-stratified association analysis
To evaluate the sex-specific association of metabolites with general cognition and MRI markers in RSIII-2, we introduced an interaction term (sex × metabolite) in model 1. Metabolites showing evidence of interaction (P < 0.05) were further examined in sex-stratified analyses, adjusting for age, BMI and lipid-lowering medication use. The findings of the sex-stratified association of metabolites with general cognition were further replicated in RSI-4. We performed a power calculation based on post hoc interaction analysis in cognition using non-central t-distribution and the interaction term estimate and standard error of our top metabolite, NAAG. Although the power to detect a sex interaction effect of this size was approximately 80% at a nominal α = 0.05, the estimated power dropped to approximately 10% when applying Bonferroni correction for testing 991 metabolites.
Replication of association results in the RSI-4 cohort
We replicated our association results of metabolites with general cognition in a dementia-free and stroke-free sample (n = 874) of RSI-4. We used linear regression adjusting for age, sex, BMI and lipid-lowering medication (model 1), with additional adjustment for educational attainment (model 2) and further adjustment for smoking, hypertension and diabetes in model 3. The MRI measurements were not available for this sample.
Replication of association results in the AGMP study
For further replication of the cognition-associated blood metabolites, we assessed their association with three cognitive scores in individuals who were recruited into the AGMP through participating ADRCs across the United States. The AGMP ADRC study is a multi-institution collaborative research initiative to define how interconnected factors, such as the exposome, diet, lifestyle, gut microbiome and AD genotypes, influence the metabolome (https://alzheimergut.org/). Written consent for study participation was obtained by each ADRC under institutional review board review and approval. All study procedures were in accordance with the Declaration of Helsinki and allowed deidentified data to be shared among preapproved researchers. Plasma levels of the tested metabolites were available for 512 participants (mean age 72.2 ± 7.81 years; mean BMI 27.3 ± 5.38 kg m−2; 61% females; 73% normal cognition, 9% dementia; 79% White, 19% African American, 2% Asian) from seven ADRCs. The levels were determined using the same metabolomics approach as applied in the Rotterdam Study. We tested the metabolites’ associations with the CRAFTDRE (mean = 15.6, s.d. = 4.68), UDSBENTD (mean = 10.5, s.d. = 3.86) and NACCMOCA (mean = 25.2, s.d. = 4.17).
Linear regression models were used to assess the association of metabolites with the three cognitive outcomes and the association of ergothioneine with PPI intake while adjusting for age, sex, BMI, APOE genotype and intake of lipid-lowering medication. Missing BMI data (approximately 10%) were imputed based on data from lipidomics and Nightingale Health platforms.
Association of metabolites with incidence of AD
To evaluate the relationship of blood metabolites with incidence of AD prospectively, we performed Cox proportional hazard analysis adjusted for age, sex, BMI and lipid-lowering medication use in RSI-4 participants, where metabolomics data for 355 participants with incident AD and 874 controls without dementia during follow-up were available. Mean follow-up time of participants with incident AD was 5.14 years (s.d. = 4.05 years).
Association of metabolites with gut microbial and exposomal features
For the association analyses between gut microbiota and circulating metabolites, we performed central log transformation (CLR) on each of the taxonomic levels of the gut microbiome dataset, including phylum, class, order, family, genus and species, using the microbiome package88. We performed linear regression analysis to evaluate the association between the plasma levels of metabolites (z-transformed) and gut microbial taxa, correcting for effects of age, sex, BMI, medication use (PPIs, metformin, lipid-lowering medication and antibiotics), lifestyle factors (smoking and alcohol intake) and technical covariates such as DNA extraction batch, sequencing batch and time of feces in the mail. We also performed linear regression analysis to evaluate the association of individual features included in medication use (31 medications), lifestyle (BMI, alcohol consumption in grams per day, smoking and education level) and clinical factors (diabetes, hypertension, diastolic blood and diastolic blood pressure), using metabolites as outcome variable. All analyses were adjusted for age at blood collection for metabolomics and sex. We applied the significance threshold of 5% FDR in each set of tested features separately.
EV of metabolites
To calculate the EV of 991 circulating metabolites by genetics, gut microbiota, medication use, lifestyle and clinical features, we used the GBDT algorithm from LightGBM (version 2.1.2). We thereby adopted the approach described in Bar et al.25. For each group of features, we calculated the EV of each metabolite using five-fold cross validation. The coefficient of determination (R2) × 100 was interpreted as percentage EV of a metabolite. In the EV calculation for gut microbiota, we used the following parameters: learning_rate = 0.005, feature_fraction = 0.2, min_data_in_leaf = 15, metric = l2, early_stopping_rounds = None, n_estimators = 2000, bagging_fraction = 0.8, bagging_freq = 1. To estimate the EV by the remaining features (genetics, medication use, lifestyle and clinical features), we used the parameters as predetermined in the LightGBM package: learning_rate = 0.01, max_depth = 5, feature_fraction = 0.8, num_leaves = 25, min_data_in_leaf = 15, metric = L2, early_stopping_rounds = None, n_estimators = 200, bagging_fraction = 0.9, bagging_freq = 5.
The genetic, medication, clinical and lifestyle components were defined as follows:
Genetics
To calculate percentage EV by genetics, we performed a genome-wide association study (GWAS) for each of the 991 metabolites individually, using HASE software89. Only SNPs with imputation quality R2 > 0.3 and MAF > 0.05 were considered. For SNPs with marginal significance of association with any metabolite (P < 5 × 10⁻⁸), we performed clumping using PLINK 1.9 software90 with a P value threshold of 5.0 × 10⁻⁸ and a linkage disequilibrium threshold (r2) of 0.2 in the 500-kilobase region. In total, 415 independent SNPs reached a significance for 991 metabolites. We extracted their dosage information from the genotype imputed data in the Rotterdam Study participants. In the second step, we used GBDT to calculate the percentage EV of each metabolite by genetic features. For this purpose, we only used genetic variant features associated with that particular metabolite (P < 5 × 10⁻⁸) informed by GWAS summary statistics and clumping. We only considered metabolites explained by genetic features with a coefficient of determination (R2) greater than zero and FDR < 0.05 for the P values of the Spearmanʼs correlation coefficient from the GBDT model. In addition, we calculated heritability estimates (H2) for all 991 metabolites based on the massively expedited genome-wide heritability analysis (MEGHA) method91. Due to the small sample size for heritability calculations, we retained heritability estimates of metabolites greater than zero.
Medication use
We defined medication intake features based on yes/no information for 31 general medications for which data were recorded in the RSIII-2 cohort. We included only those medications reported to be used by at least 1% of our participants (n = 1,068).
Gut microbiota
ASV information of all six taxonomic levels, including phylum (n = 10), class (n = 17), order (n = 38), family (n = 62), genus (n = 190) and species (n = 151), were used in 922 participants.
Lifestyle
In the EV calculation for lifestyle factors, we considered BMI, alcohol consumption in grams per day, smoking (current, former and never) and education level (lower, middle and high). Lifestyle information was available for 1,054 participants with metabolomics data available.
Clinical factors
Common clinical information, including diabetes, hypertension, systolic and diastolic blood pressure, was used. Full information on clinical parameters was available for 1,054 participants with metabolomics data.
Mediation analysis between blood metabolite levels and drug intake
To identify the role of drug-associated metabolites as mediators of drug effects on general cognition, we performed mediation analysis using the ‘mediation’ R package. Specifically, we evaluated the role of ergothioneine as mediator in the association between the use of antacids, psychoanaleptics and thyroid therapy and general cognition in the RSIII-2 cohort.
Smoking-stratified association of metabolites with general cognition
To evaluate the role of smoking in the association of seven sulfates with general cognition, we performed a smoking-stratified linear regression analysis of these metabolites with general cognition, adjusting for age, sex, BMI, lipid-lowering medication and educational attainment in current smokers, former smokers and never smokers.
Reporting summary
Further information on research design is available in the Nature Portfolio Reporting Summary linked to this article.