
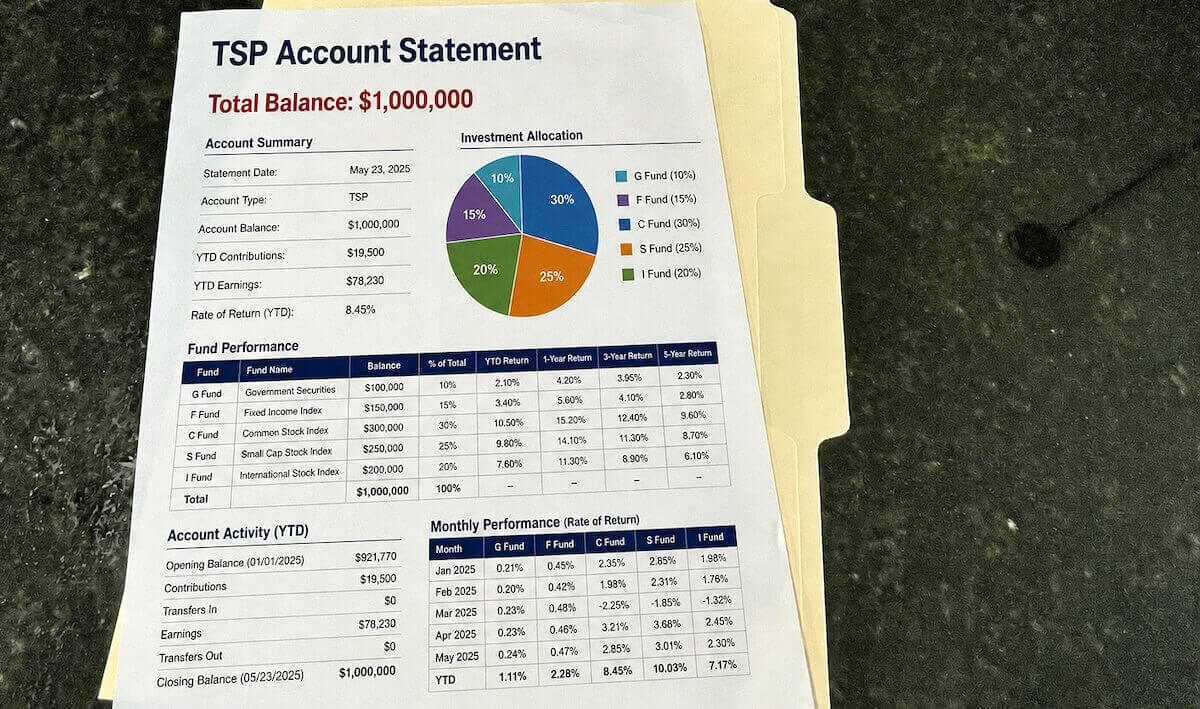
The number of Thrift Savings Plan (TSP) millionaires reached an all-time high of 224,420 as of July 1, 2026, according to new participant data reported by the Federal Retirement Thrift Investment Board (FRTIB). The figure surpasses the previous record of 194,722 set at the end of December 2025 by 15.2%, and it reverses a decline recorded earlier this year.
Total TSP millionaires had fallen to 184,532 as of April 1, 2026 amid a rough first quarter for two of the plan’s core stock funds. The rebound to 224,420 by July 1 represents a 21.6% increase in a single quarter, the largest quarterly jump in the FRTIB’s account-balance data series since 2020.
Distribution of TSP Account Balances (Q2 2026)
The table below shows the full breakdown of TSP account balances as of July 1, 2026, along with the average years of contributions for each tier.
Account BalanceNumber of AccountsAverage Years of Contributions<$50k4,095,1346.07$50k–$249k1,928,15013.64$250k–$499k630,50919.23$500k–$749k280,37921.96$750k–$999k146,68623.85≥ $1 million224,42027.25Total7,305,27810.82
The largest individual account balance in the TSP is now $10.26 million, up from $9.30 million three months earlier. That is the highest the figure has been in over a year, though it remains below the all-time peak of $10,975,527 recorded at the end of 2021.
A Rebound Driven by Market Gains, Not New Savers
The total number of TSP accounts barely changed over the same period, rising from 7,278,346 as of April 1 to 7,305,278 as of July 1, an increase of less than 0.4%. The jump in the millionaire count is therefore almost entirely a function of existing balances crossing the $1 million threshold as markets rallied, rather than a wave of new savers or additional accounts entering the plan.
That rally was broad. According to FedSmith’s own tracking of TSP fund performance in the second quarter, all three core stock funds posted double-digit gains between April and June.
TSP FundQ2 2026 (Compounded)2026 Year-to-Date (Through June 30)G Fund1.12%2.18%F Fund0.70%0.74%C Fund15.20%10.20%S Fund19.88%18.41%I Fund14.42%16.53%
The S Fund led the second-quarter recovery, followed closely by the C Fund and the I Fund. That broad-based performance across all three stock funds, rather than strength concentrated in a single fund, lines up with a millionaire count that rebounded across account tiers rather than in a handful of the very largest accounts.
How the Count Has Swung in 2026
The record follows a volatile stretch for TSP investors. The table below shows the progression of TSP millionaires since March 2020.
DateNumber of TSP MillionairesGrowth from Previous PeriodMarch 202027,212—June 202045,21966%December 202075,42067%June 202198,87931%December 2021112,88014%June 202272,241-36%December 202276,8896%June 2023100,53431%December 2023116,82716%March 2024134,93215%June 2024140,4034%March 2025146,9105%June 2025171,02316%September 2025189,83611%December 2025194,7222.6%March 2026184,532-5.2%June 2026224,42021.6%
Number of TSP Millionaires by Quarter, March 2020 to June 2026
Bar chart of TSP millionaire counts for 17 periods from March 2020 through June 2026. The count climbed from 27,212 to a record 194,722 by December 2025, dipped to 184,532 in March 2026, then rebounded to a new record of 224,420 in June 2026.
0
40k
80k
120k
160k
200k
240k
Number of TSP millionaires
Mar ’20
Jun ’20
Dec ’20
Jun ’21
Dec ’21
Jun ’22
Dec ’22
Jun ’23
Dec ’23
Mar ’24
Jun ’24
Mar ’25
Jun ’25
Sep ’25
Dec ’25
Mar ’26
Jun ’26
Previous record: 194,722 (Dec 2025)
194,722
184,532
224,420 (record)
What the Data Do Not Show
The FRTIB does not publish participant-level detail behind the headline figures. We do not know, for instance, any details about the individual with the largest total account balance, such as how long s/he has been investing in the TSP or if any of the funds were rollovers from other outside plans.
The FRTIB’s own notes confirm that the account-balance figures include rollovers from other qualified retirement plans. As a result, a portion of the growth in any tier, including the number of millionaires, cannot be attributed solely to TSP contributions or market performance. The agency does not report what share of the total reflects rollover activity as opposed to investment growth.
A Plan Increasingly Powered by Markets, Not New Money
According to the FRTIB’s most recent monthly participant statistics, total TSP assets grew from $1.073 trillion at the end of 2025 to $1.156 trillion as of May 2026, even as the plan’s cash flow turned negative.
TSP participants withdrew or disbursed $33.98 billion through loans and withdrawals in the first five months of 2026, compared to $22.40 billion in contributions and loan repayments, a net outflow of $11.58 billion for the year so far. That follows a similar shift in 2025, when withdrawals outpaced contributions by roughly $19 billion for the full year, a reversal from the smaller but consistently positive net inflows the plan recorded from 2016 through 2023.
The timing lines up with the shrinking federal workforce over the past 15 months, which has left fewer active employees contributing new payroll deductions while a growing share of participants, many of them recent retirees, draw down their balances. Even so, the combination of a record number of TSP millionaires and record total plan assets shows that market returns, not net new dollars, kept both figures climbing.
Congratulations to the federal employees and retirees who have reached the $1 million mark in their TSP accounts!