

Press Release – Earth Sciences New Zealand
There is now a 90% likelihood for El Nio to reach or exceed very strong intensity during the outlook period, with peak conditions and potential significant impacts most likely during the 2026-27 summer.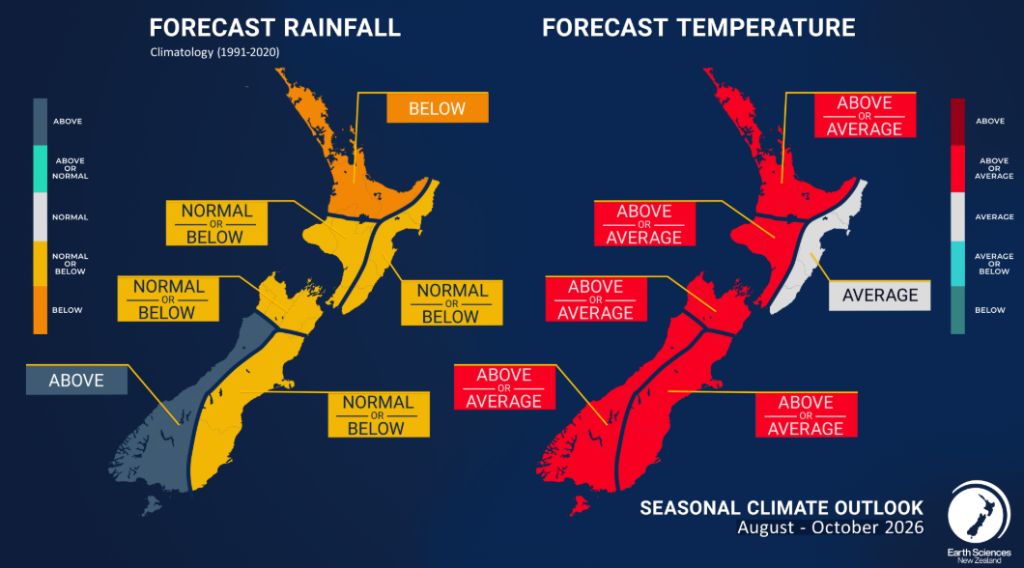
Photo/Supplied
Photo/Supplied
Photo/Supplied
Highlights:
-El Niño conditions persist in the tropical Pacific atmosphere and ocean and have strengthened further, with the strongest atmospheric measurements on record for July. The event remains in its early stages, but impacts on New Zealand’s weather are anticipated during this outlook period.
-There is now a 90% likelihood for El Niño to reach or exceed very strong intensity during the outlook period, with peak conditions and potential significant impacts most likely during the 2026-27 summer. It is likely to develop into one of the strongest in recent history.
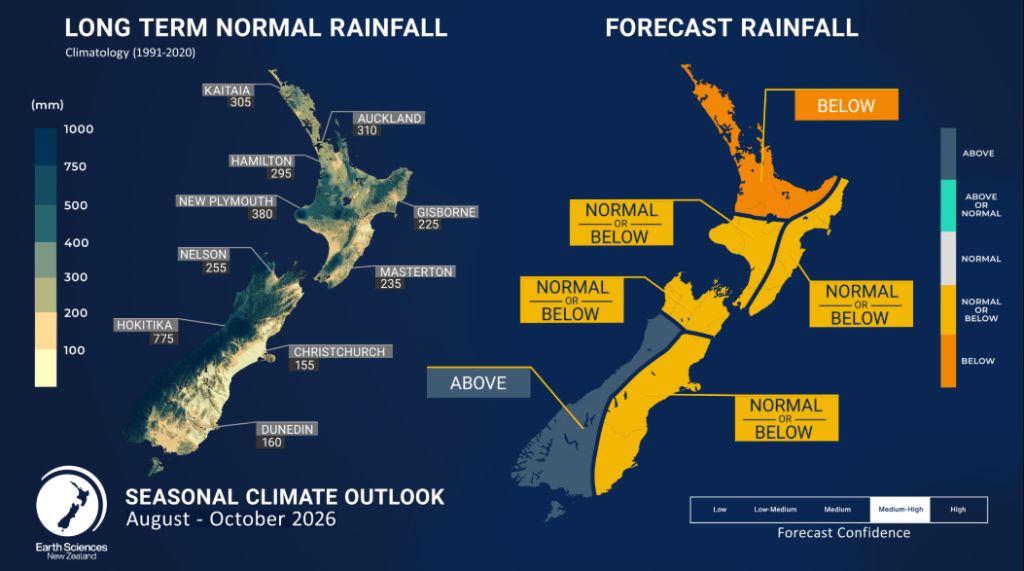
-Rainfall is likely to be near normal or below normal for the north and east of the South Island, and the east of the North Island, and most likely below normal for the remainder of the North Island. The west of the South Island is most likely to see above normal rainfall, with the main heavy rain threat shifting toward the western and the lower South Island from the north.
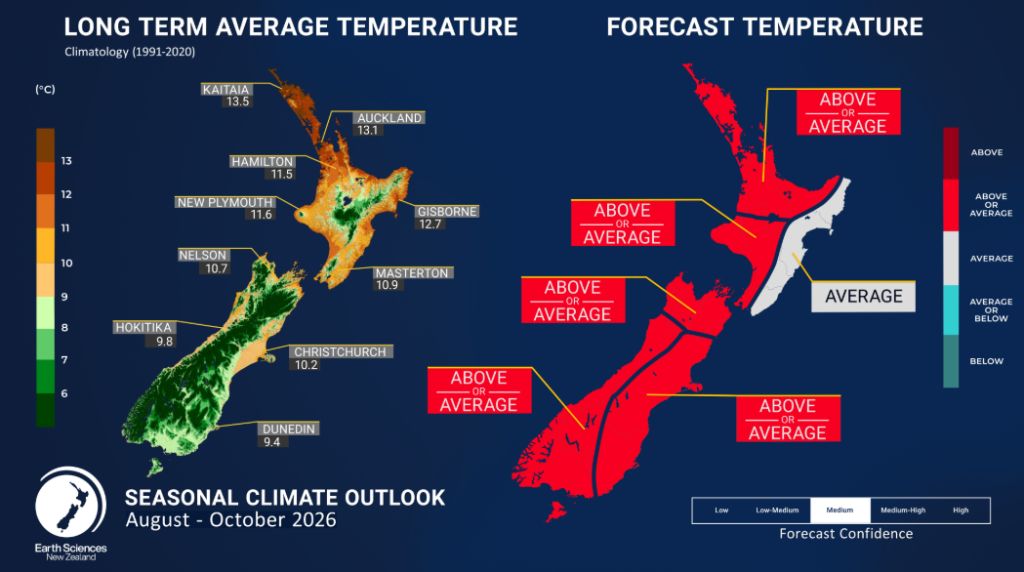
-Air temperatures are most likely near average for the east of the North Island, and equally likely near or above average elsewhere, with occasional cold snaps still expected.
-El Niño-related influences on regional weather patterns are expected to become more apparent later during spring. This is expected to favour periods of active westerlies, bringing an increased risk of unusually windy conditions and notable temperature variability.
-The likelihood of below normal rainfall in several regions is likely to reduce groundwater recharge, creating challenges for water-reliant sectors.
-Soil moisture levels and river flows are expected to be near normal or below normal for the east and north of both islands, the west of the North Island, and the north of the South Island. In the west of the South Island, they are expected to be near normal or above normal.
Regional predictions for August – October 2026
The tables below show the probabilities (or percent chances) for each of three categories: above average, near average, and below average. In the absence of any forecast guidance there would be an equal likelihood (33% chance) of the outcome for any of the three categories. Forecast
information from local and global guidance models is used to indicate the deviation from equal chance that is expected for the coming three-month period. All outlooks are for the three months averaged as a whole. During these three months, there will inevitably be relatively wet and dry periods, as well as hot and cold periods. The exact range in temperature and rainfall within each of the three categories varies with location and season. However, as a guide, the “near average” or middle category for the temperature predictions includes deviations up to ±0.5°C relative to the long-term mean, whereas for rainfall the “near normal” category lies between 80 percent and 120 percent of the long-term (1991-2020) mean.
Northland, Auckland, Waikato, Bay of Plenty
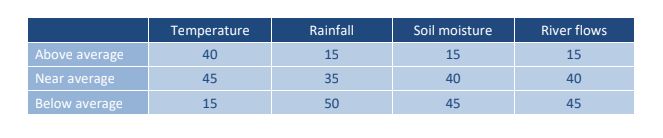
Probabilities are assigned in three categories: above average, near average, and below average.
• Temperatures are about equally likely to be above average (40% chance) or near average (45% chance).
• Rainfall totals are most likely to be below normal (50% chance).
• Soil moisture levels and river flows are about equally likely to be near normal (40% chance) or below normal (45% chance).
Temperature Rainfall Soil moisture River flows
Central North Island, Taranaki, Whanganui, Manawatu, Wellington
Probabilities are assigned in three categories: above average, near average, and below average.
• Temperatures are about equally likely to be near average (40% chance) or above average (45% chance).
• Rainfall totals are about equally likely to be below normal (40% chance) or near normal (35% chance).
• Soil moisture levels are equally likely to be near normal (45% chance) or below normal (45% chance).
• River flows are about equally likely to be near normal (45% chance) or below normal (40 – 45% chance).

Gisborne, Hawke’s Bay, Wairarapa
Probabilities are assigned in three categories: above average, near average, and below average.
• Temperatures are most likely to be near average (45% chance).
• Rainfall totals are about equally likely to be below normal (45% chance) or near normal (40% chance) for the outlook period as a whole.
• Soil moisture levels and river flows are about equally likely to be near normal (45% chance) or below normal (40% chance).
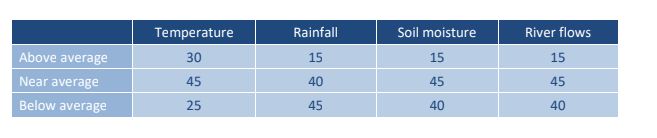
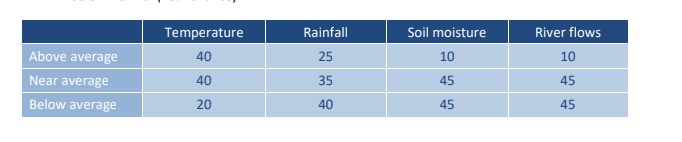
Tasman, Nelson, Marlborough, Buller
Probabilities are assigned in three categories: above average, near average, and below average.
• Temperatures are equally likely to be near average (40% chance) or above average (40% chance). The likelihood of increased temperature variability, including larger swings between warm and cool conditions, as well as periods of unusually windy weather, is expected to increase during spring.
• Rainfall totals are about equally likely to be below normal (40% chance) or near normal (35% chance).
• Soil moisture levels and river flows are equally likely to be near normal (45% chance) or below normal (45% chance).
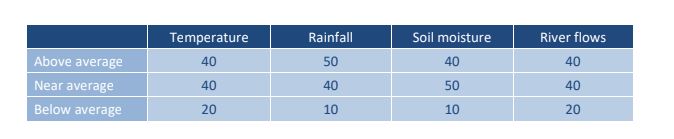
West Coast, Southern Alps and foothills, inland Otago, Southland
Probabilities are assigned in three categories: above average, near average, and below average.
• Temperatures are equally likely to be near average (40% chance) or above average (40% chance).
• Rainfall totals are most likely to be above normal (50% chance). The risk of active weather events, including heavy rainfall and strong winds, is forecast to increase during spring. • Soil moisture levels are most likely to be near normal (50% chance).
• River flows are equally likely to be near normal (40% chance) or above normal (40% chance).
Coastal Canterbury and the nearby plains, east Otago
Probabilities are assigned in three categories: above average, near average, and below average.
• Temperatures are about equally likely to be above average (45% chance) or near average (40% chance). The likelihood of increased temperature variability, including larger swings between warm and cool conditions, as well as periods of unusually windy weather, is expected to increase during spring.
• Rainfall totals are about equally likely to be below normal (40% chance) or near normal (35% chance).
• Soil moisture levels and river flows are about equally likely to be near normal (45% chance) or below normal (40% chance).
The full probability breakdown is:

In summary, oceanic conditions are in an El Niño configuration, and setting the stage for further development during the outlook period, with particularly significant warmth (positive heat content anomalies) stored in the ocean along the Equator in the Pacific. These signals are only growing ever stronger with time. Meanwhile, the atmosphere is also increasingly resembling El Niño. A fully coupled El Niño has therefore emerged, although stronger ocean and atmospheric responses are anticipated as the event develops further.
The Relative Oceanic Niño Index forecastsindicate a 100% chance for El Niño conditions over the next three-month period (August – October 2026). The IRI/CPC forecasts also support this outlook. Further strengthening of the event is likely beyond the outlook period, and it is increasingly probable that the event will peak as one of the strongest on record.
The Southern Annular Mode (SAM) decreased from near record high values late in June, and showed a mixture of negative and positive modes throughout July. During August, the negative SAM mode is expected to be more common than it has been over the last two months, though occasional positive spells may still occur.
The Indian Ocean Dipole (IOD) value for July is neutral (+0.2°C). Forecasts from the Australian Bureau of Meteorology indicate that the IOD is likely to become positive over the next three month period, and is forecast to reach thresholds (+0.4°C) required to declare a positive IOD event during the spring season.
In the first week of July, the Madden Julian Oscillation (MJO) moved into the western Pacific, likely contributing to the low-pressure systems experienced in New Zealand. It then moved slowly eastwards, acting in concert with the El Niño. After making minimal impact in the Indian Ocean, it should emerge into the western Pacific again early in August, likely having some influence again on New Zealand weather patterns.
With the MJO in the western Pacific, it can also contribute to both oceanic and atmospheric components of El Niño strengthening further.
Local Sea Surface Temperatures (SSTs) are near average or above average around the majority of the country, and marine heatwave (MHW) conditions are continuing around much of the South Island and Tasman Sea. Forecasts from coupled ocean-atmosphere models for the next three-month period (see Sea Surface Temperature Update | Earth Sciences New Zealand | NIWA) indicate SSTs should continue to warm around the coastal waters of the country, especially around the South Island.
Content Sourced from scoop.co.nz
Original url