Phenotypic analysis of plant height (PH) in the multi-parent population
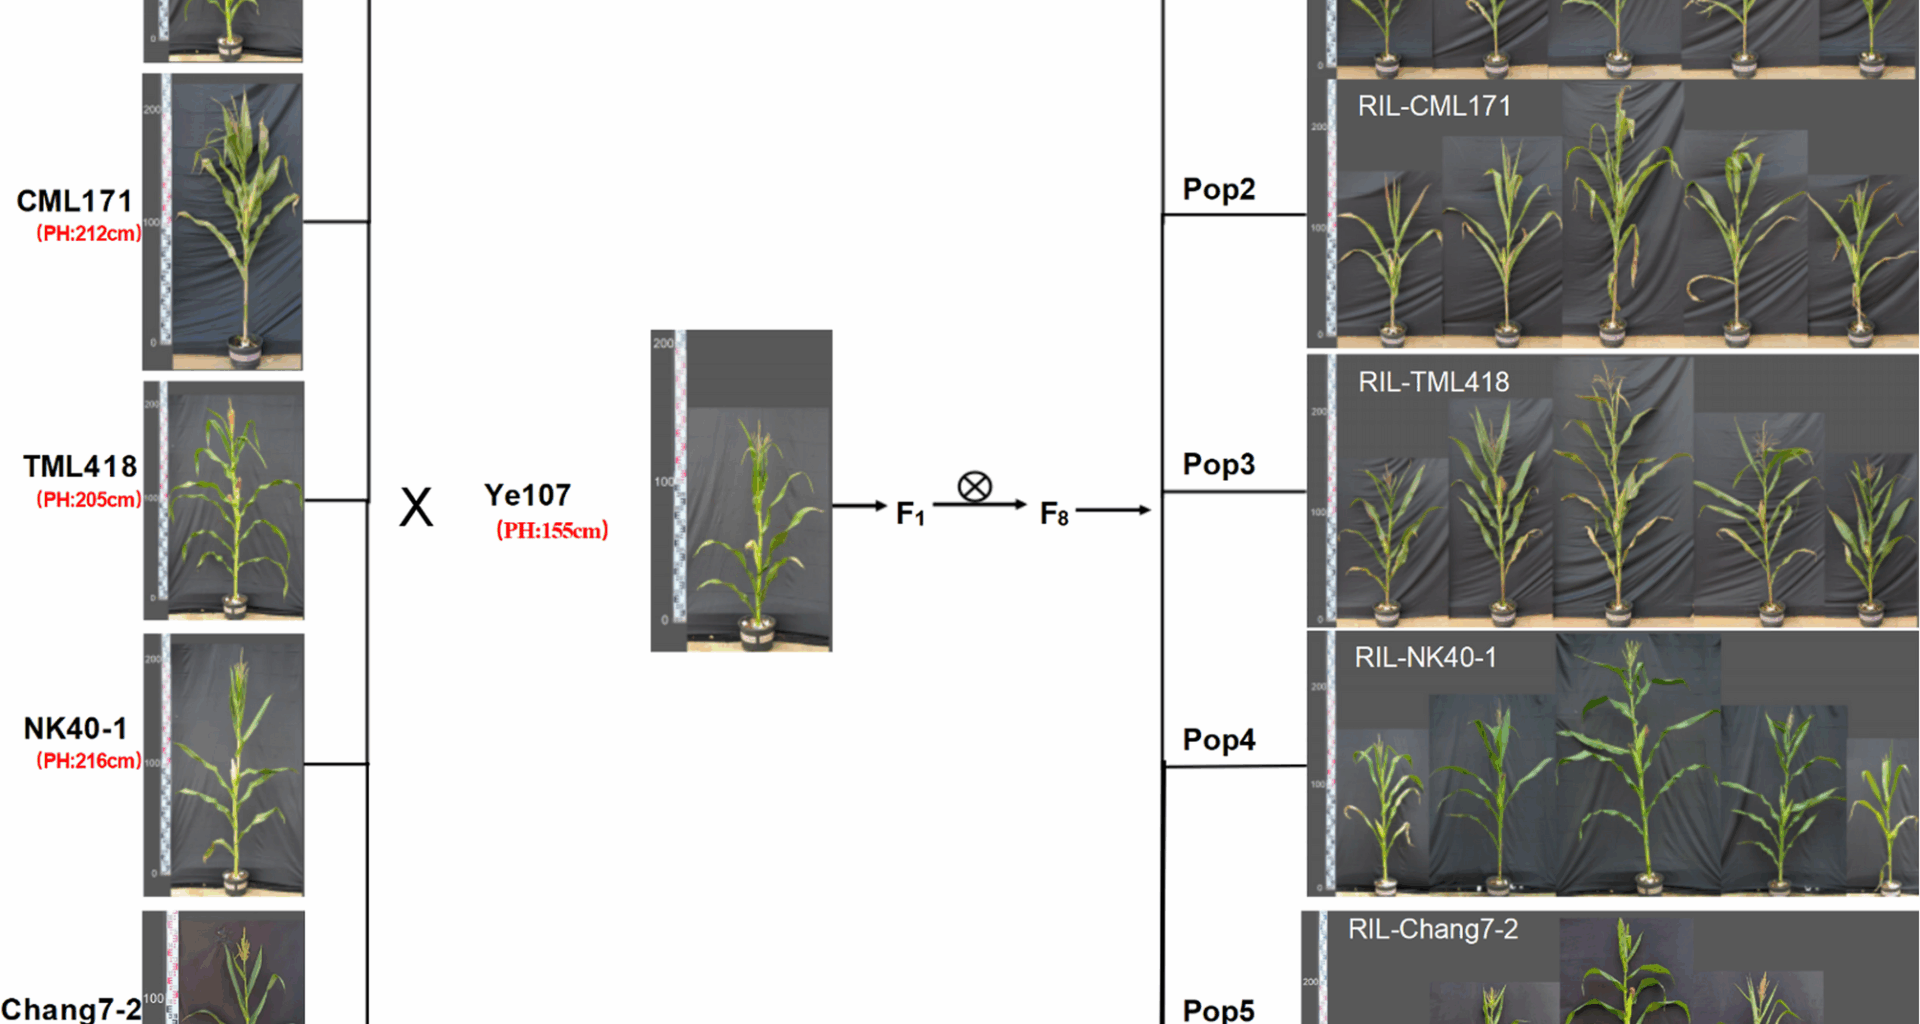
Phenotypic evaluation of plant height among the parental Lines of the five RIL subpopulations revealed significant variation, with female parents ranging from 156.0 to 216.0 cm, compared to 155.0 cm for the common male parent (Ye107) (Fig. 1). The RILs also exhibited extensive phenotypic variation, as shown in Fig. 1. Notably, tropical and subtropical female parental lines generally exhibit increased plant height, particularly in temperate regions, likely due to strong photoperiodic responses. The substantial height difference between the taller tropical/subtropical parents and the dwarf common male parent Ye107 makes this RIL population an ideal resource for dissecting the genetic basis of maize plant height variation. Descriptive statistics for the five RIL subpopulations are summarized in Table 2. Pop4 displayed the highest mean plant height (190.0 cm), with a range of 116.0–253.0 cm, and CV values of 13.6%, 13.2%, and 13.1% across the three environments. In contrast, Pop5 showed the lowest mean plant height (164.4 cm) but the widest range (82.0–258.0 cm), with higher CV values (18.9%−19.2%), indicating greater phenotypic variation. The frequency distribution analysis confirmed that plant height followed a normal distribution in all populations, with absolute skewness and kurtosis values Less than 1 (Table 2; Fig. 2). The broad-sense heritability (H2) was consistently high across populations (Pop1-Pop5: 97.9%, 96.9%, 98.3%, 97.5% and 96.2%, respectively). Pearson correlation analysis (p < 0.05) showed highly significant positive correlations for plant height among RILs within each population across three environments. Pearson correlation analysis (p < 0.05) showed highly significant positive correlations for plant height across environments within each RIL population, with coefficients ranging from 0.945 to 0.952 for pop1, 0.945 to 0.956 for pop2, 0.952 to 0.954 for pop3, 0.950 to 0.955 for pop4, and 0.957 to 0.967 for pop5 (Fig. 2). Together, these results indicated that maize plant height was predominantly regulated by genetic factors, showed high stability across environments, and was less influenced by environmental variation.
Table 2 Descriptive statistics of plant height in the multi-parent populationFig. 2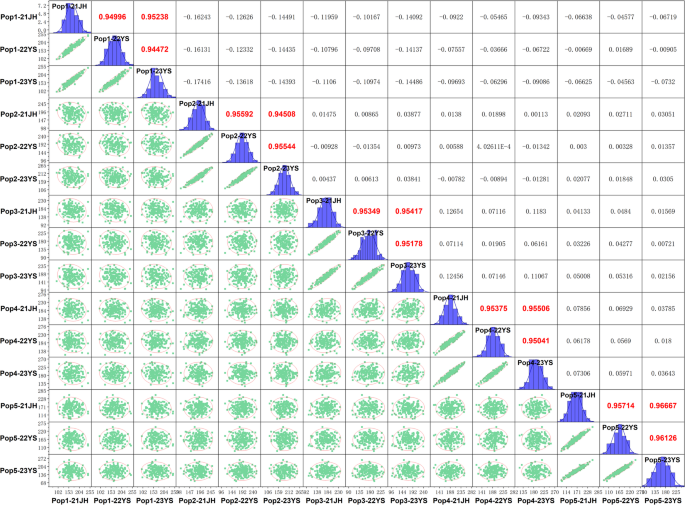
Phenotypic distribution of plant height and correlation coefficients among five subpopulations across three environments
SNP identification and distribution
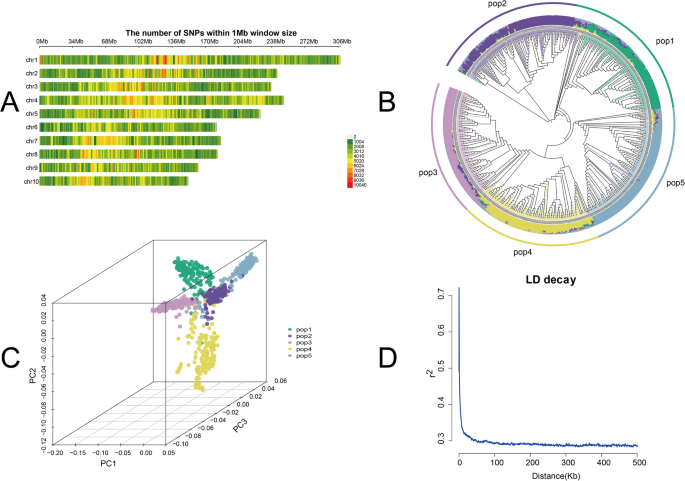
A total of 6,389,682 high-quality SNPs were obtained through WGS and distributed across the 10 chromosomes of Maize. The SNP density varied significantly, with chromosome 1 containing the highest number (891,814), and chromosome 10 the lowest (462,924). The SNP counts for chromosomes 1–10 were as follows: 891,814; 699,810; 717,023; 880,707; 669,104; 485,237; 564,060; 545,295; 473,708; and 462,924, respectively (Fig. 3A).
Phylogenetic tree and PCA
Phylogenetic analysis based on Maximum parsimony revealed clear differentiation among the 917 RILs, clustering them into five subpopulations consistent with their respective parental lineages (Fig. 3B). PCA supported these findings, with the first two principal components effectively separating the RILs into five groups (Fig. 3C), demonstrating strong concordance with the phylogenetic analysis.
LD decay analysis
LD decay analysis showed that the LD decay curve plateaued at r2 = 0.3, corresponding to a decay distance of 20 kb (Fig. 3D). Based on this threshold, candidate genes were screened within 20 Kb upstream and downstream of significant SNPs.
Genomic characterization of maize RIL population. A Chromosomal distribution of SNPs (density per 1 Mb), with SNP density shown on green-red scale. B Phylogenetic tree illustrating genetic relationships among the 917 RILs. C Three-dimensional PCA plot illustrating genetic differentiation among the five subpopulations. D Genome-wide LD decay (r2) across all chromosomes, plotted against physical distance (Kb)
Genome-wide association analysis of plant height in multi-parent population
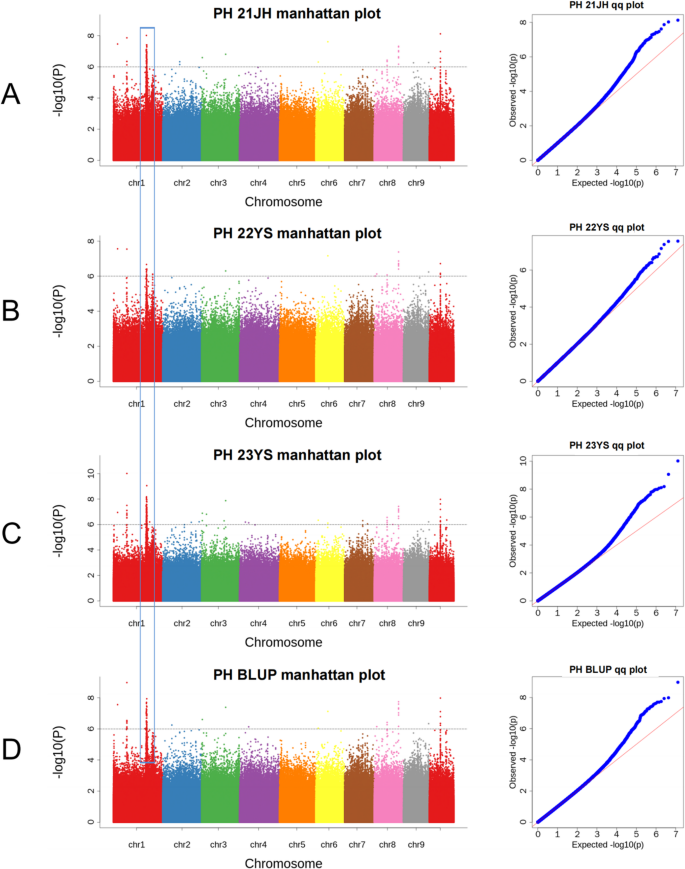
Based on phenotypic data from 917 F8 RILs and 1,125,024 high-quality SNPs, GWAS was performed in the MPP using a MLM across three environments and BLUP values. A total of 147 SNPs were identified significantly associated with plant height at a threshold of − log10(p) > 6 (Fig. 4, Table S1), distributed across chromosomes 1, 2, 3, 4, 6, 7, 8, 9, and 10. Of these, 35 SNPs were identified in the 21JH environment, explaining 0.87%−5.73% of phenotypic variation (Fig. 4A). Similarly, in 22YS environment, 21 SNPs were identified with the PVE ranging from 1.15% to 5.05% (Fig. 4B). In 23YS environment, 53 SNPs were identified, explaining 0.44%−5.98% of phenotypic variation (Fig. 4C). Analysis of BLUP values identified 38 SNPs, explaining 0.63%−6.20% of phenotypic variation (Fig. 4D). Among the 147 significant SNPs, 12 were consistently detected across the three environments and the BLUP analysis, highlighting their stability (Table S2). Notably, three significant SNPs (1–25,296,496; 1-206,557,793; and 1-206,628,704) on chromosome 1 provided important clues for the identification of candidate genes regulating maize plant height (Table 3). In the Q-Q plot, observed p-values (blue dots) closely followed expected values (red dashed line), particularly in the higher p-value range (non-significant SNPs), indicating a good fit. This indicated that the MLM effectively corrected for population structure and kinship, thereby reducing false positives and enhancing the reliability of the GWAS results, while strong deviations at the tail indicated true associations with plant height (Fig. 4).
Manhattan plots (left) and QQ plots (right). A 21JH environment, (B) 22YS environment, (C) 23YS environment, (D) BLUP values. In the Manhattan plots, the dotted Line indicates the significance threshold, the x-axis shows chromosomes 1–10, and each dot represents a SNP. In the Q-Q plots, the red line indicates the expected values, and blue dots show observed values
Table 3 SNPs consistently identified by GWAS across environmentsCandidate genes identified through GWAS analysis
Based on the estimated LD decay distance, candidate genes regulating Maize plant height were screened within 20 kb region upstream and downstream of significant SNPs. Functional annotation was performed using the Maize GDB, InterPro, UniProt and NCBI databases. A total of 86 candidate genes were identified, of which, 55 were functionally annotated (Table S3). The remaining 31 genes are uncharacterized and lacked functional annotations. Integrating cross-environment consistency and functional annotation, four candidate genes on chromosome 1 (Zm00001eb008340, Zm00001eb038680, Zm00001eb038690, and Zm00001eb038700) were identified. These genes encode ubiquitin-carboxyl-terminal hydrolase 26, putative kinase-like protein TMKL1, Exocyst complex component EXO84C, and zinc finger protein Bud20, respectively (Table 4). These genes have been implicated in plant growth and metabolism, potentially contributing to maize plant height regulation through direct or indirect mechanisms.
Table 4 Potential candidate genes identified within 20 Kb region upstream and downstream of significant SNPs and their functionsLinkage map construction and QTL mapping
High-density linkage maps were constructed for the five subpopulations. In Pop1, 1,557 polymorphic SNPs were used to construct a high-density genetic Map spanning a 1071.97 cM, with an average inter-marker distance of 0.69 cM. Pop2 included 717 polymorphic SNPs, generating a genetic Map of 422.44 cM with an average inter-marker distance of 0.59 cM. In Pop3, 1,007 polymorphic SNPs were Mapped, covering 721.56 cM with an average inter-marker distance of 0.72 cM. Pop4 comprised 1,046 polymorphic SNPs, resulting in a genetic Map of 684.2 cM with an average genetic distance of 0.65 cM. The genetic map for Pop5 was constructed using 3,486 polymorphic SNPs, spanning 2,981.64 cM with an average inter-marker distance of 0.86 cM (Table S4).
QTL Mapping for plant height was performed across different environments and BLUP values for all five subpopulations. A total of 22 QTLs were detected on chromosomes 1, 2, 3, 4, 5, 7, and 10 (Table S6, Figure S1). In Pop1, one QTL was identified in the 23YS environment, explaining 8.08% of the PVE, with a negative additive effect. In Pop2, two QTLs were detected in the 21JH and 22YS environments explaining 5.46% − 6.02% of the PVE, both with positive additive effects. In Pop3, three QTLs on chromosome 3 explained 6.19–7.66% of the PVE in the 22YS and 23YS environments and BLUP values. In Pop4, four QTLs were identified across environments and BLUP values, with PVE ranging from 6.01 to 6.35%. In Pop5, 12 QTLs associated with plant height were identified across all environments and BLUP values, explaining 4.98–15.29% of the PVE (Table S6, Figure S1).
Identification of candidate genes by integrating GWAS and QTL mapping
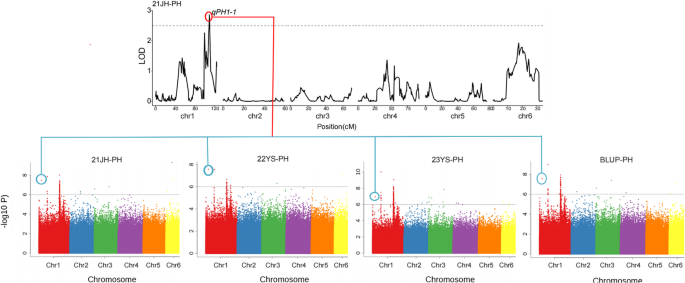
Co-localization analysis revealed that a significant proportion of SNPs identified by GWAS overlapped with QTL intervals detected through Linkage analysis. Specifically, SNP 1–25,296,496, consistently detected in 21JH, 22YS, 23YS environments and BLUP values, co-localized with the QTL interval qPH1-1 (25,252,584 − 37,200,698 bp) identified in Pop4 in the 21JH environment (Fig. 5). This overlap between SNPs identified by GWAS and a stable QTL region significantly strengthens confidence in this locus as a key determinant of plant height. The candidate genes were screened within 20 kb upstream and downstream of this co-localized SNP, identifying two candidate genes (Zm00001eb008330 and Zm00001eb008340) that may regulate plant height in maize (Table 5). Functional annotation indicated that Zm00001eb008340 encodes a ubiquitin-carboxy-terminal hydrolase 26, while Zm00001eb008330 remains uncharacterized (Table 5). Thus, this integrative GWAS and QTL mapping approach successfully identified Zm00001eb008340 as a high-confidence candidate gene regulating plant height in maize, providing a promising target for future functional validation.
SNPs significantly associated with Maize plant height were identified by GWAS and co-localized with QTL intervals from QTL Mapping. The top Panel displays the LOD score plot from QTL Mapping in the 21JH environment, with the red rectangle highlighting the qPH1-1 QTL interval. The bottom panels (A-D) present Manhattan plots for the 21JH, 22YS, 23YS environments, and BLUP values, respectively. The vertical blue circles indicate co-localized SNPs within the qPH1-1 interval across analyses. Dotted grey horizontal lines represent the significance thresholds: LOD ≥ 2.5 for QTL and -log10(P) > 6.0 for GWAS
Table 5 Candidate genes identified through combined GWAS and QTL mappingHaplotype analysis
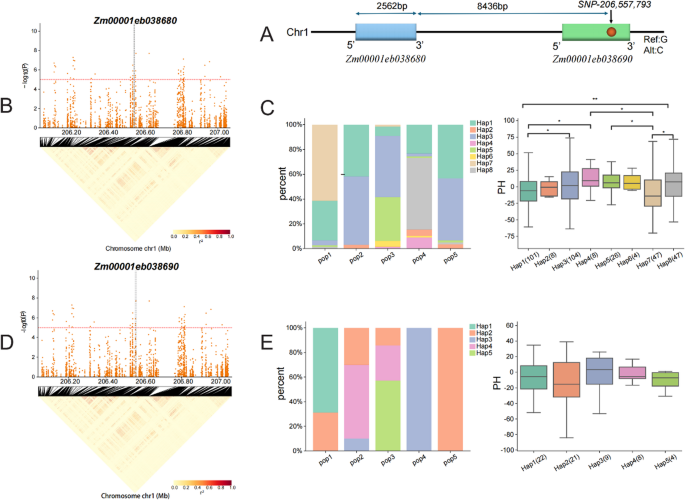
Haplotype analysis was performed for candidate genes Zm00001eb038680 and Zm00001eb038690, located in proximity to SNP1-206,557,793. The physical locations of the SNP and associated candidate gene are shown in Fig. 6. Zm00001eb038680, spanning 2,562 bp, was located 8,436 bp upstream of SNP1-206,557,793 (G/C), while this SNP was located within Zm00001eb038690 (Fig. 6A).
Haplotype analysis of Zm00001eb038680 revealed eight haplotypes (Hap1-Hap8) across the five subpopulations (Fig. 6C, Table S7). The haplotype frequencies varied across subpopulations. Hap8 was associated with the tallest plant, showing significant differences from Hap1 and Hap7 (p < 0.05). Notably, Pop4 had the highest frequency of Hap8, which also corresponded to the highest plant height among subpopulations. These results suggested Hap8 as a superior haplotype that positively regulate maize plant height and served as a valuable marker for breeding taller varieties (Fig. 6C).
Similarly, for Zm00001eb038690, five haplotypes (Hap1-Hap5) were identified (Fig. 6E, Table S7). Haplotype frequencies varied across subpopulations. Hap3 was associated with significantly greater plant height than other haplotypes (p < 0.05), whereas Hap2 was associated with the lowest plant height. Hap3 was observed with the highest frequency in Pop4, while Hap2 was predominant in Pop5 (Fig. 6E). These findings suggested that Hap3 may act as a superior haplotype, positively regulating maize plant height, whereas Hap2 may negatively regulate plant height, providing a potential target for developing dwarf varieties.
Haplotype analysis of candidate genes Zm00001eb038680 and Zm00001eb038690. A Relative positions of candidate genes Zm00001eb038680, Zm00001eb038690 and SNP1-206,557,793. B LD blocks of candidate genes Zm00001eb038680. C Distribution of eight haplotypes of Zm00001eb038680 across five RIL subpopulations and their effects on maize plant height (p < 0.05, **p < 0.01). D LD blocks of Zm00001eb038680 and Zm00001eb038690. E Distribution of five haplotypes of Zm00001eb038690 across five RIL subpopulations, and their effects on maize plant height
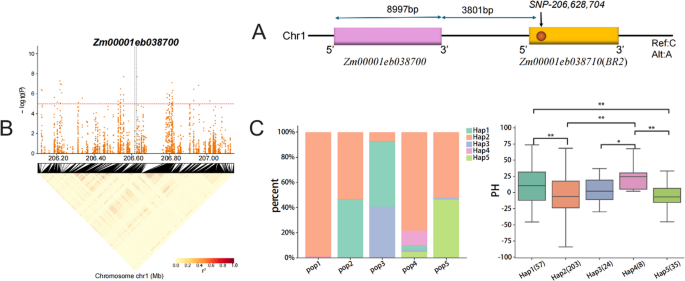
Furthermore, two candidate genes, Zm00001eb038700 and Zm00001eb038710, were located in proximity to SNP1-206,628,704. This SNP (C/A) was located within Zm00001eb038710, while Zm00001eb038700, spanning 8,997 bp, was located 3801 bp upstream (Fig. 7A). Haplotype analysis of Zm00001eb038700 revealed five haplotypes (Hap1-Hap5) across the five subpopulations (Table S7). Among them, Hap4 was associated with the tallest plants, significantly higher than Hap2 and Hap5 (p < 0.01). Pop4 exhibited the highest frequency of Hap4, whereas Hap2 was more frequent in Pop1 (Fig. 7C; Table 2). These findings suggested that Hap4 represents a superior haplotype contributing increased maize plant height, while Hap2 may act as a negative regulator, offering potential targets for height manipulation.
Haplotype analysis of Zm00001eb038700. A Relative positions of Zm00001eb038700, Zm00001eb038710 and SNP1-206,628,704. B LD block of Zm00001eb038700. C Distribution of five haplotypes of Zm00001eb038700 across five RIL subpopulations, and their effects on maize plant height (p < 0.05, ** p < 0.01)
Relative expression of candidate genes in the parental lines
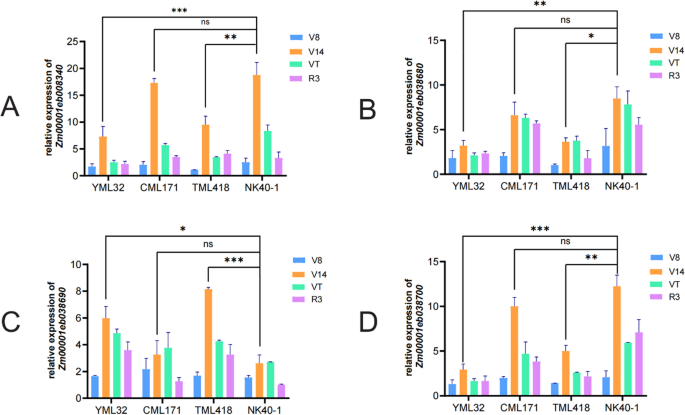
To further investigate the regulatory role of candidate genes (Zm00001eb008340, Zm00001eb038680, Zm00001eb038690 and Zm00001eb038700) in maize plant height, their expression patterns were analyzed in five parental lines (Ye107, YML32, CML171, TML418, and NK40-1) at four developmental stages (V8-V14) critical for internode elongation and plant height determination. Internode measurements revealed that NK40-1 had the longest internode, while Ye107 had the shortest (Figure S2). Using Ye107 (the dwarf parent) as a reference, Zm00001eb008340, Zm00001eb038680 and Zm00001eb038700 showed the highest relative expression in the tall parent NK40-1 at the V14 stage, correlating with its longest internode length, while remaining low in Ye107 (Fig. 8A, B, D). This positive correlation between gene expression and internode length strongly supports their potential role in promoting maize growth. In contrast, Zm00001eb038690 displayed significantly higher relative expression in YML32 and TML418 compared with NK40-1 (Fig. 8C). Both YML32 and TML418 exhibited relatively low plant height, suggesting that Zm00001eb038690 may enhance IAA transport from shoot to root, promoting root growth and development while inhibiting internode elongation. Collectively, these distinct expression patterns across contrasting parental lines provide strong experimental evidence that these four candidate genes play diverse roles in regulating maize plant height, likely through influencing internode elongation and hormone transport.
Relative expression of four candidate genes across developmental stages. A-D The relative expression of Zm00001eb008340, Zm00001eb038680, Zm00001eb038690 and Zm00001eb038700 in four parental lines at different stages, respectively. *P < 0.05, ** P < 0.005, ***P < 0.001, ns, not significant

