
Effect of sample area on the inferred effective 226Ra activity concentration and exhalation rate of radon-222
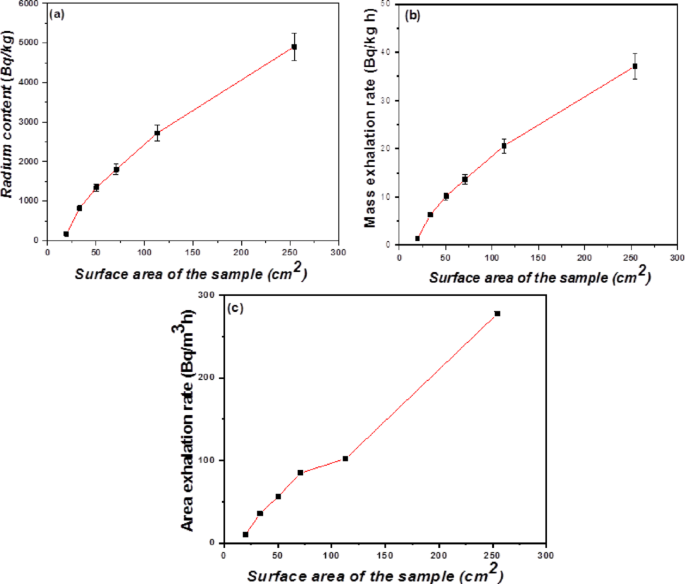
To investigate how the exposed surface area of a sample influences both the measured inferred effective 226Ra activity concentration and the subsequent radon exhalation, we are analyzed three different material types phosphate, granite, and sand each prepared with a controlled grain size. For phosphate and granite, the grain size is kept below 80 µm, while the sand fraction was coarser (200–425 µm). The sample surface area is varied systematically from about 20 to 254 cm2. The results are summarized in Tables 1, 2 and 3, and the trends are visualized in Figs. 1, 2 and 3.
Table 1 Effect of sample area on Inferred effective 226Ra activity concentration and radon exhalation rates in phosphate sample (Grain size < 80 μm).Table 2 Effect of sample area on Inferred effective 226Ra activity concentration and radon exhalation rates in granite sample (Grain size < 80 μm).Table 3 Effect of sample area on Inferred effective 226Ra activity concentration and radon exhalation rates in sand sample (200 μm < Grain size < 425 μm).Fig. 1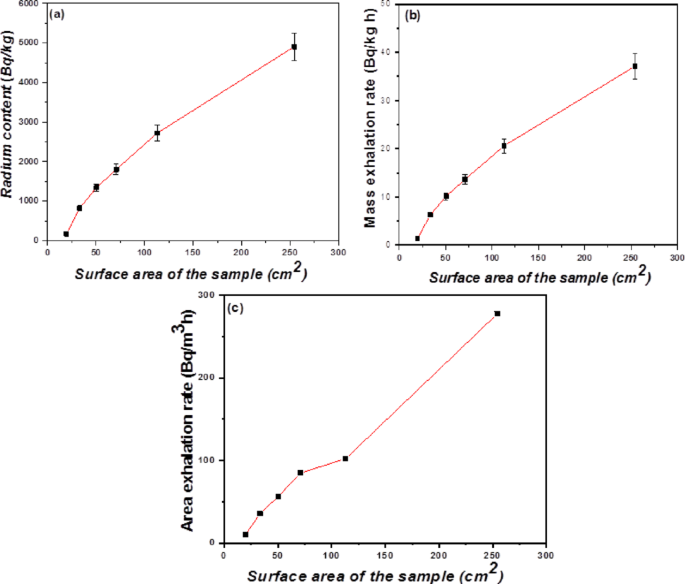
(a) Inferred effective 226Ra activity concentration, (b) Mass exhalation rate, and (c) Area exhalation rate versus surface area of phosphate sample.
Fig. 2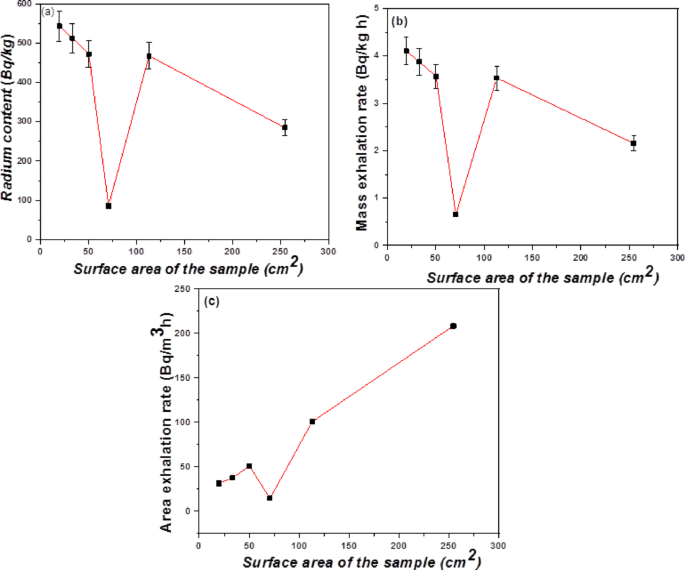
(a) Inferred effective 226Ra activity concentration, (b) Mass exhalation rate, and (c) Area exhalation rate versus surface area of granite sample (< 80 µm).
Fig. 3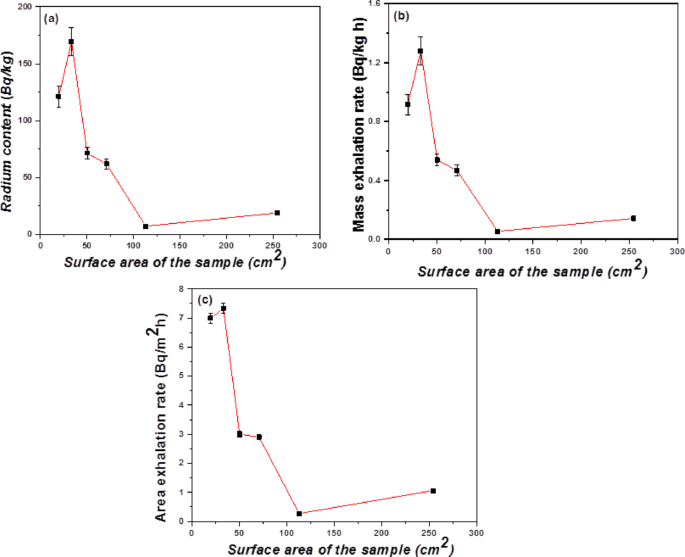
(a) Inferred effective 226Ra activity concentration, (b) Mass exhalation rate, and (c) Area exhalation rate versus surface area of sand sample (425–200 µm).
As the exposed surface area increased, the phosphate samples exhibited a systematic and nearly linear increase in the 226Ra activity concentration, mass radon exhalation rate, and surface radon exhalation rate, as summarized in Table 1 and illustrated in Fig. 1a–c. Specifically, the inferred 226Ra activity increases markedly from 170.49 ± 13 Bq kg−1 at the minimum surface area (19.63 cm2) to 4910.53 ± 347 Bq kg−1 at the maximum surface area (254.34 cm2), representing an approximate 30-fold enhancement. This increase is accompanied by proportional rises in the mass exhalation rate from 1.29 ± 0.10 to 37.12 ± 3 Bq kg−1 h−1 and in the area exhalation rate from 9.85 ± 0.23 to 277.33 ± 3 Bq m−2 h−1, indicating a strong coupling between geometric surface exposure and radon release efficiency. As illustrated in Fig. 1a, the relationship between surface area and inferred effective 226Ra activity concentration follows a well-defined quasi-linear trend, which must be interpreted in the context of indirect determination. Since the radium activity is calculated from the measured radon exhalation rather than directly quantified; consequently, the observed increase does not imply a real change in radionuclide concentration, but rather reflects an enhancement in emanation efficiency. This interpretation is further supported by Fig. 1b, c where both mass-normalized and area-normalized exhalation rates exhibit consistent scaling behavior with increasing surface area, confirming that a larger fraction of radon generated within the material effectively escapes to the external environment. The pronounced sensitivity of phosphate to surface area can be attributed to its intrinsic physicochemical characteristics, including high porosity that facilitates radon diffusion, weak intergranular bonding that permits recoil-driven escape of radon atoms, the presence of abundant microfractures that enhance pore connectivity, and the fine particle size distribution that maximizes the specific surface area51,52. Under these conditions, a significant proportion of 222Rn atoms generated within the recoil distance (~ 20–70 nm) from grain boundaries or pore surfaces can successfully escape the solid matrix, leading to a near-proportional relationship between exposed surface area and the measured radiological parameters, and ultimately confirming that radon exhalation in phosphate is governed by a surface area controlled emanation mechanism.
Granite samples exhibit a fundamentally different behavior compared to phosphate, characterized by a weak and non-systematic dependence of radon-related parameters on surface area, as evidenced by the data in Table 2 and their graphical representation in Fig. 2a–c. The inferred 22⁶Ra activity varies within a relatively broad range (85.87–543.52 Bq kg−1), while both mass and area exhalation rates display irregular fluctuations without any monotonic trend as surface area increases. This lack of correlation is clearly illustrated in Fig. 2a, where the data points are widely scattered, indicating that surface area does not act as the governing parameter for radon release in granite. A similar absence of systematic behavior is observed in Fig. 2b, c where both mass- and area-normalized exhalation rates vary independently of geometric changes. Notably, the sample corresponding to a surface area of 70.85 cm2 consistently exhibits anomalously low values across all measured parameters in Table 2, which is also reflected in the figures, suggests localized variations in mineral composition or a reduction in effective pore connectivity. The combined plot in Fig. 2a–c further confirms the absence of a coherent trend, emphasizing that radon exhalation in granite is predominantly controlled by intrinsic structural and mineralogical factors rather than external geometric conditions. This behavior can be attributed to several key mechanisms, including strong crystalline grain interlocking that limits pore interconnectivity, low effective porosity that restricts radon diffusion, heterogeneous spatial distribution of radionuclide-bearing accessory minerals such as zircon, apatite, and allanite, and the presence of sealed or poorly connected grain boundaries that inhibit recoil-assisted radon escape. Consequently, even with increasing exposed surface area, the fraction of radon atoms capable of reaching interconnected pathways and escaping the solid matrix remains largely unchanged; indicating that radon transport in granite is diffusion-limited and structurally controlled rather than surface-area-driven.
In contrast, sand samples (Table 2; Fig. 3a–c) display the lowest overall radon exhalation rates and a distinctly non-monotonic dependence on surface area, with maximum values observed at an intermediate surface area (33.17 cm2) and reduced values at both smaller and larger areas. This behavior is clearly captured in Fig. 3a–c where all measured parameters exhibit a characteristic peak followed by a decline, a trend that is further summarized in Fig. 4c. Unlike the linear response observed in phosphate, increasing surface area in sand does not consistently enhance radon release, reflecting the influence of competing physical constraints. The dominant controlling factor is recoil-limited escape, whereby radon atoms generated within coarse grains (200–425 µm) can only escape if produced within a very thin outer shell (~ 20–70 nm), resulting in a small effective emanation volume that is largely independent of the overall grain size. Additionally, increasing the geometric surface area does not proportionally increase the number of grains contributing active emission sites, leading to inefficient scaling between surface area and radon release. Mineralogical heterogeneity further complicates this behavior, as larger sampled areas may incorporate greater proportions of quartz-rich regions with low radionuclide content, thereby diluting the contribution from radium-rich heavy minerals such as zircon or monazite. Moreover, despite relatively high macroscopic porosity, the absence of internal microfractures within individual sand grains limits intergranular connectivity and restricts radon migration pathways. As a result, sand exhibits weak, non-systematic dependence on surface area, with overall exhalation efficiency remaining low and primarily controlled by grain size and compositional heterogeneity rather than geometric factors.
Fig. 4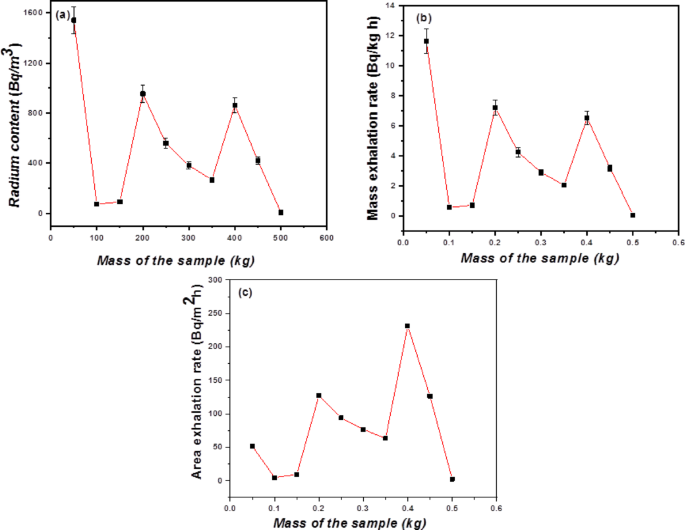
(a) Inferred effective 226Ra activity concentration, (b) Mass exhalation rate, and (c) Area exhalation rate versus mass of phosphate sample (< 80 µm).
Effect of sample mass on the inferred effective 226Ra activity concentration and exhalation rate of radon-222
To evaluate the dependence of 226Ra content and 222Rn exhalation rates on sample mass, three distinct geological materials phosphate, granite, and sand were measured under fixed grain size fractions (phosphate and granite: < 80 μm; sand: 200–425 μm). The results are presented in Tables 4, 5 and 6, with corresponding graphical relationships shown in Figs. 4, 5 and 6.
Table 4 Effect of sample mass on Inferred effective 226Ra activity concentration and radon exhalation rates in phosphate sample (Grain size < 80 μm).Table 5 Effect of sample mass on Inferred effective 226Ra activity concentration and radon exhalation rates in granite sample (Grain size < 80 μm).Table 6 Effect of sample mass on Inferred effective 226Ra activity concentration and radon exhalation rates in sand sample (200 μm < Grain size < 425 μm).Fig. 5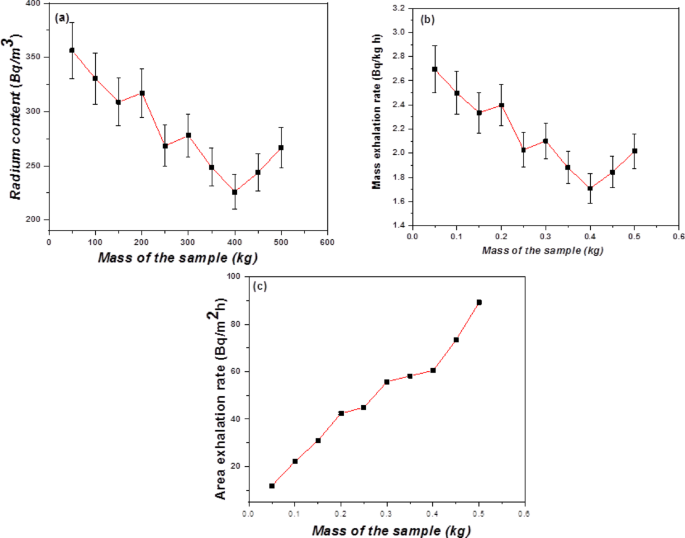
(a) Inferred effective 226Ra activity concentration, (b) Mass exhalation rate, and (c) Area exhalation rate versus mass of granite sample (< 80 µm).
Fig. 6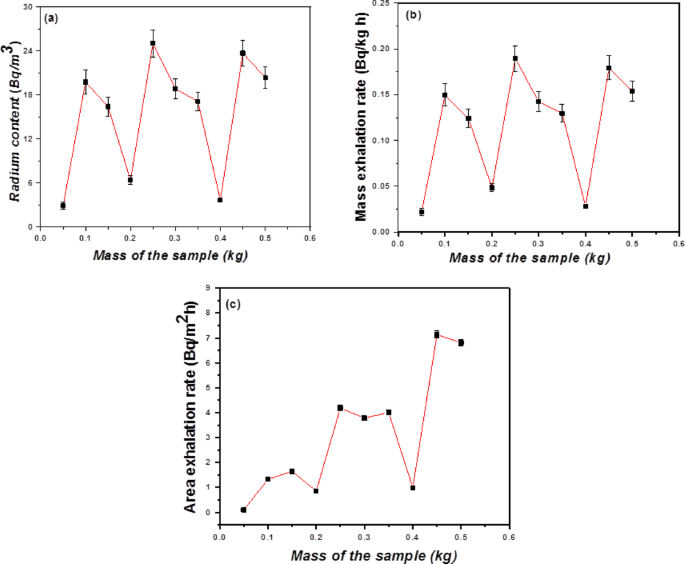
(a) Inferred effective 226Ra activity concentration, (b) Mass exhalation rate, and (c) Area exhalation rate versus mass of sand sample (425–200 µm).
For phosphate, Table 4 reveals an exceptionally wide range of inferred effective 226Ra activity concentration, from 7.19 ± 1 Bq/kg (500 g sample) to 1542.94 ± 110 Bq/kg (50 g sample), with an overall average of 517.12 ± 37 Bq/kg. This nearly 200-fold variation within the same material, despite identical grain size, strongly indicates a heterogeneous distribution of uranium-series radionuclides in the original phosphate source, which is a well-recognized characteristic of natural phosphate deposits51,52,53.
Figure 4a plots inferred effective 226Ra activity concentration versus sample mass. No monotonic trend appears; instead, values fluctuate dramatically: high at 50 g, low at 100 g, moderate at 150 g, again high at 200 g, and so on. These rules out any simple dilution or thickness effect. Similarly, Fig. 4b (mass exhalation rate) and Fig. 4a, c (area exhalation rate) show analogous erratic behavior. The maximum mass exhalation (11.66 ± 0.83 Bq kg−1 h−1) occurs at 50 g, while the minimum (0.05 ± 0.004 Bq kg−1 h−1) occurs at 500 g. Area exhalation rate at 231.49 ± 2.42 Bq m−2 h−1 for the 400 g sample, despite its inferred effective 226Ra activity concentration (865.32 ± 61 Bq/kg) being lower than the 50 g sample’s value. This paradox is physically instructive: area exhalation depends not only on radium concentration but also on the effective surface area of the sample bed and the escape probability of radon atoms. A larger mass spread over the same container base increases the emitting surface (hence higher area exhalation) but may simultaneously reduce mass-specific exhalation due to self-absorption and decay within thicker layers. From a radiological perspective, phosphate poses the greatest potential hazard when present in small, concentrated masses (e.g., dust or accumulated fines), as the 50 g sample produced an inferred effective 226Ra activity concentration exceeding 1500 Bq/kg well above typical exemption levels for building materials.
Granite shows a much narrower and more stable range. According to Table 5, inferred effective 226Ra activity concentration varies from 225.92 ± 16 Bq/kg (400 g) to 356.34 ± 26 Bq/kg (50 g), averaging 284.41 ± 20 Bq/kg. This relative homogeneity is expected for igneous rocks, where uranium is more evenly distributed within accessory minerals such as zircon, allanite, or apatite. Mass exhalation ranges from 1.71 ± 0.12 to 2.69 ± 0.19 Bq kg−1 h−1, and area exhalation from 11.92 ± 0.2 to 89.19 ± 0.99 Bq m−2 h−1. Figure 5a reveals a weak but consistent inverse relationship, with the inferred 226Ra content gradually decreasing as the sample mass increases from 50 to 400 g. Since the 226Ra activity is indirectly estimated from radon exhalation measurements using the AlphaGUARD system rather than determined by gamma spectrometry, this trend cannot be attributed to gamma self-attenuation44,45,47. Instead, it is more reasonably explained by natural mineralogical and compositional heterogeneity among the granite subsamples, which can influence radon emanation efficiency and consequently the inferred 226Ra activity.
The mass exhalation rate (see Fig. 5b) is nearly flat, decreasing only slightly from 2.69 to 1.71 Bq kg−1 h−1. This mild decline is consistent with the concept of finite diffusion length: as the sample becomes thicker, the fraction of radon that escapes per unit mass decreases, even though the absolute flux (area exhalation) increases. More importantly, Fig. 5c shows a clear positive correlation between sample mass and area exhalation rate. This is physically expected: for fixed container geometry, increasing the mass increases the thickness of the sample layer. Although radon atoms produced in the deeper portion are less likely to escape (due to decay and diffusion trapping), the total number of atoms produced per unit time still rises with mass, and the geometrical surface area of the sample (the top layer exposed to the can air volume) also increases until full coverage is achieved. Beyond a certain thickness, the area exhalation rate should plateau; here, the trend remains increasing up to 500 g, suggesting that the maximum thickness was not reached within the studied mass range.
Sand sample exhibits the lowest radiological signature by far. Table 6 lists inferred effective 226Ra activity concentration from 2.9 ± 0.31 to 25.06 ± 1.86 Bq/kg (average 15.44 ± 1.2 Bq/kg). Mass exhalation ranges from 0.02 ± 0.002 to 0.19 ± 0.01 Bq kg−1 h−1, and area exhalation from 0.1 ± 0.01 to 7.14 ± 0.14 Bq m−2 h−1. These values are one to two orders of magnitude lower than those of phosphate and granite. Figure 6a shows no clear mass dependence; inferred effective 226Ra activity concentration fluctuates between ~ 3 and 25 Bq/kg without trend. Figure 6b, c is similarly scattered. However, two observations are notable: the 250 g and 450 g samples give slightly higher exhalation rates (area exhalation 4.19 and 7.14 Bq m−2 h−1, respectively) than their neighbors. This may result from minor heterogeneities (e.g., heavy mineral grains containing zircon or monazite) or from differences in packing density that alter pore connectivity. The coarser grain size (200–425 μm) compared to phosphate and granite samples (< 80 μm) reduces the specific surface area and radon recoil escape probability, explaining the overall low exhalation.
Figure 7a clearly places sand at the bottom of the inferred effective 226Ra activity concentration scale, while Fig. 7b, c show that sand’s exhalation rates are negligible relative to phosphate and granite. From a building materials perspective, sand (as used in concrete or mortar) contributes minimally to indoor radon, unless it contains unusually high heavy mineral concentrations.
Fig. 7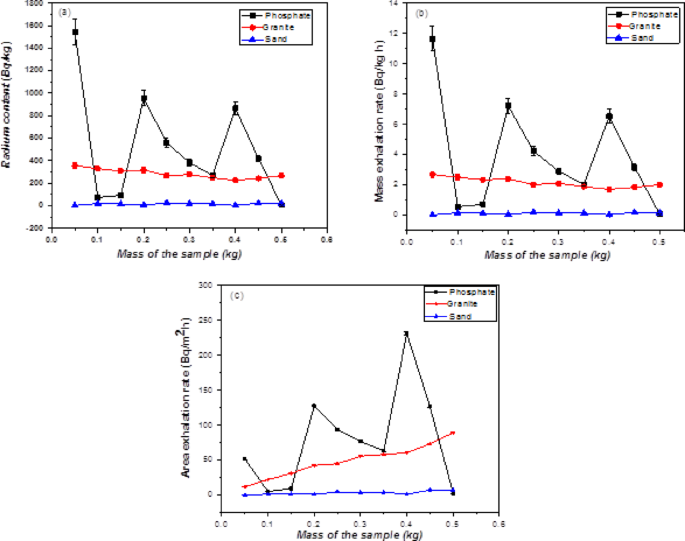
Relationship between (a) Inferred effective 226Ra activity concentration, (b) Mass exhalation rate, and (c) Area exhalation rate and sample mass of phosphate, granite and sand samples.
Figure 7a–c collectively demonstrates that for all three materials, there is no simple, universal relationship between total sample mass and either inferred effective 226Ra activity concentration or exhalation rates. This absence of correlation is not an artifact but a physically meaningful outcome, consistent with earlier work by Solecki et al.54 on coal ashes. In that study, the exhalation coefficient (measured radon in air divided by total radium) was found to follow an exponential decay with increasing sample thickness. The asymptotic value as thickness approaches zero (~ 13%) approximates the true emanation coefficient the fraction of radon atoms that escape from solid grains into the pore space. At finite thickness, radon atoms produced in deeper layers are lost due to radioactive decay (half-life 3.8 days) before they can diffuse to the surface. In the present work, sample mass was varied without systematically controlling or reporting the sample thickness or packing geometry. Therefore, any potential exponential relationship is obscured by: (i) Heterogeneous radium distribution (especially severe in phosphate), (ii) Variable porosity and grain packing affecting diffusion paths and (iii) Differences in grain size between materials (fine-grained phosphate/granite vs. coarser sand). Thus, mass alone is an unreliable predictor of radon exhalation. For quantitative comparisons or regulatory compliance, measurements should be normalized to surface area (Bq m−2 h−1) and accompanied by thickness and density data. Alternatively, mass exhalation rates are only meaningful when sample geometry is standardized. From a radiation protection standpoint, the area exhalation rate is the most relevant metric, as it directly quantifies the radon flux entering a room or workspace. Phosphate samples, despite their internal variability, produce area exhalation rates up to 231.5 Bq m−2 h−1 far exceeding granite samples (max 89.2 Bq m−2 h−1) and sand samples (max 7.1 Bq m−2 h−1). This finding has direct implications for industries processing phosphate rock (e.g., fertilizer production) or storing phosphate tailings: even small masses (400–500 g) can generate significant radon fluxes if spread over a large area. Conversely, the high value at 50 g mass exhalation (11.66 Bq kg−1 h−1) warns that fine, radium-rich dust fractions are particularly hazardous due to their high specific activity and potential for inhalation. Granite sample, while lower, still exceeds typical soil values and may contribute meaningfully to indoor radon when used as building stone or aggregate. Sand sample, under these grain size conditions, poses negligible risk.
Effect of sample temperature on inferred effective 226Ra activity concentration and 222Rn exhalation rate
To rigorously assess the influence of thermal conditions on radon release, the mass exhalation rate (Eₘ, Bq kg−1 h−1) and area exhalation rate (Eₐ, Bq m−2 h−1) are measured for phosphate, granite, and sand samples over the temperature interval 30–100 °C, with a fixed increment of 10 °C. The grain size is intentionally controlled (< 80 µm for phosphate and granite; 200–425 µm for sand) to decouple thermal effects from particle-size–dependent transport processes. The full datasets are reported in Tables 7, 8 and 9, while the corresponding temperature trends are illustrated in Figs. 8, 9, 10 and 11. Consistent non-monotonic (biphasic) temperature dependence is evident across all materials, characterized by an increase in Eₘ and Eₐ from 30 to ~ 60 °C, followed by a decline toward 100 °C. However, the amplitude, sharpness, and reproducibility of this response differ substantially between materials, indicating that temperature acts through material-specific transport mechanisms governed by porosity, mineralogy, and microstructural evolution rather than as an independent controlling parameter, in agreement with previous radon transport studies32,34,55,56.
Table 7 Effect of temperature on radon exhalation rates in phosphate sample (Grain size < 80 μm).Table 8 Effect of temperature on radon exhalation rates in granite sample (Grain size < 80 μm).Table 9 Effect of temperature on radon exhalation rates in sand sample (200 μm < Grain size < 425 μm).Fig. 8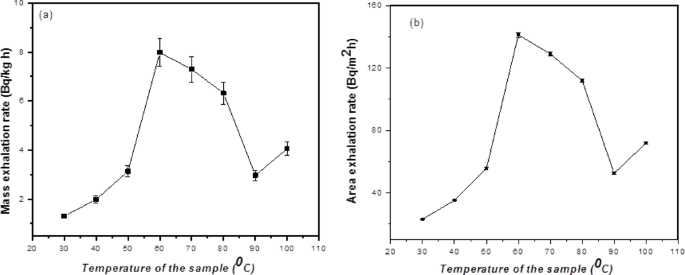
(a) Mass exhalation rate, and (b) Area exhalation rate versus temperature of phosphate sample (< 80 µm).
Fig. 9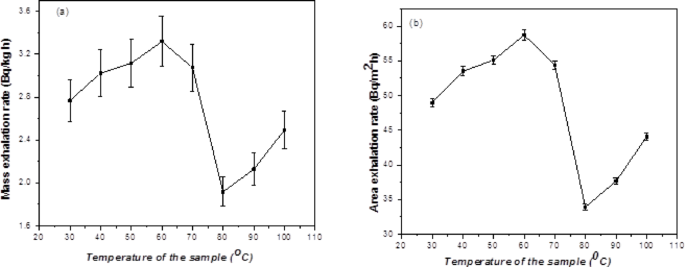
(a) Mass exhalation rate, and (b) Area exhalation rate versus temperature of granite sample (< 80 µm).
Fig. 10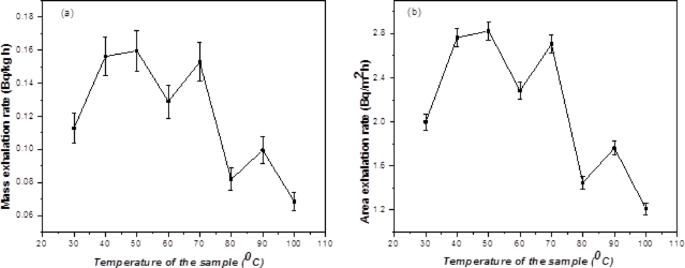
(a) Mass exhalation rate, and (b) Area exhalation rate versus temperature of sand sample (425–200 µm).
Fig. 11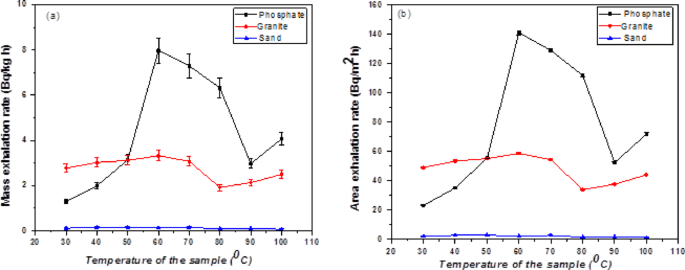
Relationship between (a) Mass exhalation rate, and (b) Area exhalation rate and temperature of samples in phosphate, granite and sand.
In phosphate (Table 7; Fig. 7a, b), the temperature dependence is highly pronounced and well resolved, reflecting strong coupling between thermal activation and pore-mediated radon transport. Quantitatively, Eₘ increases from 1.31 ± 0.09 Bq kg−1 h−1 at 30 °C to a maximum of 7.98 ± 0.56 Bq kg−1 h−1 at 60 °C, while Eₐ raises from 23.09 ± 0.33 to 141.11 ± 1.52 Bq m−2 h−1 over the same interval. This ~ six-fold enhancement is clearly reflected in Fig. 7b as a steep, near-exponential increase and in Fig. 7a as a sharp, well-defined peak at 60 °C. The combined representation in Fig. 11 further confirms that phosphate exhibits the strongest thermal sensitivity among all samples.
Beyond 60 °C, a systematic decline is observed, with Eₘ decreasing to 4.06 ± 0.29 Bq kg−1 h−1 and Eₐ to 71.85 ± 0.82 Bq m−2 h−1 at 100 °C (Table 7), although both values remain above the initial baseline. The descending branch suggests the onset of competing inhibitory mechanisms. The strong biphasic behavior indicates that phosphate operates in a transport-enhanced regime at low temperature transitioning to a transport-limited regime at higher temperature. The initial increase is attributed to thermally activated diffusion (Arrhenius-type dependence), desorption of radon from internal surfaces, and evaporation of pore moisture, all of which increase the effective emanation coefficient and permeability34,56,57. In contrast, the decline above 60 °C implies thermo-mechanical restructuring, including pore constriction, microcrack closure, and possible surface modification (e.g., incipient sintering), which reduce effective diffusivity despite increasing thermal energy. Similar structural effects at elevated temperature have been discussed in porous media studies16,32,34. Similar observations have also been reported for heat-treated geological materials. Li et al.40,41 are demonstrated that thermal treatment modifies pore structure and moisture content, thereby influencing radon transport and exhalation. Although the present study is limited to 30–100 °C, these findings provide additional support for the proposed mechanism that thermally induced changes in pore characteristics contribute to the observed decrease in the 222Rn exhalation rate at elevated temperatures.
Granite sample (see Table 8; Fig. 9a, b) exhibits a substantially weaker and broader temperature response, consistent with its dense crystalline structure. The mass exhalation rate increases modestly from 2.77 ± 0.20 Bq kg−1 h−1 at 30 °C to 3.32 ± 0.24 Bq kg−1 h−1 at 60 °C, while Eₐ increases from 48.98 ± 0.59 to 58.72 ± 0.69 Bq m−2 h−1. This ~ 20% increase is depicted in Fig. 9a as a shallow, rounded maximum. The limited variation indicates that temperature-induced changes are secondary relative to intrinsic structural constraints, as also reported by58. Above 60 °C, both Eₘ and Eₐ decrease, reaching minimum values near 80 °C (Table 8), followed by partial recovery at 90–100 °C. This behavior suggests a dynamic balance between crack closure and reopening mechanisms driven by thermal expansion and differential mineral responses. The relatively small amplitude of variation confirms that granite remains in a structure-limited diffusion regime, where temperature modifies but does not dominate radon transport55,59.
In contrast, sand (Table 9; Fig. 10a, b) shows minimal and non-systematic temperature dependence, with both Eₘ and Eₐ remaining at very low levels across the entire temperature range. The observed fluctuations are within experimental uncertainty, indicating that the apparent variations are close to the detection limit. This weak response reflects fundamental limitations imposed by grain-scale radon generation and transport. In coarse sand, most radon atoms are generated at depths far exceeding the alpha-recoil escape range (~ 20–70 nm), resulting in an intrinsically low emanation fraction. Consequently, the system is source-limited rather than transport-limited, and temperature-induced changes in diffusion or desorption have negligible impact. Similar conclusions have been reported for coarse-grained and quartz-dominated materials57.
The comparative analysis in Fig. 11 clearly establishes a hierarchy in both magnitude and temperature sensitivity: phosphate ≫ granite ≫ sand, consistent with decreasing porosity and increasing structural rigidity. The biphasic response is therefore most pronounced in materials with well-developed pore networks and high surface reactivity, and progressively diminishes as transport becomes constrained by microstructure.
Low-temperature regime (30–60 °C): transport enhancement
In this regime, increasing temperature enhances radon exhalation through three coupled mechanisms. First, the diffusion coefficient increases with temperature according to Arrhenius-type behavior, facilitating faster migration through pore spaces and grain boundaries56,58. Second, thermal energy reduces radon adsorption on internal surfaces, increasing the fraction of atoms that remain in the gas phase34. Third, evaporation of residual moisture removes liquid barriers, significantly increasing pore connectivity—an effect particularly pronounced in porous materials such as phosphate57.
High-temperature regime (60–100 °C): transport suppression
Above ~ 60 °C, the decline in exhalation rates indicates that structural and permeability-limiting processes become dominant. Thermal expansion of mineral grains reduces pore throat diameters and can close microcracks, thereby decreasing effective diffusivity. In phosphate, additional effects such as surface restructuring or partial sintering may further reduce permeability. In granite, the observed dip and recovery behavior suggests fracture closure followed by reopening due to differential thermal expansion among mineral phases59. Secondary processes such as changes in gas transport regime or thermal transpiration may also contribute, although their effects are likely minor at the investigated temperature range. Importantly, the observed decrease above 60 °C does not contradict previous studies but rather extends the investigated temperature range. Previous works have been limited to ≤ 45 °C32,34, where the positive temperature dependence dominates32,34,47. The present results demonstrate that for porous materials, an optimal temperature (~ 60 °C) exists at which radon exhalation is maximized. Beyond this point, structural constraints progressively outweigh kinetic enhancement, highlighting the importance of considering nonlinear thermal effects in radon transport modeling.