
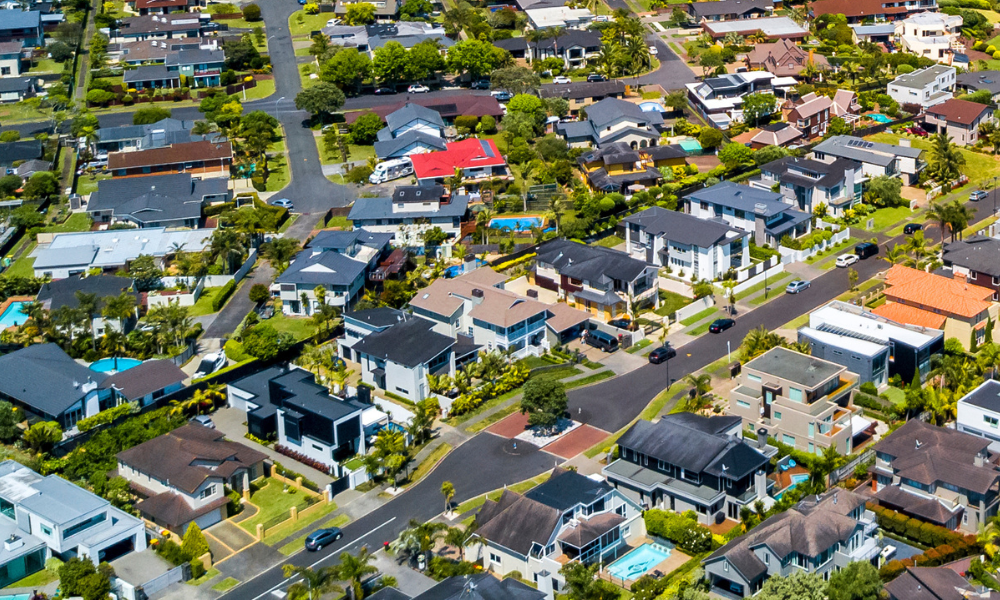
“Buyers remain wary, they’ve still got plenty of choice, and there’s very little sense of urgency given the wider economic and political context. Interest rates and the approaching election are giving people even more reason to take their time and negotiate hard,” he said.
Most cities record falling values
Only three of the main urban areas avoided a clear fall. Values were virtually static in Tauranga (+0.1%) and Invercargill (+0.5%), while Queenstown led with 3.1% growth to an average of $1,994,461.
At the other end, values fell 3.2% in Gisborne, 3% in Wellington and Whangārei, and 2.5% across Auckland.
Main Urban Area
Average Value
Quarterly Change
Whangārei
$714,675
-3.0%
Auckland Region
$1,159,440
-2.5%
Tauranga
$1,050,221
0.1%
Hamilton
$776,357
-1.2%
Rotorua
$664,951
-2.5%
Gisborne
$594,536
-3.2%
Napier
$747,400
-0.2%
Hastings
$748,014
-1.8%
New Plymouth
$704,175
-2.0%
Whanganui
$512,901
-0.5%
Palmerston North
$623,588
-1.2%
Wellington City
$872,174
-3.0%
Nelson
$772,052
-0.2%
Marlborough
$691,856
-0.5%
Greymouth
$467,799
-1.0%
Christchurch City
$805,275
-0.1%
Timaru
$535,957
-1.0%
Queenstown
$1,994,461
3.1%
Dunedin
$652,943
-0.7%
Invercargill
$549,973
0.5%
New Zealand (Average)
$892,580
-1.5%
Source: QV
South Island bucks the national trend
A regional divide is evident. Average values rose across all of Southland and most of Otago this quarter, while Southland is 4.3% higher than at the start of the year. In the Wellington region, Porirua fell furthest, down 5.5% for the quarter and 7.4% on a year earlier.
“The economic recovery remains uneven and we’re seeing that reflected in property values. There really isn’t one consistent housing market right now – it’s still a patchwork of pluses and minuses, although mostly minuses,” Petersen said.