
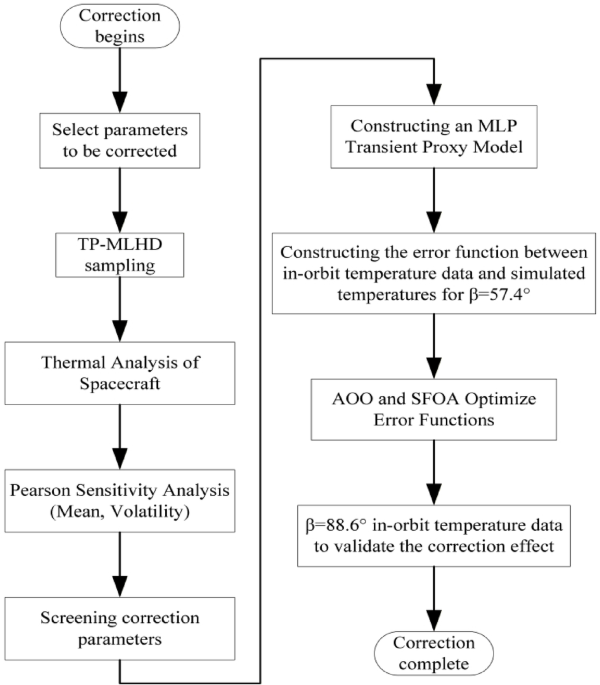
Technical approach for correcting transient thermal analysis models
This paper makes reference to the aforementioned research on thermal analysis model correction techniques and establishes a correction scheme for transient thermal analysis models. This scheme utilizes in-orbit temperature data and employs parameter sampling, sensitivity analysis, transient surrogate models, and optimization algorithms for correction. The correction workflow is illustrated in Fig. 1. During the correction process, 1,000 samples were first extracted for the selected 25 parameters using an improved Latin hypercube design. Subsequently, a computational program was utilized to perform an aerospace thermal analysis, and a sensitivity analysis was employed to screen out 18 parameters. Subsequently, based on the filtered correction parameters, simulated temperature data corresponding to the in-orbit measurement points were extracted for time-series sampling. The orbital period of the subject was determined to be approximately 6089 s, and the sampling procedure was executed at 50-s intervals, yielding a total of 122 samples per cycle. A transient surrogate model was constructed to link the correction parameters and measurement point temperatures. This model was created using a multi-layer perceptron (MLP). Finally, an error objective function between simulation and in-orbit measurements was constructed using the single-orbit temperature data from the initial operational phase when the β angle was minimal (June 22, 2022). The model was optimized using the Animated Oat Optimization (AOO) and StarFish Optimization (SFOA) algorithms to determine the true values of the parameters requiring correction. The efficacy of the correction is subsequently validated through the utilization of single-orbit temperature data from the orbit exhibiting the maximum β angle (October 16, 2022).
Fig. 1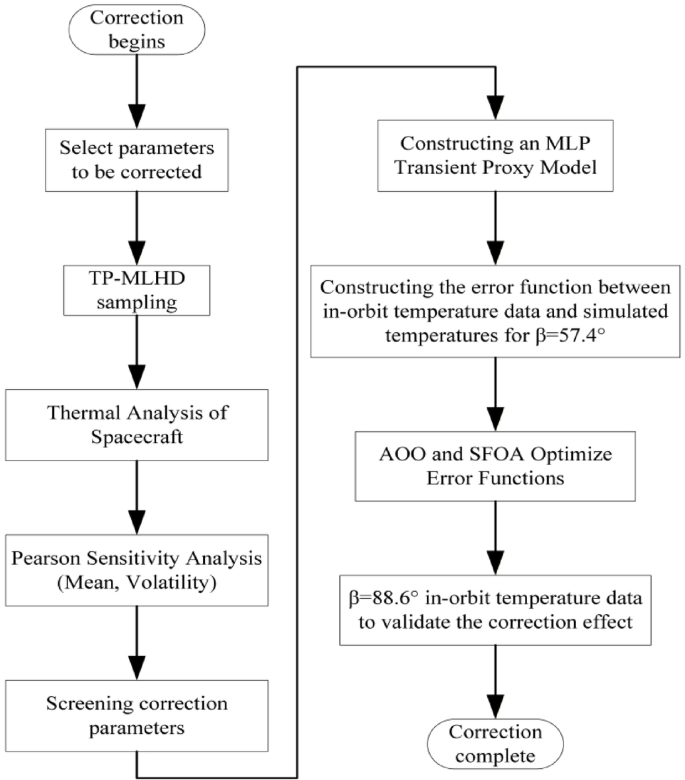
Transient thermal analysis model correction process.
Orbital position and structure of the imager
The Solar Extreme Ultraviolet Imager operates in a sun-synchronous orbit at an altitude of 836 km with an orbital inclination of 98.76°. The β angle of the sun-synchronous orbit undergoes continuous variation throughout the year. Figure 2 illustrates the β angle variation curve for the instrument’s orbit during 2022. The β angle attains its minimum (57.4°) on June 22 and its maximum (88.6°) on October 16. The β angle exhibits a direct influence on the amplitude of the instrument’s attitude variations and its external heat flux conditions.
Fig. 2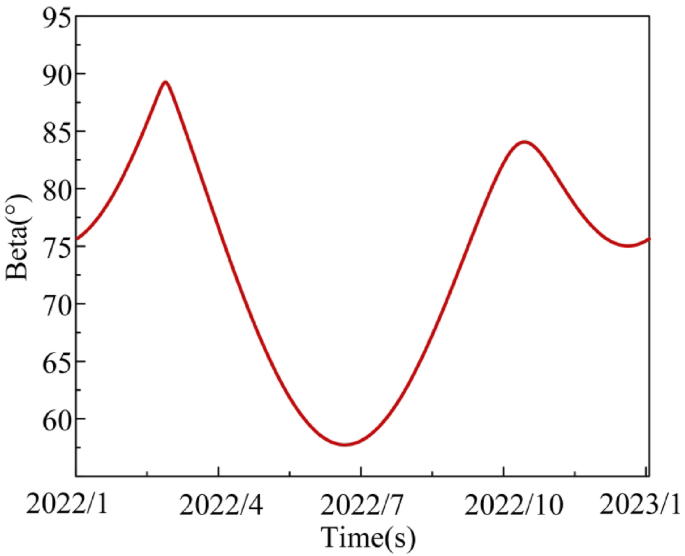
Annual variation curve of the beta angle.
The CCD of the Solar Extreme Ultraviolet Imager functions at approximately − 60 °C, exhibiting a substantial temperature disparity compared to the surrounding components (20 °C). Consequently, a specialized space-radiation cold plate was engineered for heat dissipation, and cooling surfaces were designed for each electrical enclosure to ensure thermal compliance. Furthermore, discrete thermal designs were executed for the lens assembly, pointing mechanism, guide telescope, photometer, electric boxes, and CCD assembly. This approach was adopted to ensure the reliable operation of these components at their requisite temperatures.
The Solar Extreme Ultraviolet Imager is composed of three distinct subsystems: an imaging subsystem, an electrical subsystem, and a pointing mechanism subsystem, as illustrated in Fig. 3. The imaging subsystem comprises the lens assembly, guide telescope assembly, photometer assembly, and CCD assembly. The electrical subsystem comprises the following components: electric box 1, electric box 2, electric box 3, the guide telescope electric box, the photometer electric box, and the signal processing box. The pointing mechanism subsystem consists of the base, U-shaped bracket, O-shaped bracket, encoder, and pointing motor.
Fig. 3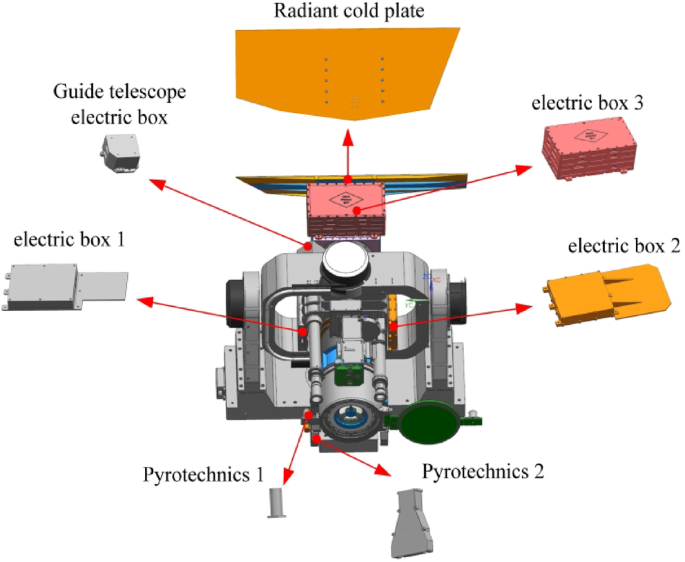
Schematic diagram of the solar extreme ultraviolet imager.
As illustrated in Fig. 4, the final prototype of the Solar Extreme Ultraviolet Imager is presented. With the exception of the heat dissipation surfaces, the entirety of the exterior is covered with multiple layers of material in order to meet thermal insulation requirements. The Solar Extreme Ultraviolet Imager was successfully launched on July 5, 2021, and has operated stably for a period of four years. Figure 5 presents an image captured by the imager at 02:01 on November 5, 2021. The image illustrates the superior imaging capabilities during the solar flare eruption period from October 21 to November 10, which is of considerable significance for solar activity observation1.
Fig. 4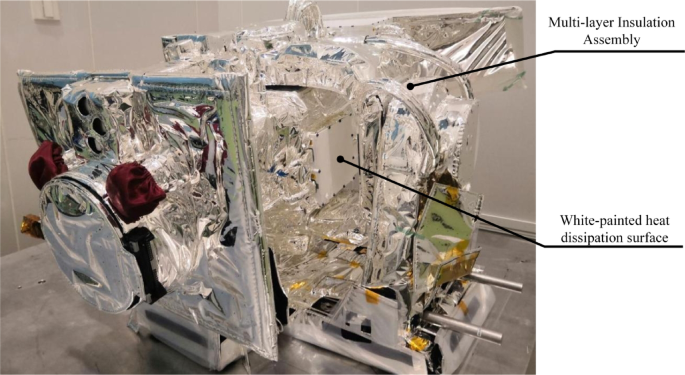
Final prototype of the solar extreme ultraviolet imager.
Fig. 5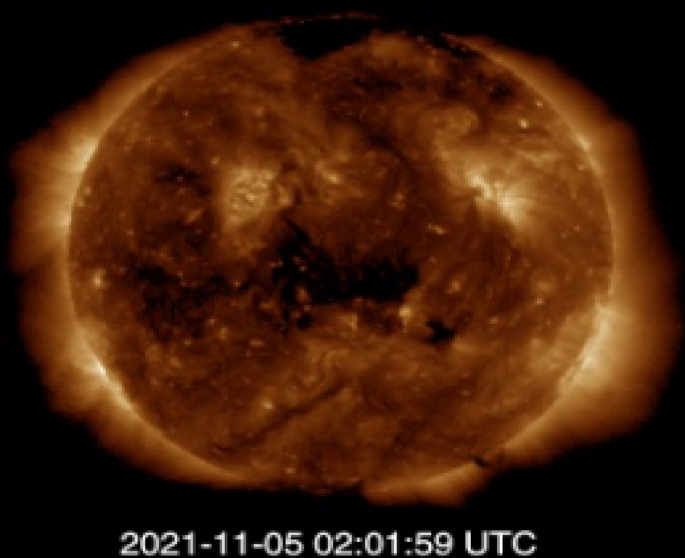
Image captured by the solar extreme ultraviolet imager.
In-orbit temperature data for the imager
To monitor the in-orbit status of the imager, multiple temperature sensors were installed on the instrument. This paper selected seven temperature measurement points that significantly impact the imager’s operational state and lack temperature control capabilities. These include the radiant cold plate, electric Box 3, guide telescope electric box, electric box 1, electric box 2, pyrotechnics 1, and pyrotechnics 2. It has been demonstrated that the radiant cold plate’s capacity for heat dissipation exerts a direct influence on the normal operation of the detector. Furthermore, the four electric boxes have been shown to directly impact the precision of motion and the quality of imaging. In addition, the pyrotechnic devices have been demonstrated to directly impact the mobility of the joint.
Figure 6 presents the imaging instrument’s in-orbit data for a single day on June 22, 2022 (β = 57.4°). The inset provides a magnified view of 20,000 s of data, thereby unveiling recurrent temperature fluctuations across the components. The radiant cold plate exhibited a temperature of approximately − 80 °C, thereby satisfying the detector’s requisite cooling criteria. All three electric boxes and the pyrotechnic devices maintained stable conditions, exhibiting no signs of overheating or overcooling. Furthermore, both the thermal management and motion components functioned within normal parameters, thereby ensuring uninterrupted imaging procedures. Figure 7 presents the temperature data acquired from the imaging instrument on October 16, 2022. At this time, the beta angle was measured at 88.6°, with the solar vector directly illuminating the orbital plane. This configuration resulted in minimal movement of the imaging instrument. Consequently, temperature fluctuations across components were minimal. Components associated with motion, such as the pyrotechnic devices and electric box 1, exhibited minor periodic temperature variations.
Fig. 6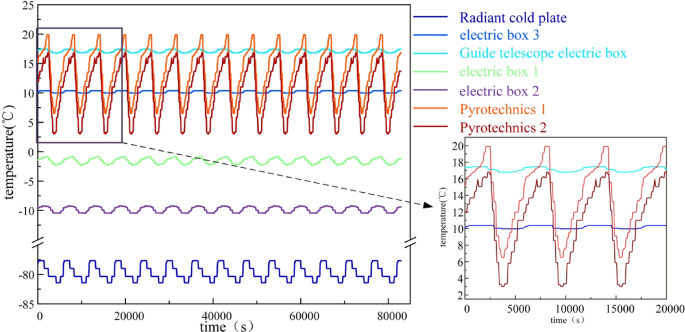
In-orbit temperature data for June 22, 2022.
Fig. 7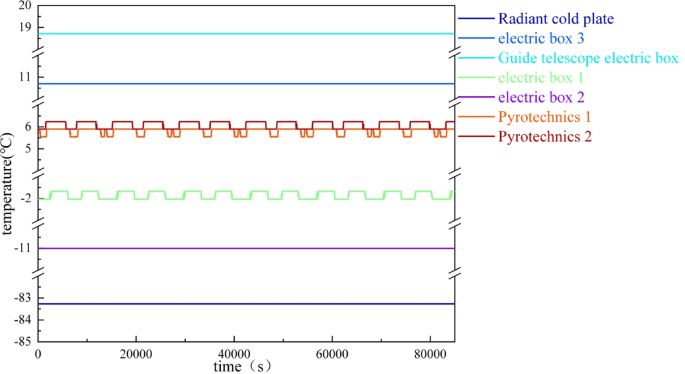
In-orbit temperature data on October 16, 2022.
When β equals 57.4°, the comparison between the simulated temperature before orbital correction and the in-orbit temperature is shown in Fig. 8. The simulated temperature is derived from the outcome of ground steady-state thermal equilibrium tests, which have undergone a correction process. It has been observed that, in comparison to the in-orbit state, certain deviations in average temperature and temperature fluctuation persist (as illustrated in the figure, the average deviations are 2.24 °C, 1.64 °C, 1.49 °C, 2.00 °C, 1.76 °C, 9.1 °C, and 7.64 °C, respectively). Figure 9 presents a comparison between the simulated temperatures and the in-orbit temperatures prior to the orbit correction on October 16, 2022. The sequence of average deviations is 3.69 °C, 3.95 °C, 3.20 °C, 3.80 °C, 3.51 °C, 4.04 °C, and 3.98 °C. This finding suggests that the thermal analysis model, which has been corrected based on ground steady-state thermal equilibrium tests, continues to demonstrate discrepancies in both the mean temperature and the temperature fluctuations when compared to the in-orbit state. Consequently, additional corrections derived from in-orbit temperature data are necessary to enhance the predictive accuracy of the simulation model.
Fig. 8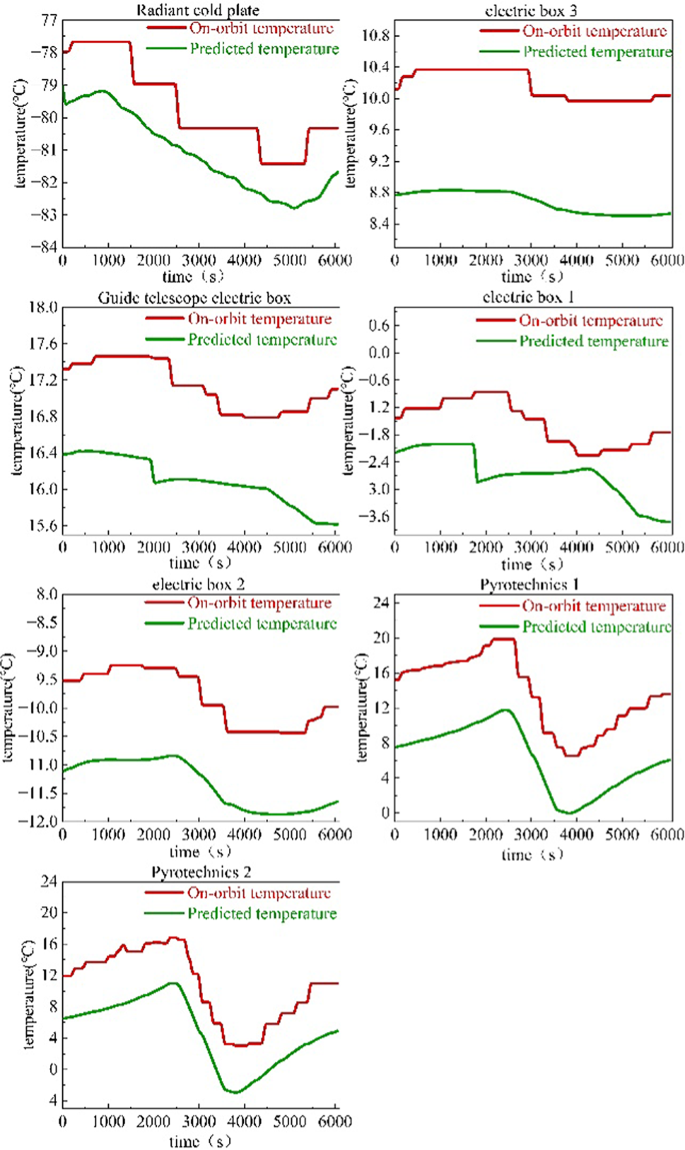
Comparison of temperature data before correction at β = 57.4°
Fig. 9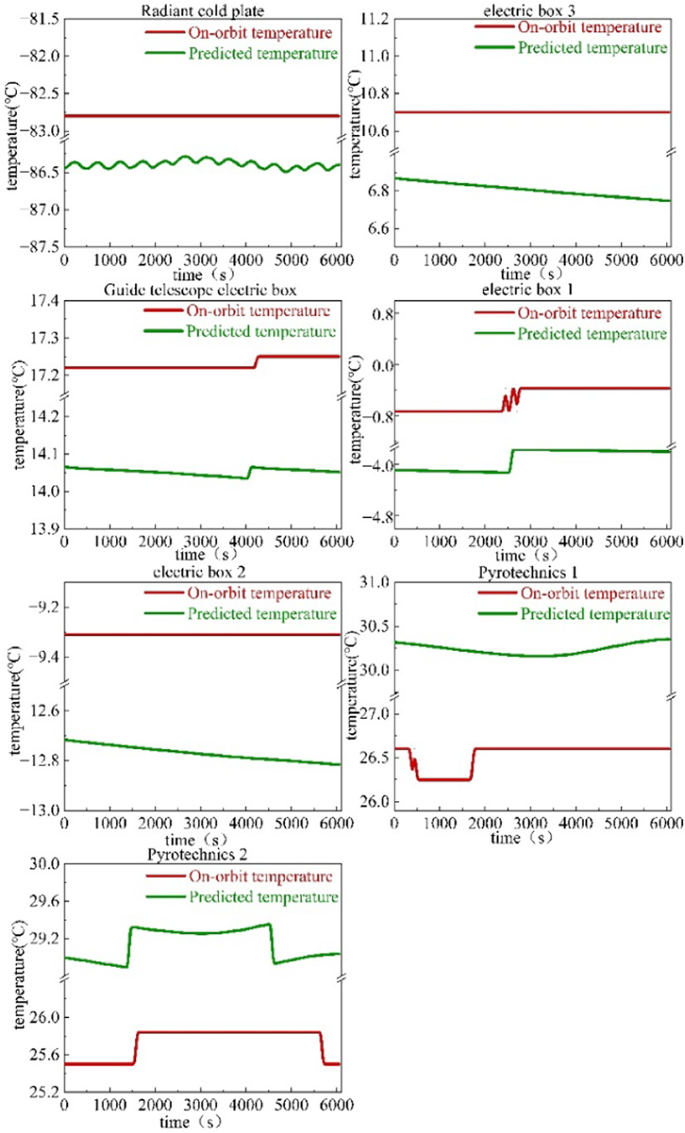
Comparison of temperature data before correction at β = 88.6°