
Global burden trends of idiopathic epilepsy in young adults (1990–2021)Incidence
Comprehensive data analysis revealed a rising global trend in the incidence of idiopathic epilepsy among young adults from 1990 to 2021, with a slight decline observed between 1999 and 2011 (Fig. 1A). The total number of IE cases was 938503.01 (95% UI, 625976.23-1301603.34) in 1990, increasing to 1483535.87 (95% UI, 1037645.71-2001933.45) by 2021, which reflects an overall increase of 58.07% (95% UI, 34.02–84.58). Correspondingly, the incidence rate increased from 34.63 (95% UI, 23.09–48.02) per 100,000 people in 1990 to 37.57 (95% UI, 26.28–50.70) per 100,000 people in 2021, with a non-statistically significant increase of 8.51 (95% UI, −8.00 to 26.70) (Table 1). The global EAPC value was 0.13% (95% CI, 0.09–0.17) (Table 1; Fig. 2).
Table 1 Incidence of idiopathic epilepsy in young adults aged 19–49 between 1990–2021 at the global and regional levelFig. 1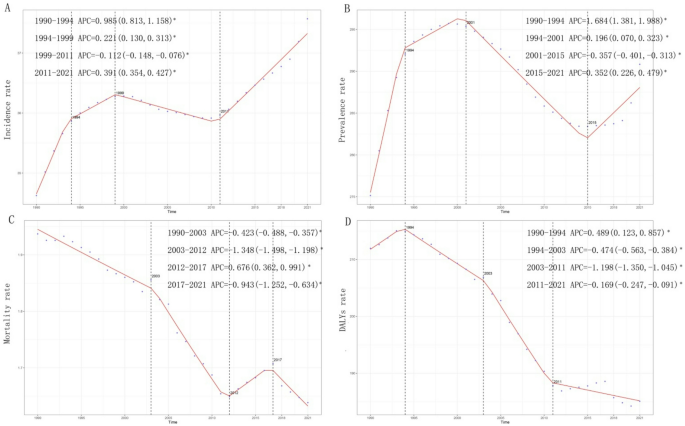
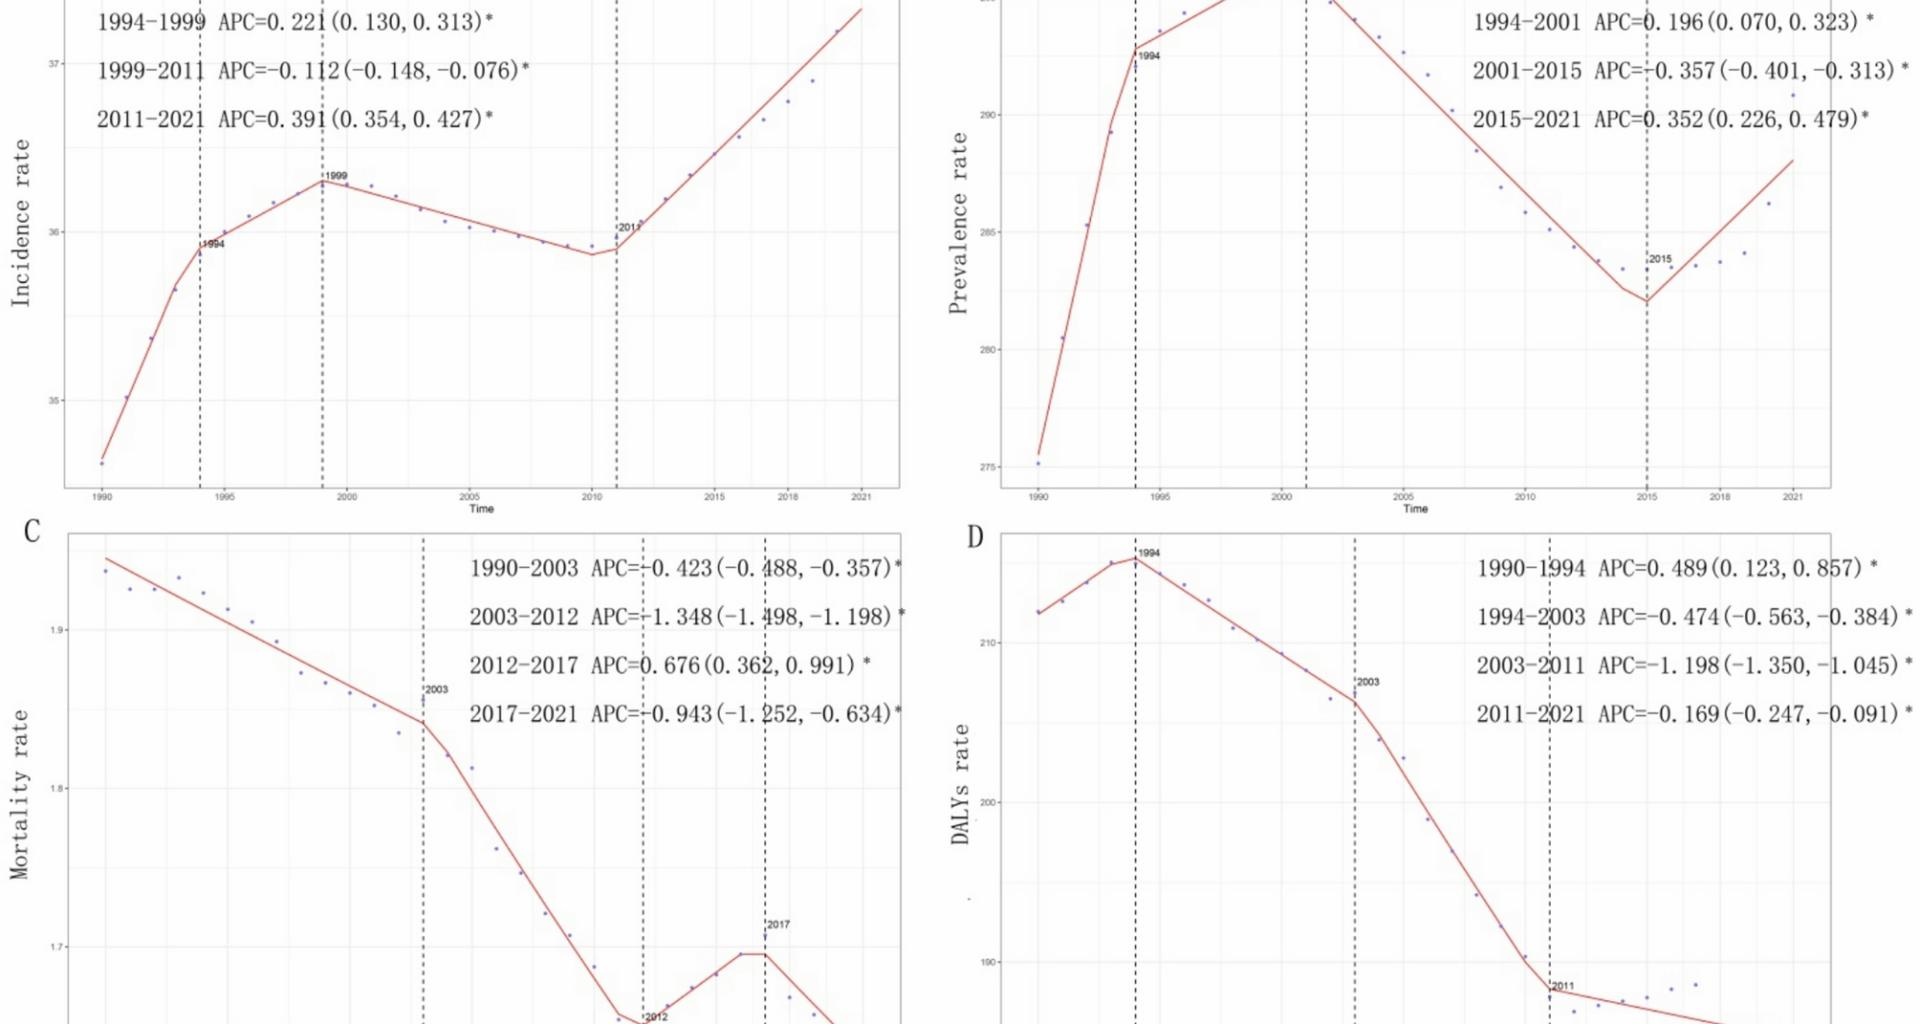
Annual percent change (APC) and trends in the global incidence, prevalence, mortality and disability-adjusted life years (DALYs) of idiopathic epilepsy in young adults from 1990–2021. A, Incidence rate. B, Prevalence rate. C, Mortality rate. D, DALY rate
Fig. 2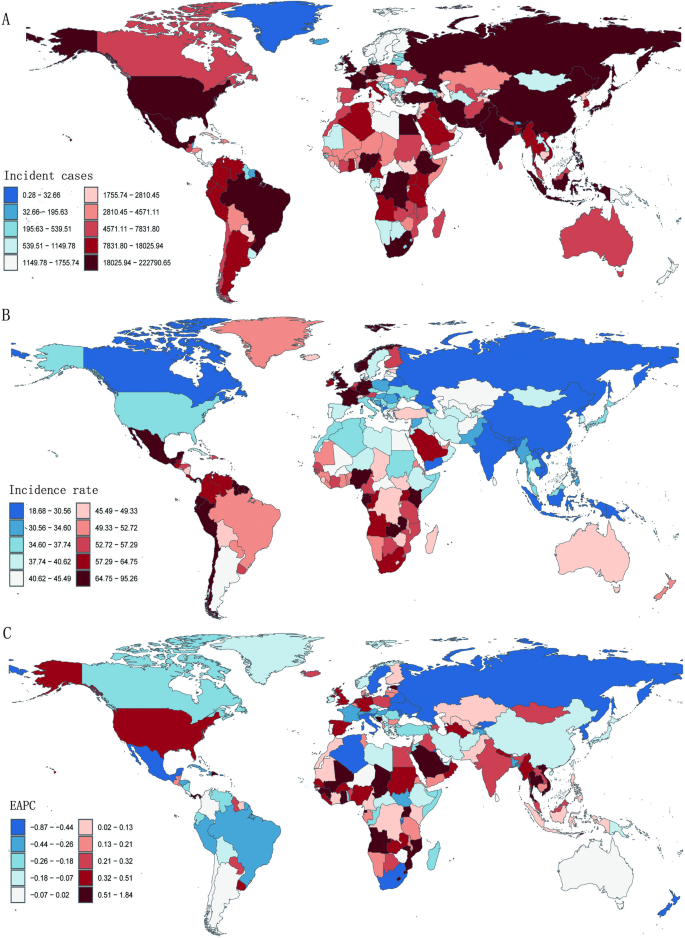
Incidence of idiopathic epilepsy in young adults across 204 countries and territories. A, Number of incidence cases. B, Incidence rate. C, Estimated annual percentage change (EAPC) in incidence
Notably, the incidence was the highest in the 15–19 age group, with a gradual decline as age increased, culminating in the lowest in the 45–49 age group t(Fig. 3A). In 2021, the 15–19 age group accounted for 20.0% of the total incidence rate, with a rate of 51.77 per 100,000 people (95% UI, 29.09–81.69; Fig. 3A and S1A). Conversely, the age group 45–49 represented only 10.9%, with a rate of 28.26 per 100,000 people (95% UI, 18.27–42.75; Fig. 3A and S1A). Gender analysis revealed no substantial differences in incidence rates, although the rates for males were higher than that for females across all age groups (Fig. 3B and S2).
Fig. 3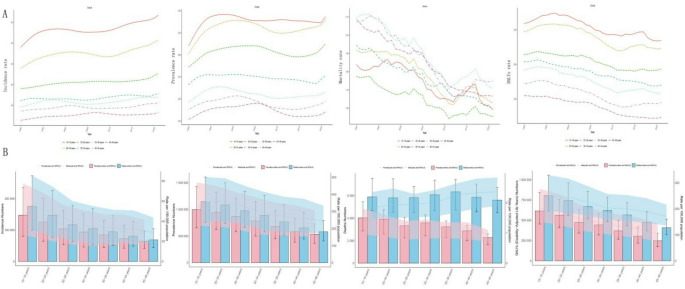
Trends in incidence, prevalence, mortality and disability-adjusted life years (DALYs) of idiopathic epilepsy in young adults by age and sex, 1990–2021. A, Rates of incidence, prevalence, mortality and DALYs by age. B, Nubmers and rates of incidence, prevalence, mortality and DALYs by age and sex
Prevalence
The global incidence trend of idiopathic epilepsy increased from 1990 to 2001, followed by a significant decline until 2015, after which it increased again through 2021 (Fig. 1B). In 1990, there were approximately 7.46 million (95% UI 5.40–9.68) prevalent cases of idiopathic epilepsy worldwide, which rose to 11.5 million (95% UI 8.35–14.8) by 2021, an increase of 53.98% (95% UI 30.21–80.11). Similarly, the prevalence rate increased from 275.15 (95% UI, 199.05-357.13) per 100,000 people in 1990 to 290.83 (95% UI, 211.42-373.58) per 100,000 people in 2021, reflecting no statistically significant change of 5.70 (95% UI, −10.62 to 23.63). The global EAPC value was − 0.06% (95% CI, −0.13–0.01%) (Table S1).
In terms of age subgroups, the prevalence was consistently highest in the segment 15–19, gradually declined as age increased, and diminished to the lowest in the 45–49 segment (Fig. 3A). In 2021, the 15–19 segment accounted for 17.1% of the total prevalence, with a corresponding rate of 343.38 per 100,000 people (95% UI, 227.47–487.20), whereas the 45–49 segment represented 11.7%, with a rate of 235.26 per 100,000 people (95% UI, 162.27-321.73) (Fig. 3A and S1B). Gender differences in prevalence rates were not significant across age groups, although the prevalence rates for males were consistently higher than that for females (Fig. 3B and S3).
Mortality
In contrast to incident trends, IE-related mortality exhibited a substantial decreasing trend from 1990 to 2012, followed by an increase from 2012 to 2017 and a subsequent decrease from 2017 to 2021. The lowest APC was recorded between 2003 and 2012, with a value of −1.348% (95% CI, −1.498% to −1.198%) (Fig. 1C). The lowest mortality rate was observed in 2021, at 1.64 (95% UI, 1.83–1.38) per 100,000 people (Fig. 1C). The global number of deaths attributed to IE in 1990 was 52503.81 (95% UI, 44526.44-57962.76), which increased to 64692.51 (95% UI, 54671.02-72386.47) by 2021, representing an overall increase of 23.21% (95% UI, 11.93–34.17%) (Table S2). However, the mortality rate decreased from 1.94 (95% UI, 1.64–2.14) per 100,000 people in 1990 to 1.64 (95% UI, 1.38–1.83) per 100,000 people in 2021, reflecting a decrease of −15.42% (95% UI, −23.17% to −7.90%). The EAPC was − 0.62% (95% CI, −0.66% to −0.57%) (Table S2).
In terms of age subgroups, the mortality was highest in the 35–44 segment, and was lowest in the segment 25–29 from 1990 to 2021 (Fig. 3B). In 2021, the 40–44 segment accounted for 15.2% of the total mortality rate, with a corresponding rate of 1.75 per 100,000 people (95% UI, 1.41–1.96), whereas the 25–29 segment represented 13.5%, with a rate of 1.55 per 100,000 people (95% UI, 1.23–1.79) (Fig. 3A and S1C). Gender differences in mortality rates were significant, with males exhibiting higher rates than females (Figs. 3B and 4A).
Fig. 4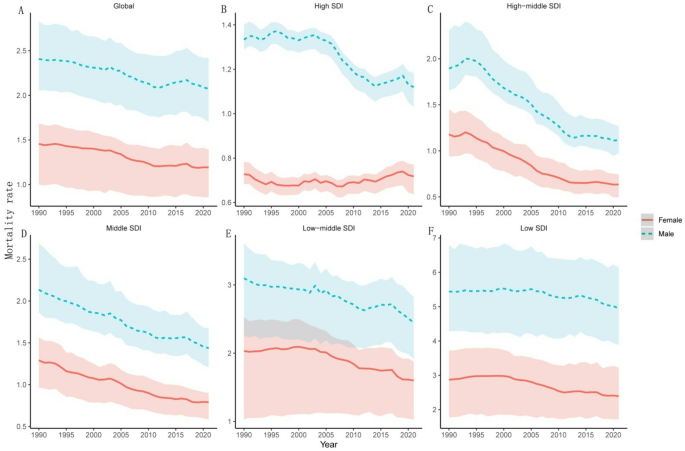
Temporal trends of mortality rates of idiopathic epilepsy in young adults by SDI quintiles and gender from 1990–2021
DALYs
Consistent with mortality trends, the rates of DALYs initially increased but then subsequently decreased over the past three decades. The lowest APC was recorded from 2003 to 2011, with a value of −1.198% (95% CI, −1.350% to −1.045%) (Fig. 1D). The lowest DALY rate was observed in 2020, at 184.25 (95% UI, 145.17–227.70) per 100,000 people (Fig. 1D). The number of global DALYs attributed to IE in 1990 was 5745062.10 (95% UI, 4522195.86-7071108.31), which increased to 7308526.78 (95% UI, 5688165.27-9081754.45) by 2021, representing an overall increase of 27.21% (95% UI, 14.35%−40.33%) (Table S3). The DALY rate decreased from 211.96 (95% UI, 166.84-260.88) per 100,000 people in 1990 to 185.09 (95% UI, 144.06–230.00) per 100,000 people in 2021, reflecting a decrease of −12.67% (95% UI, −21.51% to −3.67%). The EAPC was − 0.59% (95% CI, −0.65% to −0.53%) (Table S3).
In terms of age subgroups, the 15–19 segment consistently presented the highest DALY rate with the lowest in the 45–49 segment, with a gradual decreasing trend as age increased from 1990 to 2021 (Fig. 3A). In 2021, individuals aged 15–19 accounted for 17.8% of the total DALY rate, with a corresponding rate of 227.52 per 100,000 people (95% UI, 173.58-301.11), whereas the 45–49 segment represented 10.8%, with a rate of 138.69 per 100,000 people (95% UI, 105.66-178.76) (Fig. 3A and S1D). Gender differences in DALY rates were not substantial, although males exhibiting higher DALY rates than females across all age groups (Fig. 3B and S4).
Regional trends of idiopathic epilepsy in young adults (1990–2021)Incidence and prevalence by SDI region
From 1990 to 2021, a decline in both incidence rates and prevalence rates was observed in high–middle-SDI regions, with EAPC values of −0.19% (95% CI, −0.27% to −0.11%) for incidence and − 0.51% (95% CI, −0.65% to −0.37%) for prevalence. Conversely, an increasing trend in these rates was observed in the remaining four SDI regions, with the largest increases occurring in low-middle-SDI regions, which presented EAPCs of 0.38% (95% CI, 0.30%−0.46%) for the incidence rate and 0.23% (95% CI, 0.18%−0.29%) for the prevalence rate (Table 1 and Table S1). Furthermore, high-SDI regions consistently reported the highest incidence and prevalence rates, followed by low-, middle- and low-middle-SDI regions, with middle-high-SDI regions exhibiting the lowest rates (Fig. 5). Furthermore, no gender differences on incidence and prevalence rates were found across SDI regions (Figure S2 and S3).
Fig. 5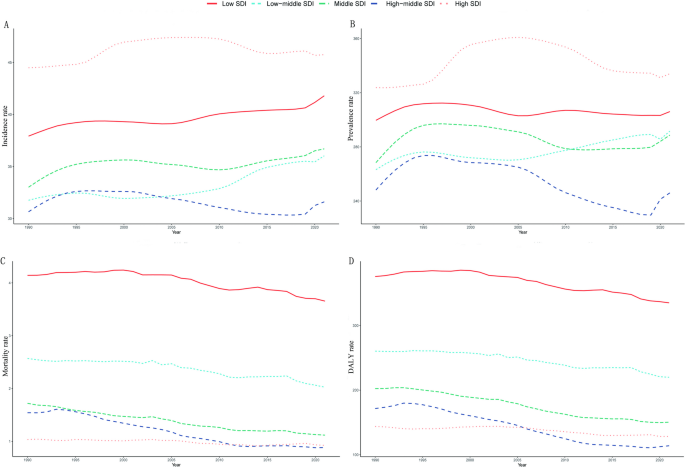
Epidemiologic trends in incidence, prevalence, mortality and DALY rates of idiopathic epilepsy in young adults across five sociodemographic index (SDI) areas from 1990–2021
Mortality and DALYs by SDI region
From 1990 to 2021, a downward trend in mortality and DALY rates was observed across all five SDI regions, with the most pronounced reductions occurring in high–middle SDI regions, which presented EAPCs of −2.03% (95% CI, −2.16% to −1.90%) for the mortality rate and − 1.84% (95% CI, −1.99% to −1.69%) for the DALY rate (Table S2 and Table S3). The decline in mortality rates was lowest in low-SDI regions, with an EAPC of −0.24% (95% CI, −0.32% to −0.17%), whereas the decrease in DALY rates was smallest in high-SDI regions, with an EAPC of −0.38% (95% CI, −0.46% to −0.30%; Table S2 and Table S3). Additionally, a trend was identified indicating that lower SDI levels corresponded with higher mortality and DALY rates (Fig. 5). Throughout the 1990–2021 period, the low SDI regions consistently presented the highest mortality and DALY rates, with values of 3.65/100,000 (95% UI, 3.03–4.39) and 335.11/100,000 (95% UI, 267.66-413.26), respectively, in 2021 (Table S2, Table S3 and Fig. 5). Besides, males exhibited significant higher mortality rates than females across SDI regions with no change on DALY rates (Fig. 4 and S4).
Incidence and prevalence by geographic region
Among the 21 geographic regions, high-income North America, western sub-Saharan Africa and Southeast Asia were the three regions with the greatest increases in incidence rates, with EAPCs of 0.43% (95% CI, 0.26%−0.61%), 0.39% (95% CI, 0.30%−0.48%) and 0.27% (95% CI, 0.25%−0.28%), respectively. In contrast, Eastern Europe, Central Latin America and Tropical Latin America experienced the largest decreases, with EAPCs of −0.69% (95% CI, −0.75% to −0.63%), −0.37% (95% CI, −0.43% to −0.32%) and − 0.34% (95% CI, −0.54% to −0.14%), respectively (Table 1; Fig. 5). Similarly, Southeast Asia, Western Sub-Saharan Africa and Central Sub-Saharan Africa reported the highest increases in prevalence rates, with EAPC values of 0.28% (95% CI, 0.23%−0.32%), 0.21% (95% CI, 0.06%−0.35%) and 0.19% (95% CI, 0.02%−0.36%), respectively. Conversely, Eastern Europe, Andean Latin America and Tropical Latin America presented the greatest decreases in prevalence rates, with EAPCs of −1.08% (95% CI, −1.15% to −1.01%), −0.83% (95% CI, −0.98% to −0.68%) and − 0.76% (95% CI, −1.07% to −0.44%), respectively (Table S1, Fig. 6).
Fig. 6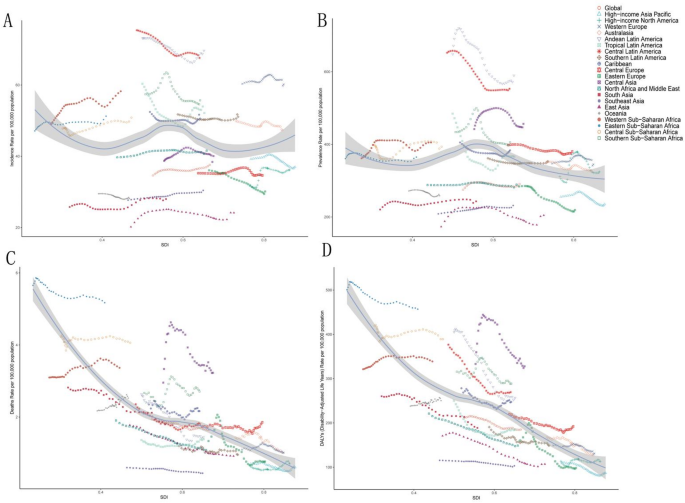
Association between incidence, prevalence, mortality and DALY rates of idiopathic epilepsy in young adults and the regional sociodemographic index (SDI), 1990–2021. A, Incidence rate. B, Prevalence rate. C, Mortality rate. D, DALY rates
Mortality and DALYs by geographic region
Among the 21 geographic regions, western sub-Saharan Africa, Oceania and Central Asia were the three regions with the greatest increases in incidence rates, with EAPCs of 0.41% (95% CI, 0.34%−0.47%), 0.41% (95% CI, 0.34%−0.47%) and 0.23% (95% CI, 0.16%−0.62%), respectively. Conversely, Eastern Europe, Andean Latin America and East Asia experienced the most significant decreases, with EAPCs of −2.70% (95% CI, −3.17% to −2.22%), −2.21% (95% CI, −2.36% to −2.05%) and − 2.17% (95% CI, −2.26% to −2.08%), respectively (Table S2, Fig. 6). In terms of prevalence rates, western sub-Saharan Africa, high-income North America and Oceania were the three regions with the greatest increases, with EAPCs of 0.24% (95% CI, 0.16%−0.32%), 0.21% (95% CI, 0.05%−0.37%) and 0.20% (95% CI, 0.15%−0.24%), respectively. In contrast, Eastern Europe, East Asia and Andean Latin America reported the largest decreases in prevalence rates, with EAPCs of −2.57% (95% CI, −2.87% to −2.26%), −2.05% (95% CI, −2.20% to −1.90%) and − 1.93% (95% CI, −2.09% to −1.76%), respectively (Table S3, Fig. 6).
National trends of idiopathic epilepsy in young adults (1990–2021)Incidence
In 2021, India reported the highest number of cases of idiopathic epilepsy among young adults, with a total of 220584.80 cases (95% UI, 147854.82-305341.61) across 204 countries. Conversely, Tokelau reported the lowest incidence, with only 0.20 cases (95% UI, 0.05–0.40). The Republic of Ecuador presented the highest incidence rate of 94.32 per 100,000 people (95% UI, 29.85-166.43), whereas the Democratic People’s Republic of Korea presented the lowest rate of 18.87 per 100,000 people (95% UI, 4.78–35.19) (Table S4; Fig. 2A and B). From 1990 to 2021, the Republic of Equatorial Guinea experienced the largest increase in the incidence rate, with an EAPC of 1.82% (95% CI, 1.50%−2.13%), whereas Saint Kitts and Nevis demonstrated the steepest decrease, with an EAPC of −0.86% (95% CI, −0.92% to −0.80%) (Table S4; Fig. 2C). Among the countries analyzed, 143 reported incidence rates that exceeded the global average, whereas 61 reported lower incidence rates.
Prevalence
In 2021, Belarus reported the highest number of IE cases among youth and young adults, totaling 9797.94 cases (95% UI, 2587.27-16354.37), whereas Tokelau reported the fewest cases, with 1.81 (95% UI, 0.42 3.09). Ecuador recorded the highest prevalence rate at 760.28 per 100,000 people (95% UI, 233.03-1244.03), in contrast to the Democratic People’s Republic of Korea, which had the lowest prevalence rate of 179.59 per 100,000 people (95% UI, 48.00-313.76) (Table S5; Figure S5A and S5B). From 1990 to 2021, Equatorial Guinea presented the largest increase in the prevalence rate, with an EAPC of 2.33% (95% CI, 1.92–2.74), whereas the Republic of Moldova presented the steepest decrease, with an EAPC of −1.46% (95% CI, −1.57% to −1.35%) (Table S5 and Figure S5C). Among the countries surveyed, 139 reported prevalence rates above the global average, whereas 65 reported lower rates.
Mortality
In 2021, India recorded the highest number of deaths associated with IE among youth and young adults worldwide, with 13274.43 cases (95% UI, 10533.21-15238.18), whereas Tokelau reported the fewest deaths, with 0.01 cases (95% UI, 0.01–0.02). The Republic of Zambia had the highest mortality rate associated with IE at 11.30 per 100,000 population (95% UI, 7.82–16.15), whereas the Socialist Republic of Vietnam had the lowest rate at 0.07 per 100,000 population (95%UI, 0.01–0.32) (Table S6, and Figure S6A and S6B). The global mortality rate in 2021 was 1.64 per 100,000 (95% UI, 1.38–1.83), with 108 countries reporting higher rates and 96 countries reporting lower rates than the global average (Table S6). From 1990 to 2021, Zambia experienced the most significant increase in the mortality rate associated with IE, with an EAPC of 1.80% (95% CI, 1.45–2.16), whereas Belarus experienced the greatest decrease, with an EAPC of −2.96% (95% CI, −3.31% to −2.62%) (Table S6 and Figure S6C).
DALYs
In 2021, India reported the highest number of DALYs among youth and young adults worldwide, totaling 1404279.45 (95% UI, 1096986.28-1761794.54), whereas Tokelau recorded the lowest at 1.52 (95% UI, 0.99–2.21). The Republic of Zambia had the highest DALY rate of 906.84 per 100,000 people (95% UI, 597.07-1261.75), whereas the Republic of San Marino had the lowest rate of 63.07 per 100,000 people (95% UI, 19.33-139.26) (Table S7; Figure S7A and S7B). In 2021, the global DALY rate associated with IE in youth and young adults was 185.09 per 100,000 people (95% UI, 144.06–230.00), which was higher than that reported in 88 out of 204 countries and lower than that reported in 116 countries. From 1990 to 2021, the Republic of Zambia presented the largest increase in the DALY rate, with an EAPC of 1.8% (95% CI, 1.45%−2.16%), whereas the Republic of Belarus presented the largest decrease, with an EAPC of −2.96% (95% CI, − 3.31% to − 2.62% (Table S7; Figure S7C).
Predictions of idiopathic epilepsy in young adults (2022–2035)
The BAPC model was used to predict the epidemiological indicators of idiopathic epilepsy across various age groups from 2022 to 2035. The projections indicated a continuous increase in both incidence and prevalence rates, alongside a persistent decline in mortality and DALY rates throughout this timeframe (Fig. 7). Specifically, the case numbers for both incidence and prevalence were expected to increase across all age cohorts from 2022 to 2035 (Figure S8A and S9A). The incidence rate was expected to continue increasing over the next 13 years for all age cohorts, whereas the prevalence rates for the 15–19 and 20–24 years age cohorts were predicted to stabilize, with other cohorts experiencing an increase (Figure S8B and S9B). With respect to mortality, the projections suggested a significant decrease in case numbers for the 15–34 age group, with a trend of first increasing and then decreasing for the 35–44 age group, and a sharp increasing trend for the 45–49 segment (Figure S10A). In terms of DALYs, a smooth decrease was anticipated for the 15–34 age cohort, with a temporary increase and then decrease for the 35–44 age group, and a substantial increase for the 45–49 segment (Figure S11A). Consistent with the trends observed between 1990 and 2021, a notable decline in mortality and DALY rates across all age cohorts was expected (Figure S10B and S11B).
Fig. 7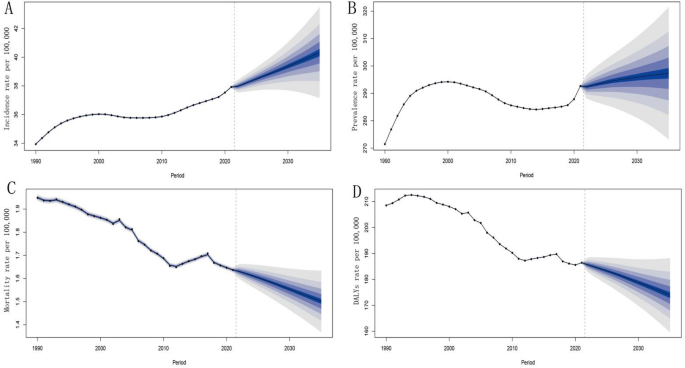
Changes in the disease burden of idiopathic epilepsy in young adults between 1990 and 2021 and their projections up to 2035 at the global level. A, Incidence rate. B, Prevalence rate. C, Mortality rate. D, DALY rates