
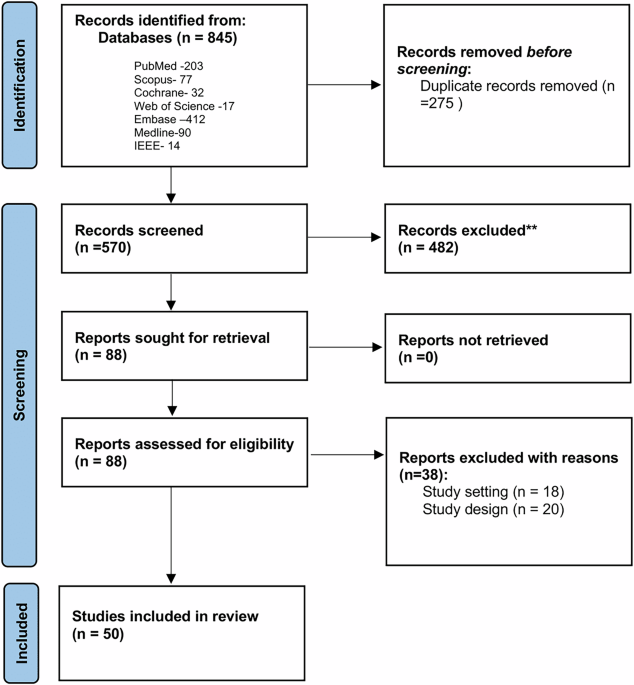
The search yielded 845 papers; after removing duplicates, 570 papers were screened by title and abstract. leaving 88 papers that met the inclusion criteria and were reviewed in full. After exclusions based on study setting, design, and full-text availability, the final sample comprised 50 articles. The flowchart illustrating the study selection process is presented in Fig. 1.
Of the 50 articles, the quality review identified 7 studies that were rated excellent, 41 studies were rated as good, and 2 studies were rated as moderate; all articles were included in this review (Supplementary Table 1). The review captured a total of 5573 participants (Supplementary Table 1). Participants came from 15 different chronic disease domains (Supplementary Table 1): Multiple Sclerosis (n = 27 studies, 2750 participants)16,17,18,19,20,21,22,23,24,25,26,27,28,29,30,31,32,33,34,35,36,37,38,39,40,41,42 Cancer patients and survivors (n = 3 studies, 1164 participants)43,44,45, Long Covid (n = 3 studies, 197 participants)46,47,48, COPD (n = 2 studies, 440 participants)49,50, Chronic Fatigue Syndrome (n = 2 studies, 101 participants)51,52, Rheumatoid Arthritis and Juvenile idiopathic Arthritis (n = 6 studies, 315 participants)53,54,55,56,57,58, Parkinson’s Disease (n = 2 studies, 60 participants)57,59, Chronic Stroke (n = 1 study, 57 participants)60, Chronic Inflammatory Rheumatic Disease (CIRD) (n = 1 study, 269 participants)61, Inflammatory Bowel Diseases (IBD) (n = 1 study, 18 participants)57, Primary Sjogren’s Syndrome (PSS) (n = 1 study, 18 participants)57, Huntington’s Disease (HD) (n = 1 study, 13 participants)57, Systemic Lupus Erythematosus (SLE) (n = 1 study, 16 participants)57, Pulmonary Sarcoidosis (n = 1 study, 15 participants)58,62.
Digital biomarkers consistently measured across studies included physical activity (PA), defined by time spent in various activity levels: vigorous physical activity (VPA), moderate physical activity (MPA), moderate-to-vigorous activity (MVPA), light physical activity (LPA), no physical activity (NPA), and sedentary activity (SA), based on pre-defined thresholds. Step count was the most reported measure (n = 9 studies), followed by time spent in MVPA, LPA, VPA, and MPA (n = 6 studies). For physiological measures, heart rate variability (HRV) and heart rate, typically derived from ECG or PPG sensors, were used in most studies (n = 8 studies). Sleep metrics, including total sleep time and Wake After Sleep Onset (WASO), were less commonly assessed (n = 3 studies), WASO, etc were measured in few studies (n = 3 studies).
Fourteen different fatigue scales were used in the included studies. The most common questionnaire used was the Fatigue Severity Scale (FSS), included in 13 studies16,18,22,24,25,27,28,30,31,37,39,40,60,63, followed by the Modified Fatigue Impact Scale (MFIS) (n = 6 studies)23,29,33,34,35,64 and Functional Assessment of Chronic Illness Therapy – Fatigue FACIT-F (n = 6 studies)43,44,45,47,53,61.
Torchio et al. found a significant negative correlation between time spent in MVPA and fatigue severity in 34 MS patients (r = −0.62, p < 0.001)16, while Blikman et al. observed that higher fatigue was linked to lower daily activity counts where fatigued MS patients had a higher percentage of their time sedentary and also spent less time in MVPA periods17. Other studies, such as that reported by Motl et al. identified a moderately predictive negative predictive relationship with physical activity, expressed as total movement counts, and fatigue18. Similarly, Grover et al. demonstrated a negative correlation between minutes spent in LPA and total fatigue. Moebus et al. reported using generalized additive models that increased heart rate and daily step counts related to fatigue in MS patients with a dysfunctional autonomic nervous system20. Gashi et al. confirmed significant correlations between step counts, HR, HRV, and fatigue scores21, while Jones et al. showed a link between fatigue symptoms and lower time spent in MVPA and daily steps22. Studies by Kratz et al., Eldemir et al., and Cederberg et al. also confirmed similar patterns of reduced activity in terms of activity counts per minute with higher fatigue23,24,25. Luostarinen et al. emphasized correlations between fatigue and physical activity metrics like steps per day and time spent in light to very vigorous activity42. Finally, Block et al. and Shema-Shiratzky et al. added further evidence on how physical activity metrics like daily step counts and time spent sedentary and fatigue are inversely related in MS patients29,30.
Hamy et al. found that RA patients with higher fatigue scores performed worse on functional tests, specifically taking longer to complete sit-to-stand time (the time to complete a set of 5 sit-to-stand transitions), with a significant correlation between sit-to-stand time and fatigue (p = 0.009)53. O’Brien et al. demonstrated that increased fatigue in RA patients was linked to more time spent sedentary and less time spent standing over six months54. Similarly, O’Leary et al. found a significant correlation between total time spent standing and fatigue in 76 RA patients55. Additionally, Armbrust et al. reported a negative correlation between fatigue and physical activity levels in the form of activity-related energy expenditure in children with juvenile idiopathic arthritis, with lower physical activity levels predicting higher fatigue (r = −0.30, p < 0.01)56.
Blondeel et al. reported that higher fatigue was significantly correlated with reduced levels of physical activity (amount and intensity), with average steps per day (as a measure of amount of PA) and average movement intensity during walking (as a measure of intensity of PA) (r = −0.21, p < 0.05)50.
Burton et al. found a weak correlation between time spent in physical activity measures such as LPA, MVPA, and VPA tracked by accelerometry, and fatigue in 82 long COVID patients, particularly in the afternoon and evening (−0.11 mean correlation)46. Haischer et al. observed that in 41 COVID-19 survivors, greater self-reported fatigue was significantly linked to less time in MVPA and fewer daily steps47.
Martin et al. found that in 87 cancer survivors, the fatigued group in the study, dichotomized based on a validated fatigue score cut-off point had a poorer sleep quality assessed by the amount of movement during the sleep period (mean sleep actigraphy and index of activity during sleep) compared to the non-fatigued group43. Sada et al. revealed that fatigued cancer survivors spent more time sitting or lying down, exhibited 52.2% less light activity and MVPA, and showed a significant positive correlation between fatigue scores and daily step count44. Vallance et al. demonstrated that, in 1049 breast cancer patients, more daily time spent in MVPA were linked to less fatigue, while more sedentary hours were associated with higher fatigue across multiple percentiles of fatigue scores45.
Vergauwen et al. found that CFS patients had significantly lower activity counts on weekdays compared to healthy controls, as revealed by a Mann–Whitney U test involving 66 CFS patients and 20 healthy controls51. Similarly, Evering et al. demonstrated that individuals with CFS were less physically active in the afternoon and evening, engaged in fewer high-intensity activities, and displayed more variability in their activity patterns expressed as mean acceleration per minute during the afternoon52.
Cho et al. found a significant negative correlation between fatigue scores and both time spent upright per day and time spent standing per day in a study involving 15 patients with pulmonary sarcoidosis62.
Pilotto et al. conducted a study of 42 Parkinson’s patients (21 with fatigue and 21 without), where unsupervised gait analysis using a MOVE IV device revealed that those with fatigue had significantly higher step time (p = 0.005) and step time asymmetry (p = 0.01) compared to those without fatigue, particularly during longer walking bouts59.
Antikainen et al. found statistically significant correlations between HRV measures (e.g., Beat to Beat interval (RR mean), Beat to Beat interval (RR max)) and both physical and mental fatigue in 46 participants with IBD, PSS and SLE57.
Rao et al. used machine learning models on Fitbit data from 269 participants with CIRDs, predicting physical and mental fatigue with moderate accuracy, with physical activity and resting heart rate being key predictors61.
Sanchez-Sanchez et al. conducted a study with 57 participants, finding a small but statistically significant negative correlation between fatigue scores and the percentage of time spent in LPA, based on accelerometry data collected over seven days60.
Among the digital biomarkers evaluated, physical activity metrics—including daily step count and moderate-to-vigorous physical activity (MVPA)—emerged as the most robust and consistently associated with patient-reported fatigue. These associations were observed across multiple chronic conditions, such as multiple sclerosis (MS), rheumatoid arthritis (RA), COPD, long COVID, and cancer, and were supported by several high-quality studies, resulting in high certainty of evidence (see Supplementary Table 3 for details).
Sedentary time also demonstrated a consistent positive association with fatigue across high-quality studies, achieving high certainty of evidence. Autonomic measures, particularly HRV, showed consistent negative associations with fatigue across multiple conditions, achieving high evidence certainty. In contrast, sleep-related measures and gait parameters were investigated in fewer studies and exhibited greater variability in both results and methodological quality. Sleep measures achieved low certainty of evidence due to inconsistent findings across only two studies, while gait parameters also received low certainty ratings as they were evaluated in only one study in Parkinson’s disease (Fig. 2).