

Comment: Is the economy turning? Admittedly it’s a low bar given the second quarter GDP shocker. But growth appears to be resuming, in a slow and messy fashion. We’re frequently queried: “Ok, but where?”
With that question in mind, we’ve put together the chart pack below, trying to spotlight some of the signs of life in the economy. By design it doesn’t cover everything, most obviously the well-known headwinds and weak spots.
We’ve also focused on the ‘hard’ data. Current readings and outcomes rather than surveys, expectations, and drivers of future growth.
Overall, there’s enough momentum to keep expectations of recovery on the board. Particularly with the Reserve Bank’s recent change in stance in the background.
But the numbers are still far from leaping off the page – we found the exercise a tad disappointing on the whole.
The growth that is turning up is quite often from a low base and fragile in nature (with a giant exception for primary exports!).
Symptomatic of this, we’ve tempered our near-term growth and employment forecasts. We now see third quarter GDP at +0.5 percent quarter on quarter, from 0.7 percent previously.
Chart 1: Home-grown advantage
Any discussion of economic supports has to start with primary export returns. They’re booming. Agricultural export values in the year to August are tracking $7.5b ahead of last year, at a record $53b.
Not every sector is feeling it. The wine industry, for example, still faces difficult conditions. But the heavyweights – meat, dairy, and horticulture – continue to turn in some big numbers.

Start your day informed. Make room for newsroom’s top stories. Direct to your inbox daily.
Dairy exports alone are $4.2b ahead of last year, while kiwifruit and apple exports have experienced the largest annual increases (up 44 percent and 26 percent respectively).
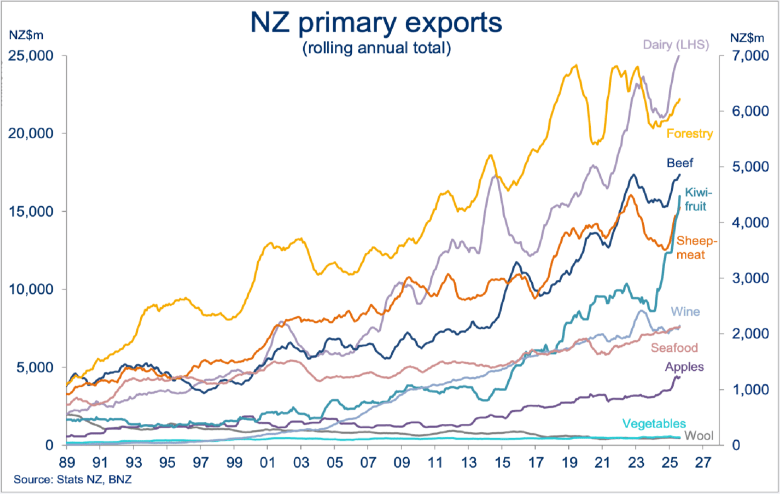
Chart 2: More signs of agri-cash being spent
There have also been some signs that, instead of being parked at the bank, a larger proportion of this export revenue is being spent and invested.
Bank lending to the agricultural sector started creeping higher again in May and has continued to grow in recent months. That’s a shift from the prior trend of debt repayment, in aggregate. Strong growth in deposits also appears to have halted.
This fits with some of the farm spending indicators we monitor (e.g. tractor regos, fertiliser imports, farm building consents) starting to show some growth, from a low base.
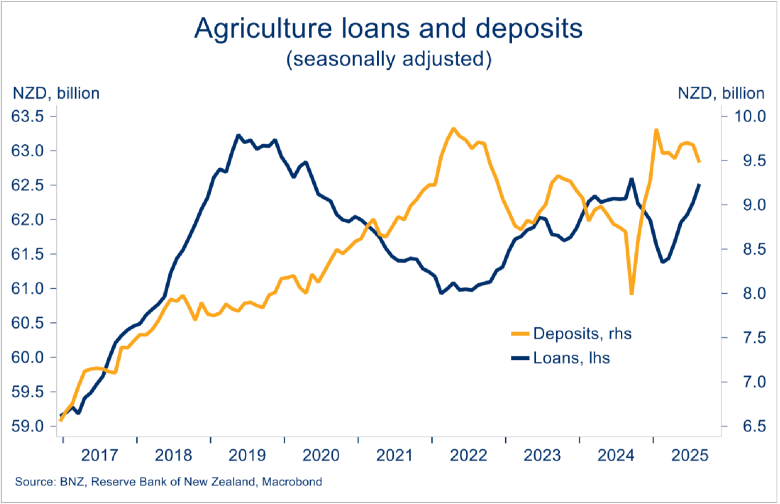
Chart 3: Savers strain, economy gains?
It’s not just the agricultural sector growing colder on term deposits (TDs). Growth in the $144b stock of household TDs is rapidly slowing as interest rates come down.
This trend has further to go based on the Reserve Bank’s 50bp cut to the cash rate last week, and our expectation of a final 25bp cut in November.
It’s a bitter pill for savers, but also a sign easier monetary policy is working: stimulating activity by incentivising investment in higher growth assets.
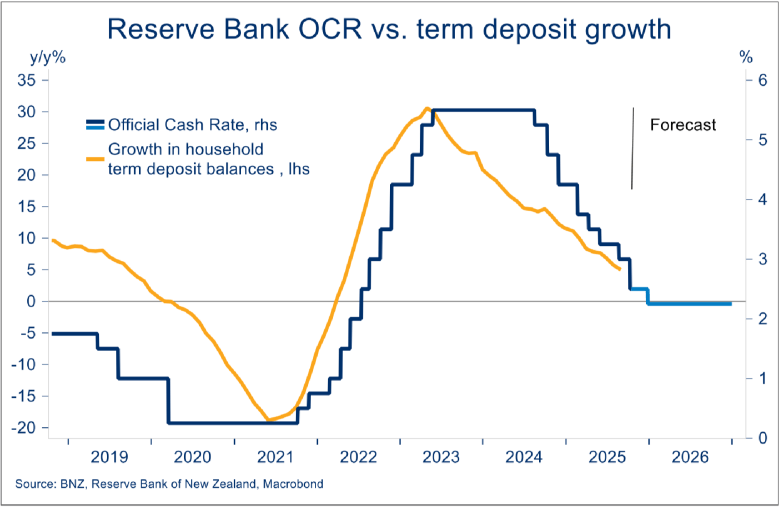
Chart 4: Property sales return to average
Lower interest rates have also helped thaw out parts of the property market.
There’s still no movement in house prices. Tuesday’s REINZ update put the (seasonally adjusted) September House Price Index up 0.2 percent on a year ago, 0.0 percent on a month ago, and at the same level as mid-2023.
But sales activity – in both residential and, more recently, rural markets –has been trending higher and is now about average. Sales have come off the boil a little since May though. That’s worth keeping an eye on.
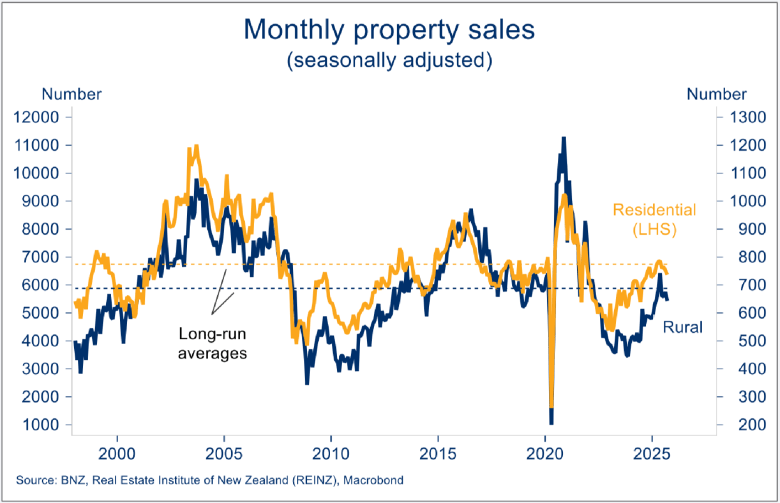
Chart 5: Signs of life in consents
We’ve seen more evidence the downturn in residential construction activity has run its course. Residential building consents rose 6 percent month on month in August, on top of a similar gain the previous month.
You wouldn’t want to hang your hat on the trend continuing, given the month-to-month volatility in the series. But the read-across to residential building activity is supportive of the small third quarter expansion we’ve pencilled in (see our recent note here).
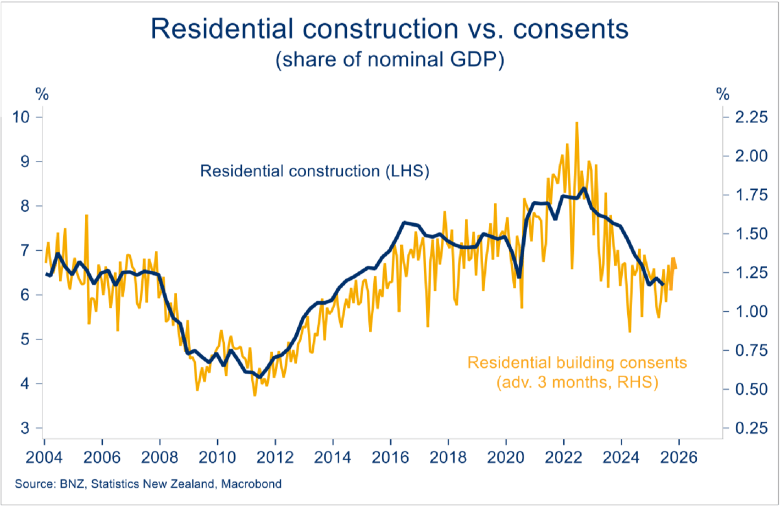
Chart 6: Firms tooling up?
Imports of investment and intermediate goods continue to wobble around a tentative uptrend, boosting hopes business investment might be finding its feet in tandem with building investment (as above).
On a (smoothed) annual basis, imports of intermediate goods are up 7 percent on last year, plant & machinery imports are up 12 percent, while car imports are rising at an annual pace of 15 percent.
The latter has been mirrored in a jump in new car registrations. As at August, they’re up 20 percent on the same month last year.
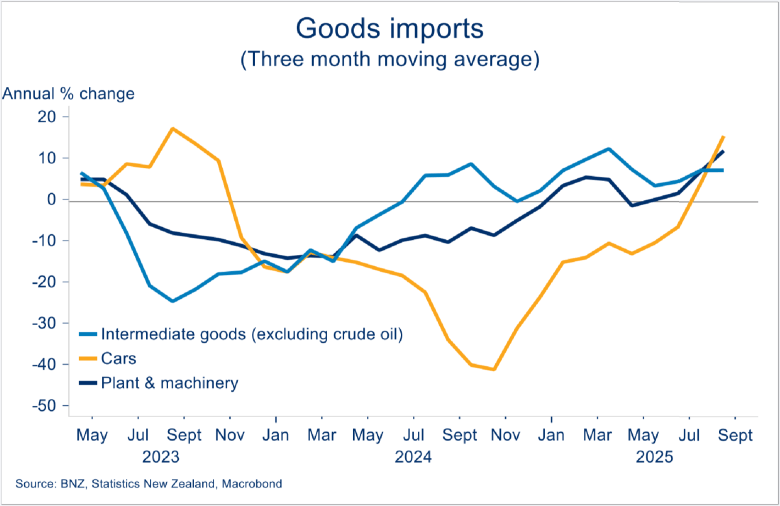
Chart 7: Jobs market stabilising
You might need to zoom in to see it, but job ads are showing signs of shaking off the sideways trend.
There have been reasonable (seasonally adjusted) increases in consecutive months (July and August). Combined, the gains put the SEEK job ads index 8 percent above the multi-year lows it had been hovering around for some time. An MBIE index of the same (data to September) is now 12 percent above the lows.
Bear in mind the levels are still almost 50 percent below the 2022 peak. But it is a sign the worst for employment may be behind us. A few more months of gains would convince us the trend has turned.
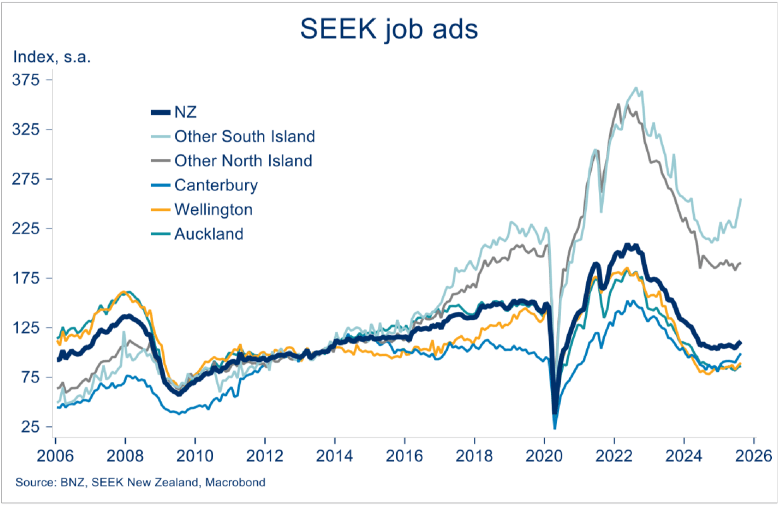
Chart 8: A better summer for tourism?
International tourist arrivals appear to have swung back up over the past three months. That’s after spending the previous 12 or so months stuck at about 85 percent of pre-Covid (2019) levels.
August’s push to 92 percent of 2019 levels was driven by a notable increase in arrivals from Asia, including China.
If this reflects increased international flight capacity then the prospects for it continuing look good. The Board of Airline Representatives expect international services over the six months to March 2026 to rise 8 percent on the same period last year, eclipsing pre-Covid levels for the first time.
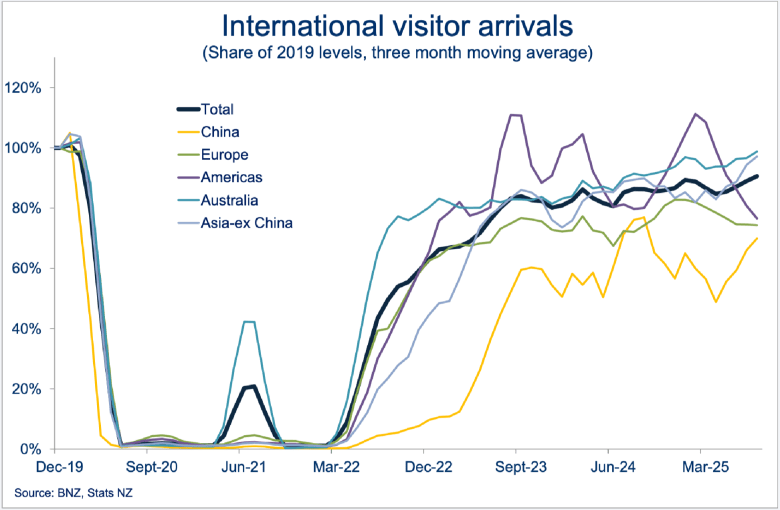
Chart 9: Below the line still, but less so
The Performance of Manufacturing and services (PMI) indices are surveys, so not technically the ‘hard’ data we’re following here. But they do capture current activity on shop floors, rather than future expectations.
You can file the past three months under the category of improving but at a disappointing pace. Both indices are still south of the 50.0 expansion level (albeit a close 49.9 for the PMI).
At 48.6, the third quarter average of the combined ‘composite’ index is better than Q2’s 46.8. So, it’s going in the right direction by not by enough to prevent a trimming of our growth expectations.
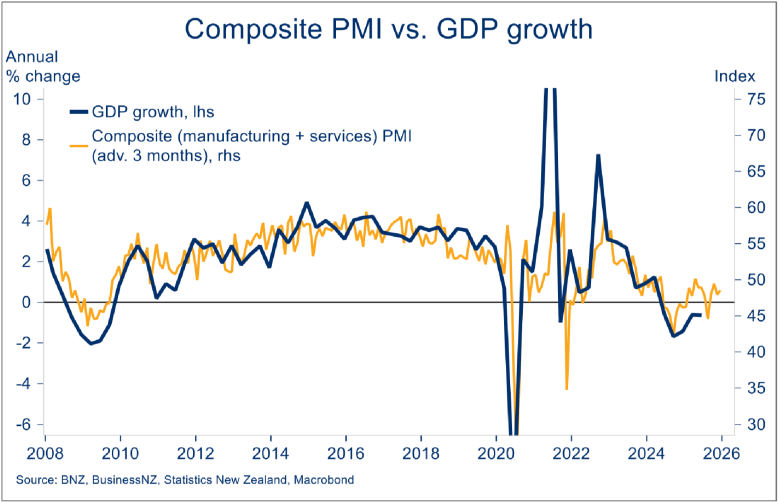
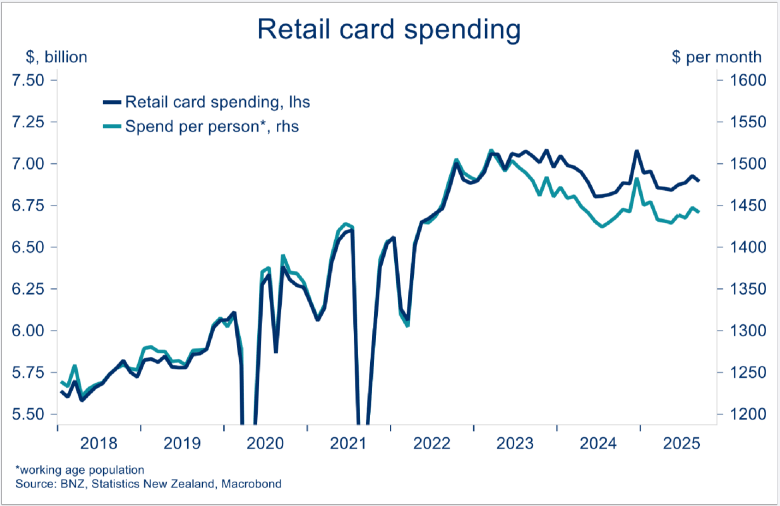
Chart 10: Card spending still struggling for momentum
Retail is another area of the economy in a ‘two steps forward, one step back’ sort of pattern.
Retail card spending declined 0.5 percent m/m (s.a) in September, when we thought it might have built on the small gains through the winter. And bear in mind we’re talking spending values, which includes price increases. The average per-person monthly spend is still 4.9 percent below the peak of March 2023.
Still, over the third quarter as a whole, spending rose 0.7 percent quarter on quarter. So, spending is still sluggish, reflective of the many headwinds facing consumers. But it’s still consistent with the idea the economy is clambering out of its mid-year pothole.
Disclaimer: This publication has been produced by Bank of New Zealand (BNZ). This publication accurately reflects the personal views of the author about the subject matters discussed, and is based upon sources reasonably believed to be reliable and accurate. The views of the author do not necessarily reflect the views of BNZ. No part of the compensation of the author was, is, or will be, directly or indirectly, related to any specific recommendations or views expressed. The information in this publication is solely for information purposes and is not intended to be financial advice. If you need help, please contact BNZ or your financial adviser. Any statements as to past performance do not represent future performance, and no statements as to future matters are guaranteed to be accurate or reliable. To the maximum extent permissible by law, neither BNZ nor any person involved in this publication accepts any liability for any loss or damage whatsoever which may directly or indirectly result from any, opinion, information, representation or omission, whether negligent or otherwise, contained in this publication.