
Mosquito sampling, Wolbachia detection and Illumina sequencing output
Mosquito collections were conducted twice over a two-year interval (2019 and 2021). We sampled 183 female adult Ae. aegypti in five areas of Rio de Janeiro, Brazil (Fig. 1). wMel releases have been conducted in three of these areas at different time periods, resulting in distinct invasion patterns (full vs. partial invasion). Female mosquitoes with Wolbachia were identified through conventional PCR. The Wolbachia Full Invasion (FI) area is an isolated neighborhood with low human density in Rio de Janeiro, where wMel releases occurred in 2015, and wMel frequency is nearly 100%18. In 2019, all 20 mosquitoes sampled were infected with wMel, as well as 22 of 23 samples collected in 2021. The Wolbachia Partial Invasion (PI1 and PI2) areas are highly urbanized and located in Rio de Janeiro and Niterói (13 Km away from Rio), respectively, where Wolbachia deployments occurred in 2019 and the wMel frequency was ~40–60%, based on previous data19,20. In these areas, mosquitoes were first collected 6 months after the releases (PI1), when 6 of 19 mosquitoes (31.6%) were infected with wMel, or at the exact moment of releases (PI2), when 13 of 25 (52%) collected samples were infected with Wolbachia. Two years later, however, only 2 of 22 mosquitoes (10%) collected were wMel-infected in PI1 and no mosquito with Wolbachia was found in PI2 (0/20). All mosquitoes collected in areas distant from Wolbachia releases were not infected with wMel (NR1: 0/36; NR2: 0/18; Fig. 1; Supplementary Data 1).
Fig. 1: Study areas in Rio de Janeiro.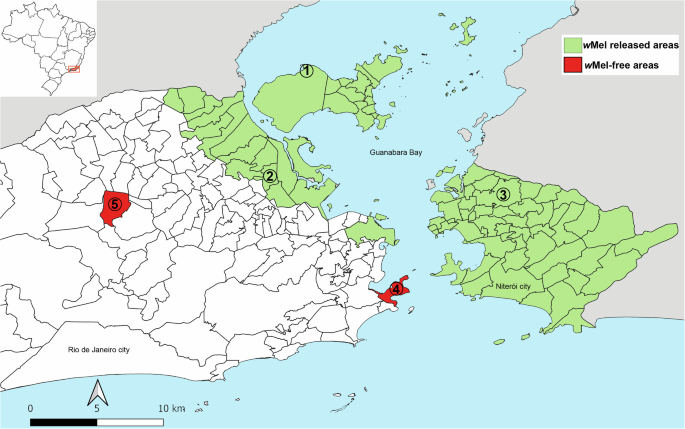
1—FI (Tubiacanga); 2—PI1 (Bonsucesso); 3—PI2 (Fonseca); 4—NR1 (Urca); 5—NR2 (Vila Valqueire). In green, wMel current released areas and in red wMel-free areas.
Amplicon sequencing of the V3-V4 hypervariable region of the 16S rRNA gene through Illumina Miseq generated 14,888,212 prefiltered reads from the 183 female adult midgut samples dissected in this study, with an average of 77,542 reads per sample. Given that the reverse sequences presented low quality scores (Phred < 25), we chose a single-end approach using only the forward sequences which contained a 200-bp fragment corresponding to the entire V3 region and a 5’ fragment of the V4 region. After quality filtering and denoising steps, we obtained 11,209,877 reads and 3977 amplicon sequence variants (ASVs). The decontamination step based on negative samples (one pool of DNA extraction samples with the reagents only and one pool of PCR negative controls) revealed that 0.51% of reads were contaminants (55,953 reads; Supplementary Data 2), which were excluded from the analyses, ensuring 10,989,036 true reads. The final dataset contained 183 samples, with a mean number of reads per sample of 58,708 (CI: 25,337–152,910) and 3933 ASVs, with a mean of 96.43 ASVs per sample (CI: 92.02–138.23). Rarefaction curve analysis indicated that our sequencing depth was sufficient to observe all ASVs in mosquito samples. Interestingly, we could observe in rarefaction curves that FI presented the smallest observed ASVs, followed by PI2 and PI1, and NR1 and NR2 had the highest numbers of ASVs (Supplementary Fig. 1), indicating that mosquitoes with wMel had lower ASVs than wild mosquitoes. The rarefaction threshold was established as 8878 sequences per sample.
wMel + Ae. aegypti have lower alpha diversity levels than wMel- mosquitoes
The alpha diversity values were compared based on the presence/absence of wMel strain, sample localities, collection year, and visual presence of blood in the midgut. When grouped according to the presence/absence of the wMel strain, the wMel+ group presented 679 ASVs when including wMel ASVs, and 673 when excluding wMel ASVs, while the wMel- group had 3053 ASVs. All alpha diversity indexes (Chao1, Shannon, and Pielou) were higher for the wMel- group when compared to the wMel+ group including Wolbachia ASVs (Fig. 2A–C; Chao1: Wilcoxon–Mann–Whitney: W = 2144, p < 0.001; Shannon: W = 1272, p < 0.001; Pielou: W = 5797, p < 0.001; Supplementary Data 3). Excluding Wolbachia ASVs from the analysis, similar results were observed for both Chao1 (W = 5290, p < 0.001) and Shannon (W = 4895, p < 0.001) indexes (Supplementary Fig. 2A, B). However, in this case, the Pielou index of the wMel- group was significantly lower than the wMel+ counterparts (W = 2962, p = 0.0246; Supplementary Fig. 2C; Supplementary Data 3). When analyzing sampling areas separately, there was no difference in alpha diversity between wMel- and wMel+ individuals in PI1, including or not Wolbachia ASVs (Fig. 2D–F; Supplementary Fig. 2D–F; Supplementary Data 3). In contrast, for PI2 when including Wolbachia ASVs, all alpha diversity indices were higher in wMel- (Chao1: W = 302, p value = 0.0192; Shannon: W = 352, p value < 0.001); Pielou’s Evenness: W = 276, p value = 0.032; Fig. 2G–I; Supplementary Data 3), but the same was not observed for PI2 when excluding Wolbachia ASVs, where wMel- individuals had higher alpha diversity Chao1 (W = 304, p = 0.0167) and Shannon (W = 299, p = 0.0234) indexes, but not the Pielou’s Evenness (W = 211, p = 0.686; Supplementary Fig. 2G–I; Supplementary Data 3).
Fig. 2: Boxplots of the alpha diversity values obtained from the Ae. aegypti midgut microbiota data, including Wolbachia ASVs, according to wMel presence (blue) or absence (pink) and partial invasion status PI1 (gray) and PI2 (orange).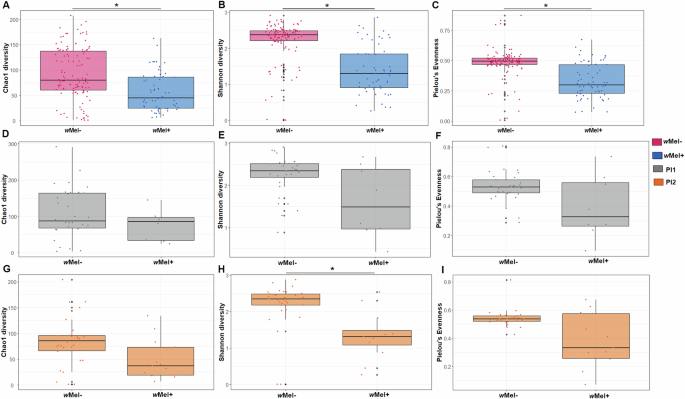
A Chao1 (Wilcoxon–Mann–Whitney: W = 2144, p value < 0.001); B Shannon (Wilcoxon–Mann–Whitney: W = 1272, p value < 0.001); C Pielou evenness (Wilcoxon–Mann–Whitney: W = 5797, p value < 0.001); D Chao1 in PI1 (Wilcoxon–Mann–Whitney: W = 161, p value = 0.348); E Shannon in PI1 (Wilcoxon–Mann–Whitney: W = 187, p value = 0.0726); F Pielou evenness in PI1 (Wilcoxon–Mann–Whitney: W = 183, p value = 0.0972); G Chao1 in PI2 (Wilcoxon–Mann–Whitney: W = 302, p value = 0.0192); H Shannon in PI2 (Wilcoxon–Mann–Whitney: W = 352, p value < 0.001); I Pielou evenness in PI2 (Wilcoxon–Mann–Whitney: W = 276, p value < 0.001). Black lines indicate the medians.
Considering the wMel+ mosquitoes, the Wolbachia invasion status in the field (full or partial invasion) did not influence the alpha diversity indexes, including or not Wolbachia ASVs (Kruskal–Wallis: Chao1: H = 2.78 and 2.43, p = 0.249 and 0.293, respectively; Shannon: H = 1.78 and 3.3, p = 0.915 and 0.192, respectively; Pielou’s Evenness H = 1.14 and 1.68, p = 0.566 and 0.432, respectively; Supplementary Fig. 3; Supplementary Data 3). Also, the alpha diversity of wMel- mosquitoes from PI areas did not differ significantly from those collected in areas where Wolbachia was not released when considering Chao1 (Kruskal–Wallis: Chao1: H = 6.34, p = 0.0962) and Pielou’s index (Pielou’s Evenness: H = 2.34, p = 0.505; Supplementary Fig. 4; Supplementary Data 3). However, a significant difference was observed for the Shannon index (Shannon: H = 6.27, p = 0.0123; see Supplementary Data 3 for more details). Post hoc Dunn’s tests revealed a marginally significant difference only between PI1 and NR1 (Dunn’s test: adjusted p value = 0.050), with no other significant pairwise comparisons (Dunn’s test: adjusted p value ≥ 0.32; Supplementary Fig. 4; Supplementary Data 3). The microbiota alpha diversity did not vary significantly considering either the collection year (Chao1: W = 4290, p = 0.772; Shannon: W = 3823, p = 0.313, Pielou’s Evenness: W = 3225, p = 0.136 including Wolbachia ASVs and Chao1: W = 4270, p = 0.815; Shannon: W = 4283, p = 0.785, Pielou’s Evenness: W = 4036, p = 0.868 excluding Wolbachia ASVs) or blood ingestion (Chao1: W = 3601, p = 0.188; Shannon: W = 3838, p = 0.519, Pielou’s Evenness: W = 3954, p = 0.99 and Chao1: W = 3608, p = 0.195; Shannon: W = 3549, p = 0.144, Pielou’s Evenness: W = 3704, p = 0.463 not including Wolbachia ASVs).
Midgut microbiota composition differed between wMel+ and wMel- mosquitoes
The composition of the microbiota community was also compared between wMel+ and wMel- Ae. aegypti, between samples collected in different localities, periods, and samples visually fed on blood or not. A significant difference in the midgut microbiota composition was observed for wMel+ and wMel- mosquitoes, considering or not Wolbachia ASVs in the analyses (Bray–Curtis PERMANOVA: F = 12.2 and 6.9, respectively, and p = 0.001 for both tests; Fig. 3A, Supplementary Fig. 5 and Supplementary Data 4), which suggests a bacterial signature profile for each group. Regarding only wMel+ mosquitoes, the microbiota composition of FI mosquitoes was different from PI mosquitoes, considering or not Wolbachia ASVs in the analyses (Bray–Curtis PERMANOVA: F = 3.4 and 3.7, respectively, and p = 0.001 for both tests), with the latter group being more dispersed in the PCoA plot, mainly driven by PI2 samples (Supplementary Fig. 6A). The microbiota composition did not differ significantly with respect to blood ingestion, whether wMel was considered or not (Bray–Curtis PERMANOVA F = 1.2, p = 0.177), but it was significantly different between samples collected in different years (2019 and 2021) (F = 2.3, p = 0.014), which may be explained by the low number of wMel+ mosquitoes from PI1 (2/42) and PI2 (0/42) in 2021. In fact, excluding 2019 and 2021 PI1 and PI2 samples, we no longer observed any significant differences between the collection years (Chao1: W = 1109.5, p = 0.649; Shannon: W = 937, p = 0.088; Pielou: W = 951, p = 0.109; Bray–Curtis PERMANOVA F = 1.25, p = 0.173 including wMel ASVs; Chao1: W = 1106.5, p = 0.633; Shannon: W = 1055, p = 0.395; Pielou: W = 1120, p = 0.704; Bray–Curtis PERMANOVA F = 1.28, p = 0.178 excluding wMel ASVs; Supplementary Fig. 7, Supplementary Data 4). The microbiota composition of wMel- samples collected in different locations (PI1, PI2, NR1, and NR2) was significantly different (Bray–Curtis PERMANOVA F = 1.3, p = 0.03). PCoA, however, captured homogeneous groups regardless of collection dates or locations of wMel- (i.e., with the majority of samples clustering together), evidencing high beta diversity similarity between the groups (Supplementary Data 4, Supplementary Figs. 6B and 8).
Fig. 3: Beta diversity analysis of Ae. aegypti midgut microbiota data.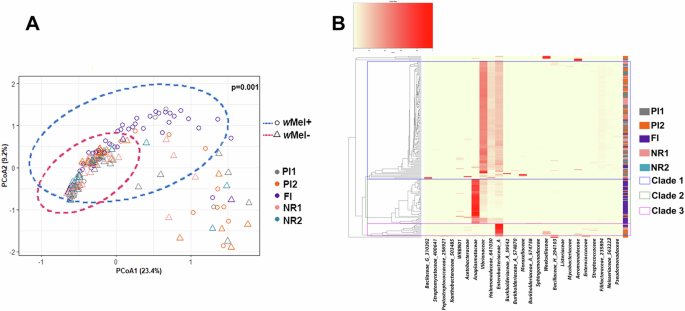
A Principal component analysis (PCoA) of the midgut microbiota of wMel+ (circles and blue ellipse) and wMel- (triangles and pink ellipse) Ae. aegypti based on the Bray–Curtis dissimilarity matrix. The variation explained by each PCoA axis is shown in parentheses. The ellipses represent the distribution of sample groups in the two-dimensional space, and it is based on a covariance matrix of PCoA (PCoA1 and PCoA2) in each group. B Heatmap with dendrogram showing bacterial microbiota composition, where each ASV is annotated. Only ASVs >1% frequency in the microbiomes are shown. The 25 most abundant ASVs were used in hierarchical clustering to evaluate the relationships among 183 samples using weighted pair clustering based on Bray–Curtis measurements. The darker the red color, the more predominant the ASV was in each sample. The horizontal cladogram shows the relationships among the 25 most abundant families. The vertical cladogram shows the relationships among the 183 samples from FI (Tubiacanga, in purple); PI1 (Bonsucesso, in gray); PI2 (Fonseca, in orange); NR1 (Urca, in pink); NR2 (Vila Valqueire, in blue). Clade 1 (in blue) shows the samples with a higher abundance of Vibrionaceae, Halomonadaceae (641030), and Enterobacteriaceae (A) than Anaplasmataceae (Wolbachia’s family) families. Clade 2 (in green) shows the sample with a higher abundance of Anaplasmataceae than Vibrionaceae, Halomonadaceae (641030) and Enterobacteriaceae families. Clade 3 (in pink) shows the samples with a higher abundance of Enterobacteriaceae (A) than the other families.
Clustering of the samples using a Bray–Curtis dissimilarity matrix based on the abundance of the 25 most abundant ASVs revealed three main clades (Fig. 3B). Clade 1 was mainly composed of samples from the wMel- group, which had higher abundances of Vibrionaceae, Halomonadaceae (641030), and Enterobacteriaceae (A). Clade 2 was composed of samples from the wMel+ group, which had higher abundance of Anaplasmataceae. Clade 3 grouped both wMel+ and wMel- samples with high abundance of Enterobacteriaceae (A) (Fig. 3B). It is worth mentioning that wMel+ samples with high abundance of Enterobacteriaceae (A) showed less abundant Wolbachia reads (Anaplasmataceae). Regarding the collection areas, NR2 samples were present only in clade 1. Most of the samples of FI were in clade 2, and clade 3 was composed by samples of partial invasion areas (PI1, PI2) and an area of no Wolbachia releases (NR1).
The composition and abundance of bacterial taxa changes in the midgut microbiota when wMel is present
The relative abundance of the top 10 bacterial taxa were plotted in stacked barplots to observe the composition of the midgut microbiota at the phylum, family, and genus levels. The top 10 most abundant phyla, families, and genera comprised >99%, 83.8%, and 89.2% of the sequences, respectively. Pseudomonadota was the predominant phylum in the microbiota of wMel+ (including or not Wolbachia ASVs) and wMel- Ae. aegypti, with a mean relative abundance of ~85%, followed by Bacteroidota (considering wMel+ group) or Firmicutes (for wMel- group; Fig. 4A). Anaplasmataceae, Enterobacteriaceae (A) and Vibrionaceae were the most abundant families in wMel+, while Vibrionaceae, Enterobacteriaceae (A) and Halomonadaceae (641030) were the most abundant families in wMel- (Fig. 4B). When the dataset was split according to the different localities and presence/absence of Wolbachia, Acetobacteraceae, Moraxellaceae and Xanthomonadaceae (616009) were present in the top 10 most abundant families exclusively in wMel- mosquitoes. In contrast, Streptococcaceae and Weeksellaceae were more predominant in wMel+, showing a higher relative abundance in this group (Supplementary Fig. 9A, B). At the genus level, Wolbachia, Vibrio (678715) and Elizabethkingia had the highest relative abundance in the wMel+ microbiota, contributing approximately 52%, 14.5%, and 8%, respectively (Fig. 4C). The relative abundance of Wolbachia reads in samples collected at FI and PI areas was not significantly different (Kruskal–Wallis: H = 1, p = 0.31; Supplementary Fig. 9A). Analyzing the bacterial composition of wMel+ group when Wolbachia ASVs are excluded from the analysis, at the phylum and family level the relative abundance of Bacteroidota and Firmicutes, Enterobacteriaceae (A), Halomonadaceae (641030), Vibrionaceae and Weeksellaceae increased when compared to the microbiota composition including wMel ASVs, respectively. Moreover, two taxa appeared abundant at the family and genus level, WRBN01 and Streptococcus, respectively (Supplementary Fig. 9B). Considering the genus level, Elizabethkingia, Halomonas (C_640989) and Vibrio (678715) had their relative abundance increased in the absence of Wolbachia ASVs (Supplementary Fig. 9B). In wMel- samples, Vibrio (678715) and Halomonas (C_640989) were the most abundant genera, contributing approximately 40% and 12.5% of the total relative abundance (Supplementary Fig. 9C). Among the wMel- localities, PI1 exhibited a higher relative abundance of Acinetobacer and Bacillus_A compared to PI2, NR1 and NR2. In contrast, the latter localities showed a higher relative abundance of Aeromonas compared to PI1 (Supplementary Fig. 9C).
Fig. 4: Relative abundance of midgut microbiota taxa in wMel+ Ae. aegypti (including and excluding wMel+ ASVs) and wMel- Ae. aegypti groups.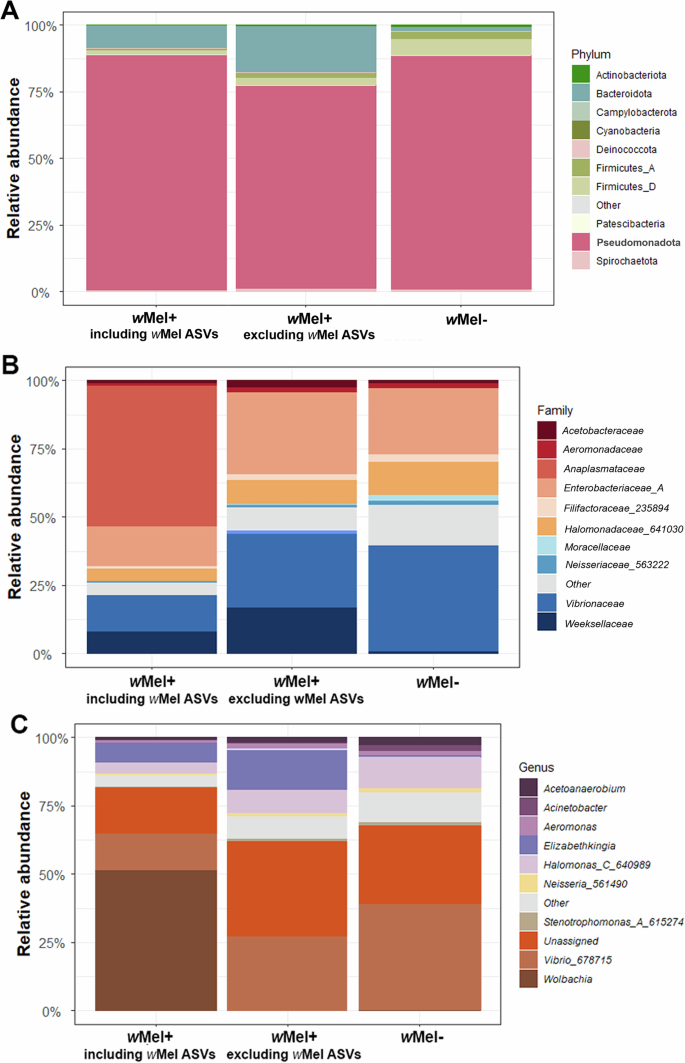
A Classification at the phylum level, B at the family level, and C at the genus level. The classifier “Other” in the legends represents bacterial taxa with <3% of abundance. The classifier “Unassigned” in the legends represents the taxa that were not classified to the genus level in the taxonomic classification.
Interestingly, when analyzing wMel+ localities regardless wMel ASVs, PI2 presented a higher relative abundance of Elizabethkingia compared to PI1 and FI, which were characterized by higher relative abundances of Vibrio (678715) and Halomonas (C_640959), respectively (Supplementary Fig. 8A, B). In localities with wMel-, we observed higher relative abundance of Acinetobacter in PI1 when compared with the other wMel- localities and a homogeneity of the relative abundance of Vibrio (678715) and Halomonas (C_640959) in all wMel- localities (Supplementary Fig. 9C).
The analysis of composition of microbiomes with bias correction (ANCOM-BC) was used to identify the differentially abundant bacteria between wMel+ and wMel- Ae. aegypti not considering wMel ASVs. The ANCOM-BC analysis between wMel+ and wMel- groups evidenced that 21 ASVs were higher and 14 ASVs were lower in wMel+ group (Fig. 5). To complement these findings, we also applied Random Forest analysis, which calculated the Gini importance of each ASV. The top ASVs contributing to the differentiation between wMel+ and wMel- groups included 30 taxa, with the first 14 showing the highest impact on overall classification accuracy. This interpretation is supported by a sharp decline in mean decrease Gini values < 2, indicating reduced discriminatory power among the remaining taxa. While not all taxa overlapped between both methods, when comparing the ANCOM-BC and the first 14 ASVs from Random Forest analyses, it is possible to observe that Halomonadaceae (Pseudomonadota phylum) was higher in wMel+ mosquitoes, while seven ASVs were lower in this group—Enterococcaceae, Filifactoraceae (235894), Xanthomonadaceae (616009), Alteromonadaceae (665222), Rhodanobacteraceae (613062), Rhodobacteraceae, and Sphingobacteriaceae.
Fig. 5: Differentially abundant taxa according to wMel presence in Ae. aegypti excluding wMel ASVs.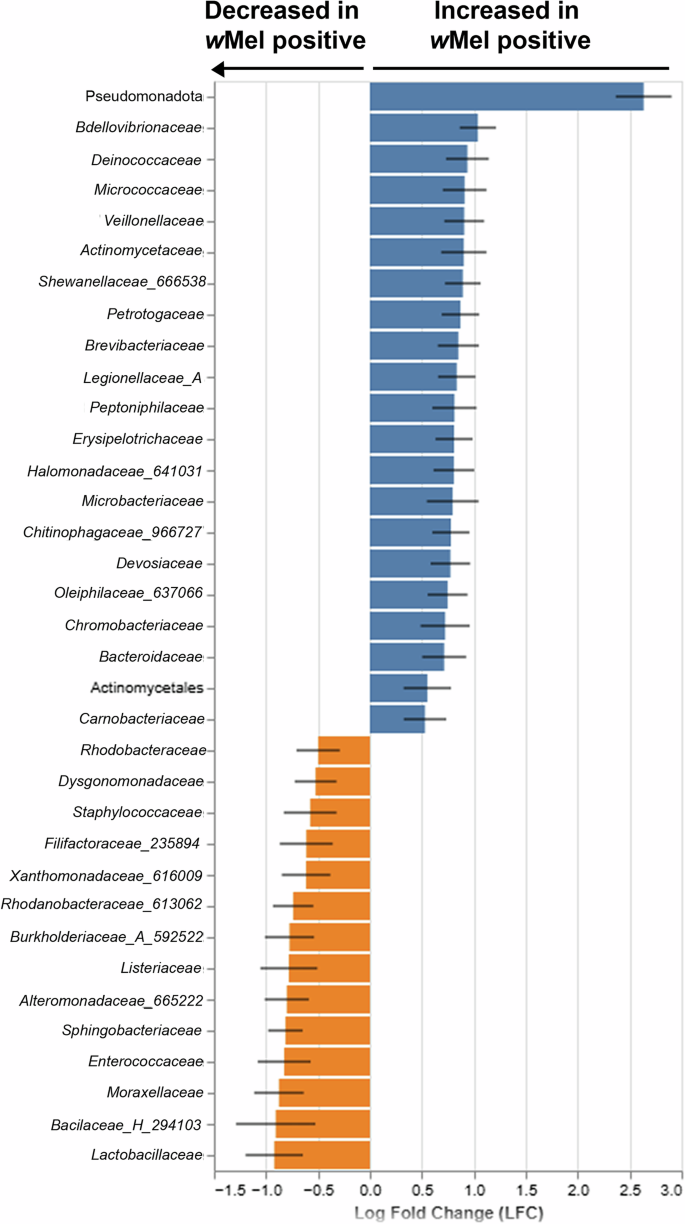
In blue the ASVs which increased in wMel presence and in orange the ASVs which were decreased in wMel presence.
The bacterial taxa present in at least 90% of midgut samples were assumed to be part of the core microbiota. In the wMel+ group, the core microbiota included Wolbachia and both wMel+ and wMel- groups had Vibrio (678715) and Enterobacteriaceae (A) (Supplementary Data 5). The core midgut microbiota of NR1 samples (all wMel-) was the most numerous in terms of ASVs (N = 14), reflecting a higher overlap in the microbiota composition between specimens (Supplementary Data 6). The second most homogenous microbiota composition was observed in FI samples (N = 8), where all mosquitoes are wMel+. Sympatric wMel- and wMel+ samples (PI1 and PI2) had different core microbiota. The core microbiota of wMel+ mosquitoes of PI1 was composed of the Aeromonas and Elizabethkingia genera, and the Enterococcaceae family, while wMel- samples had Halomonas (C640989), Acetoanaerobium, Neisseria (561490), Stenotrophomonas (A615274), and Streptococcus. Elizabethkingia was present in both PI1 and PI2 localities in wMel+ samples only. Moreover, the wMel+ samples of PI2 had Halomonas (C640989) in their core microbiota, while sympatric wMel- samples had only the core microbiota common to all groups Vibrio (678715) and Enterobacteriaceae (A).
Network analyses reveal divergent bacterial interactions within wMel+ and wMel- Ae. aegypti groups
The network analyses were used to infer possible bacterial interactions of co-occurrence and co-exclusion among the several taxa in wMel+ and wMel- Ae. aegypti midgut microbiota. The structured co-occurrence patterns are explained by Spearman’s correlations from which the networks were built. This correlation retains only taxa with consistent monotonic relationships. Therefore, networks with higher number of nodes reflect midgut samples with more homogenous microbiota composition. The networks of wMel+ and wMel- mosquitoes collected in sympatry evidenced different relationships among the microbiota (Fig. 6A, B). In the wMel- network of PI1 samples, Mycobacteriaceae was highly interconnected with other families, with 13 interactions and the highest centrality and betweenness values (Supplementary Data 7), therefore considered as a hub in this network (i.e., with more connections than other ASVs; Fig. 6A; Supplementary Data 7), but when considering the wMel+ network of the same area, Anaplasmataceae (which includes Wolbachia) was considered the hub, with seven interactions. It is worth mentioning that Vibrionaceae and Weeksellaceae were also highly connected families found in PI1 wMel+ and wMel- networks, respectively, with six and 10 interactions. Both wMel- and wMel+ networks based on PI1 samples showed Neisseriaceae (563222) as a highly connected family. Other families, however, such as Xanthomonadaceae (616009), Bacillaceae (H_294103), and Lactobacillaceae were only present in the wMel- network (Fig. 6A). These results are also evidenced by the beta diversity and ANCOM_BC analyses, in which these taxa are low abundant or even absent in wMel+ group (Figs. 5 and 6).
Fig. 6: Bacterial interaction networks of PI1 (Bonsucesso), PI2 (Fonseca), FI (Tubiacanga), NR1 (Urca), and NR2 (Vila Valqueire) areas.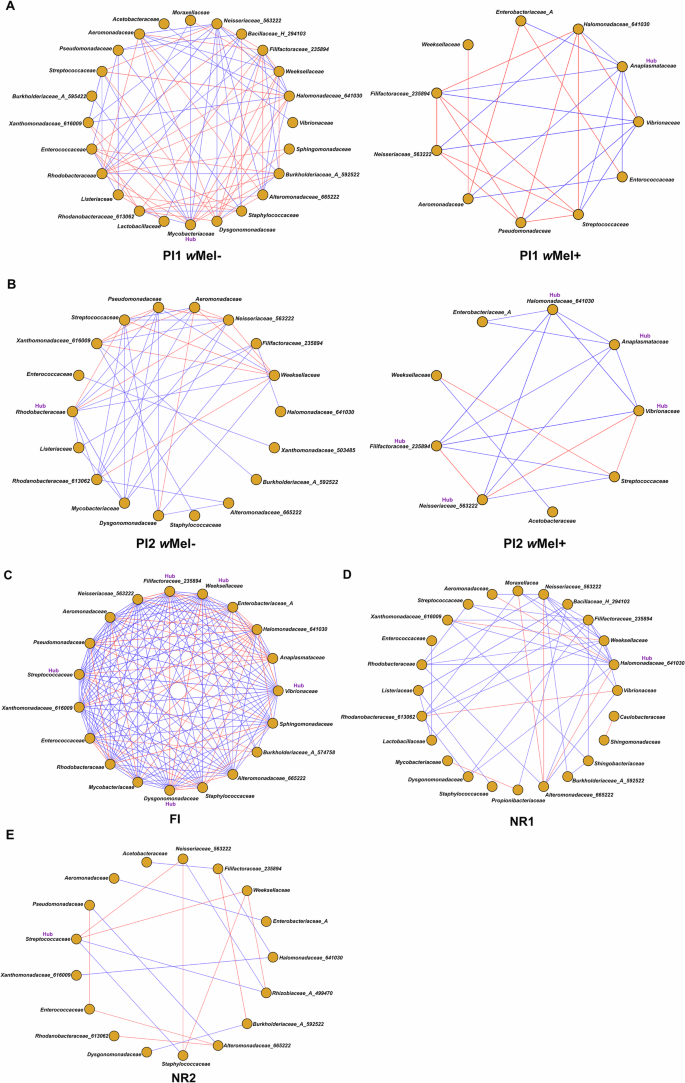
A PI1 wMel- network and PI1 wMel+ network; B PI2 wMel- network and PI2 wMel+ network; C FI wMel+ network; D NR1 wMel- network and E NR2 wMel- network. Orange nodes represent bacterial families. Red edges represent co-exclusion/negative correlation, blue edges represent co-occurrence/positive correlation interactions between relative abundance profiles. The PI1 wMel- and wMel+ networks presented one hub family each (Mycobacteriaceae and Anaplasmataceae, respectively). PI2 wMel- network presented one hub family (Rhodobacteraceae) in contrast with wMel+ network which presented five hub families (Halomonadaceae (641030), Anaplasmataceae, Vibrionaceae, Neisseriaceae (563222), Filifactoraceae (235894)). FI network showed five hub families (Filifactoraceae (235894), Weeksellaceae, Vibrionaceae, Dysgomonadaceae and Streptococcaceae). NR1 and NR2 networks presented one family hub (Halomonadaceae (641030) and Streptococcaceae, respectively).
Regarding the midgut microbiota of wMel- mosquito females collected in PI2, the network evidenced Rhodobacteraceae as a hub family and Neisseriaceae (563222) as a highly connected family (Fig. 6B; Supplementary Data 7). The network of wMel+ mosquitoes of the same area evidenced Vibrionaceae, Anaplasmataceae, Halomonadaceae (641030), Filifactoraceae (235894), and Neisseriaceae (563222) as hub families. Anaplasmataceae had five co-occurrences, four of them with the other hub families, and with Enterobacteriaceae (A), which is part of the core wMel+ and wMel- Ae. aegypti microbiota (Fig. 6B; Supplementary Data 7). In this area, Xanthomonadaceae (616009) and Xanthomonadaceae (503485) families were present just in the wMel- network.
In a high wMel introgressed scenario (FI), the number of nodes and interactions in the network was higher than in the networks of partial introgressed areas (PI1 and PI2), given the high numbers of nodes and interactions in the network and a less dispersed cluster in the PCoA plot, suggesting a more homogeneous microbiota composition (Fig. 6C; Supplementary Fig. 6A). Moreover, in FI, Vibrionaceae, Weeksellaceae, Filifactoraceae (235894), Dysgonomonadaceae, and Streptococcaceae were considered hub families (Fig. 6C; Supplementary Data 7). In this area, Anaplasmataceae (Wolbachia’s family) had 12 interactions, of which six co-occurrences (Halomonadaceae (641030), Enterobacteriaceae (A), Weeksellaceae, Neisseriaceae (533222), Rhodobacteriaceae, Vibrionaceae families), including two with hub bacterial families, and six co-exclusions (Filifactoraceae (235894), Aeromonadaceae, Pseudomonadaceae, Streptococcaceae, Xanthomonadaceae (616009), and Dysgonomonadaceae families), of which one was with a hub family (Fig. 6C). It is worth mentioning that the Neisseriaceae family appeared highly connected in FI, PI1 and PI2 wMel+ networks with other families as it was seen for the wMel- group (Fig. 6A–C; Supplementary Data 7).
In a wMel-free scenario as NR1 and NR2, the network evidenced Halomonadaceae (641030) (10 interactions) and Streptococcaceae (4 interactions) as hub families, respectively (Fig. 6D, E). NR1 network also showed Weeksellaceae, Neisseriaceae (533222), and Filifactoraceae (235894) (9, 8, and 8 interactions, respectively) as highly interconnected families (Fig. 6D). Interestingly, Rhodanobacteraceae (613062) and Burkholderiaceae (A_592522) families appeared only in wMel- Ae. aegypti networks. Dysgomonadaceae family appeared with many interactions in wMel- Ae. aegypti networks, but also in FI network.