
Ethics statement
This study complies with all relevant ethical regulations for research involving human participants and was conducted in accordance with the principles of the Declaration of Helsinki. The meta-analysis was performed using previously collected data from individual cohorts. Ethics approval and informed consent were obtained for all original studies by their respective institutional review boards or ethics committees, as detailed in Supplementary Methods 1.
Participants
Data from five international cohorts were analysed: The Australian Genetics of Depression Study (AGDS) in Australia53 (Female: cases = 10,406, controls = 7147; Male: cases = 3174, controls = 6601), The BIObanks Netherlands Internet Collaboration (BIONIC) in the Netherlands54 (Female: cases = 10,664, controls = 26,878; Male: cases = 4432, controls = 20,013), the Genetic Links to Anxiety and Depression (GLAD + ) study in the United Kingdom (UK)55 (Female: cases = 16,708, controls = 3393; Male: cases = 4656, controls = 3025), the UK Biobank from the UK56 (Female: cases = 46,194, controls = 53,211; Male: cases = 22,608, controls = 56,516) and All Of Us from the United States of America57 (Female: cases = 26,776, controls = 46,678; Male: cases = 11,136, controls = 35,836). Across all cohorts, MDD cases and controls were defined primarily based on the DSM (Diagnostic and Statistical Manual of Mental Disorders) where available, supplemented by electronic health records and/or self-report of diagnosis (Supplementary Data 1). Sex was defined by chromosomal composition, with XX individuals classified as female and XY as male. We have complied with all relevant ethical regulations and informed consent was obtained from all participants. See Supplementary Methods 1 for more details on each cohort and Supplementary Data 33 summarises how the recommended best practices for sex-aware analyses from Khramtsova et al.38 were addressed.
Genotyping, quality control and imputation
Details about genotyping platform used as well as quality control and imputation methods can be found in Supplementary Methods 1. In all cohorts, individual quality control included exclusion of participants with non-European ancestry.
Association Analyses
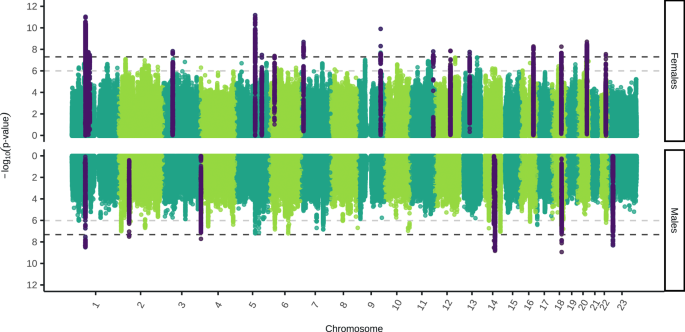
All association analyses in all cohorts were conducted using fastGWA in GCTA v1.94.158. Sex-stratified genome-wide association studies (GWAS) were carried out in each cohort on the autosomes and X chromosome using a mixed linear model for a binary outcome (–fastGWA-mlm-binary) with a sparse genetic relationship matrix and the first 10 ancestry principal components, as well as any cohort-specific covariates. Genome-wide genotype-by-sex interaction (GxS) analyses were also carried out in each cohort using a mixed linear model (–fastGWA-mlm) with a sparse genetic relationship matrix, sex as the environment variable and the first 10 ancestry principal components and any cohort-specific covariates. GxS analyses were conducted for the autosomes, as well as for the X chromosome with the non-pseudoautosomal region analysed both with no dosage compensation (–dc 0) and full dosage compensation (–dc 1). The sex-stratified GWAS and GxS results were filtered to retain SNPs with a minor allele frequency larger than 0.01 and a R2 imputation score larger than 0.6. See Supplementary Methods 1 for cohort specific details. The sex-stratified GWAS was used to characterise the SNP effect sizes and directions of effect in each sex separately. These summary statistics were also leveraged for downstream analyses, such as SNP-based heritability, genetic correlation and polygenic overlap across sexes. The GxS analysis complements the sex-stratified GWAS by formally testing whether the differences in SNP effect sizes between sexes are statistically different.
Meta-analysis
The sex-stratified GWAS and GxS results from the five cohorts were meta-analysed with summary statistics from Blokland et al.16 which resulted in a total sample size of 130,471 cases and 159,521 controls in females, and 64,805 cases and 132,185 controls in males. As the GxS association analyses in all studies used linear mixed models the beta values were converted to the logistic scale by firstly converting the beta values to odds ratios (OR) using the R function from Lloyd-Jones et al.59 and then using the log of the OR. The standard error of the log(OR) was calculated as the log(OR) divided by the Z-score. Standard error weighted meta-analyses without genomic control were run in METAL (released 05/05/2020)60. The meta-analysis results were filtered to only retain SNPs present in three or more cohorts (at least 50% of the cohorts). In order to identify lead, independent SNPs, clumping was carried out in PLINK v1.90b6.861,62 with a linkage disequilibrium threshold (–clump-r2) of 0.1 and a physical distance threshold (–clump-kb) of 1000.
Replication cohort
Generation Scotland served as a replication cohort63. Case status was determined by case classification in the Structured Clinical Interview for DSM-IV disorders (SCID)64,65 or the Composite International Diagnostic Interview (CIDI)66. Individuals also present within the UK Biobank and of non-European ancestry were removed, resulting in a sample size of 2441 cases and 3321 controls in females, and 938 cases and 2491 controls in males. Sex-stratified association analyses were run using fastGWA in GCTA v1.94.158 (–fastGWA-mlm-binary) with a sparse genetic relationship matrix and the first four ancestry principal components as covariates. We compared the beta-values from the lead independent genome-wide significant SNPs from our meta-analysis to the replication analysis. For females all 16 lead SNPs were tested and seven lead SNPs were tested in males (one SNP was unavailable in the Generation Scotland cohort). A one-sided binomial test was used to determine whether significantly more than 50% of the SNPs tested in the replication analysis (expected by chance) had a concordant effect size direction. See Supplementary Methods 1 for more details on the Generation Scotland cohort.
GxS sensitivity analyses
As interaction analyses require very high power in order to detect significant interactions, we also carried out a sensitivity analysis to determine whether any SNPs known to be associated with sex-combined MDD had a significant GxS interaction. We used the genome-wide significant SNPs from the largest MDD GWAS meta-analysis by Adams et al.27 and a P-value threshold of 7.17 × 10⁻⁵ (0.05/697 independent SNPs).
Genetic architecture of MDD in females and males
Autosomal SNP-based heritability (h2SNP), polygenicity (π) and the selection parameter (S), a measure of the relationship between effect size and minor allele frequency which indicates the direction and strength of natural selection, were estimated using our sex-stratified meta-analysis summary statistics in SBayesS using GCTB v2.5.267. The linkage disequilibrium shrunk sparse matrix of 2.8 million variants68 and four chains of length 25,000 with a burn-in of 5000 and thinning of 10 were used. H2SNP was converted to the liability scale using the method from Lee et al.69 with a population prevalence of 0.2 and 0.1 in females and males, respectively. To determine whether h2SNP, π and S are different across sexes, we calculated the posterior probability that female value > male value by counting the frequency of Markov chain Monte Carlo (MCMC) samples in which female value > male value. We conducted a range of sensitivity analyses comparing the genetic architecture of MDD in females and males (Supplementary Methods 2). This included calculating h2SNP estimates in LDSC, accounting for the differential power of our sex-stratified GWAS meta-analysis, as well as examining the role of male under-diagnosis and across-cohort heterogeneity.
Genetic correlation
Linkage Disequilibrium Score Regression (LDSC) (released 13/02/2015)70,71 with European LD scores computed from 1000 Genomes was used to estimate bivariate autosomal SNP-based genetic correlations (rg). We estimated rg between our sex-stratified summary statistics with the largest GWAS meta-analysis of sex-combined MDD (including 23andMe, Inc and Europeans only)27 and previous sex-stratified GWAS of MDD16,17. We also estimated rg between our male and female meta-analysis summary statistics. To account for across-cohort heterogeneity we also estimated rg between each pairwise combination of the two sexes by six cohorts (the five new cohorts and the existing GWAS meta-analysis from Blokland et al.16 used in our meta-analyses here).
We also investigated whether the MDD effect sizes (betas) for SNPs known to be associated with sex-combined MDD are different across the sexes. We entered all of the genome-wide significant hits associated with MDD from Adams et al.27 (Europeans only) into PLINK v1.90b6.861,62 clumping with a linkage disequilibrium threshold (–clump-r2) of 0.1 and a physical distance threshold (–clump-kb) of 1000 to identify lead, independent SNPs. For these SNPs, ensuring the minor allele was the tested allele and consistent across summary statistics, the Pearson correlation was calculated between the standardised effect size estimates (beta values) of our male and female meta-analysis summary statistics, and between each pairwise combination of the two sexes by six studies. Beta values and their standard errors were standardised accounting for the influence of allele frequency and sample size (Eqs. (1) and (2)), where Z represents the Z statistic, p the allele frequency and n the sample size.
$${\beta }_{{{{\rm{std}}}}}=\frac{Z}{\sqrt{2p(1-p)(n+{Z}^{2})}}$$
(1)
$${{{{\rm{SE}}}}}_{{{{\rm{std}}}}}=\frac{1}{\sqrt{2p(1-p)(n+{Z}^{2})}}$$
(2)
For both the rg estimates and Pearson’s correlations, an inverse-variance weighted meta-analysis using a random-effects model (restricted maximum likelihood estimator) in R v4.3.172 and the ‘metafor’ package73 was completed for the six male-female comparisons within studies, the 30 male-female comparisons across studies, the 15 male-male comparisons across studies and the 15 female-female comparisons across studies (same sex within study comparisons were not included as they would yield a correlation of 1) (Supplementary Figs. 4–6). Within-sex comparisons were included as a baseline check to determine whether male-female differences were due to across-sex or across-study heterogeneity. To determine whether rg estimates / Pearson correlations were significantly different from one we calculated the Z-score, where Ho = the null hypothesis (1 in this case) (Eq. (3)). The P-value was calculated from a standard normal distribution using a two-tailed test and adjusted for five comparisons using the Benjamini-Hochberg method.
$$Z=\frac{\left({r}_{g}-\,{H}_{0}\right)}{{{{\rm{SE}}}}}$$
(3)
A similar approach was repeated using the slope and intercept from linear regressions of male versus female effect size estimates (see Supplementary Methods 3).
Polygenic overlap of MDD across sexes
We used univariate and bivariate MiXeR v1.328,29 to quantify polygenicity of male and female MDD and estimate polygenic overlap between sexes. MiXeR fits a Gaussian mixture model assuming that common genetic effects on a trait are a mixture of causal variants and non-causal variants. Polygenicity is reported as the number of causal variants that explain 90% of h2SNP (to avoid extrapolating model parameters into the area of infinitesimally small effects). As a sensitivity analysis to account for the differential power of our sex-stratified GWAS, we also ran univariate and bivariate MiXeR on the full UK Biobank sample (nFemales = 46,194 cases and 53,211 controls, nMales = 22,608 cases and 56,516 controls) and after down-sampling (n = 22,608 cases and 53,211 in both females and males).
We used gwas-pw v0.2130 to identify causal risk loci for MDD that are sex-specific or shared across the sexes. The recommended European bed file that splits the genome (autosomes only) into approximately independent LD blocks was used within gwas-pw and correlation was set as zero because our female and male MDD GWAS do not have any overlapping individuals. Genomic regions with a posterior probability of association (PPA) larger than 0.5 for model one, two and three were identified as regions containing a causal variant for MDD in females only, males only or shared by both sexes, respectively. Subsequently, for each of these identified regions the SNP with the largest PPA that was above 0.5 was selected as a possible causal MDD variant. These possible causal variants were then annotated using SNP2GENE from FUMA v1.5.231 with ANNOVAR (2017-07-17) and ensemble v110. Positional mapping was carried out with a window size of 10 kb, eQTL mapping using all the tissue types from TIGER74, InsPIRE75, EyeGEx76, eQTL catalogue, PsychENCODE77, van der Wijst et al.78 scRNA eQTLs, DICE79, eQTLGen, Blood eQTLs80, MuTHER81, xQTLServer82, CommonMind Consortium83, BRAINEAC84 and GTEx v885, and 3D Chromatin Interaction Mapping using all Buildin chromatin interaction data (Hi-C of 21 tissue/cell types from GSE8711286, Hi-C loops from Giusti-Rodríguez et al.87, Hi-C based data from PsychENCODE77 and Enhancer-Promoter correlations from FANTOM588,89,90). All of the annotation datasets from PsychENCODE, FANTOM5 and Brain Open Chromatin Atlas91 were used for all three mapping types. Genes annotated to a SNP with more than one method were considered.
Functional annotation and analyses
Gene-based, gene-set and gene-property tests were carried out for the sex-stratified and GxS results using MAGMA v1.0892 within the SNP2GENE function in FUMA v1.5.231. Our summary statistics as well as the lead, independent SNPs as determined by PLINK clumping were used as inputs. Settings used were ensembl v110, ANNOVAR (2017-07-17)93, maximum P value of lead SNPs and P value cut-off of 5 × 10⁻⁸ (sex-stratified summary statistics) or 1 × 10⁻⁶ (GxS summary statistics), a first and second R2 threshold of 0.1, the European 1000 Genomes Phase 3 reference panel94, and a gene window size of 10 kb. The gene-based test used a genome-wide significance P value of 2.53 × 10⁻⁶ as the input SNPs mapped to 19,759 protein coding genes. The gene-set analysis used the gene-level association statistics for all genes from the MAGMA gene-based test and 10,678 gene sets (4761 curated gene sets and 5917 Gene Ontology terms) from MsigDB v6.295 with significance determined using Bonferroni corrected P values. A competitive gene-set analysis was used which tests whether genes in a given gene set are more strongly associated with MDD than the remaining genes not in this gene set, and potential confounding factors such as gene size, gene density and linkage disequilibrium are accounted for. Gene property analysis for tissue specificity was conducted to determine whether genes that are more highly expressed in specific tissues tend to be more associated with MDD. We used RNA-sequencing data from 30 general tissue types and 53 tissue types from GTEx v885, as well as from brain samples collected at 11 general developmental stages from BrainSpan96. Genome-wide significant SNPs (sex-stratified analysis) and nominally significant SNPs (GxS analysis) underwent gene annotation using positional, eQTL and 3D Chromatin Interaction mapping using the same settings as specified above (‘Polygenic overlap of MDD across sexes’).
To determine whether any of our genome-wide significant SNPs (sex-stratified analysis) and nominally significant SNPs (GxS analysis) are novel and to search for previous SNP-phenotype associations, a second analysis using the SNP2GENE function in FUMA v1.5.2 with GWASCatalog (e0_r2022-11-29) was run. The settings as described above were used, however the maximum P value cut-off was changed to one, and SNPs from the reference panel were included. A lead independent significant SNP was considered novel if the significant SNP, or any SNPs in linkage disequilibrium with it, had not previously been associated with any depression phenotypes according to the list of SNPs in GWASCatalog. As the results from the largest GWAS meta-analysis of MDD27 had not yet been added to GWASCatalog at the time of our analyses, all significant SNPs, and those in LD with them, were also checked against all of the genome-wide significant SNPs, and any SNPs in LD, in this publication. SNPs in LD were determined using PLINK v1.90b6.861,62 with a linkage disequilibrium threshold (–clump-r2) of 0.1 and a physical distance threshold (–clump-kb) of 1000.
Sex-specific pleiotropic effects
We used LDSC (released 13/02/2015) to estimate genome-wide autosomal SNP-based rg between our sex-stratified MDD GWAS meta-analysis results and a range of other psychiatric disorders, metabolic traits and substance use traits (Supplementary Data 21). Metabolic and substance use traits were included to determine whether sex-specific pleiotropic effects may contribute to sex differences in metabolic symptoms and substance use in people with MDD. As body mass index (BMI) has a well-powered sex-stratified GWAS97, we also estimated rg for all bivariate combinations of our sex-stratified MDD GWAS and the sex-stratified BMI summary statistics.
To determine whether rg between MDD and each trait is significantly different across sexes we used the jack-knife method, a resampling technique which systematically leaves out one block of data at a time. Unlike the Z-score method, which is commonly used, the jack-knife method accounts for LD structure and does not assume independence of the two genetic correlation values, which is important as the same second trait is used in both the genetic correlations being compared (e.g., MDD in females versus sex-combined ADHD compared to MDD in males versus sex-combined ADHD). In LDSC, the –print-delete-vals flag was used to obtain delete values of genetic covariance and heritabilities for 200 blocks, with delete values referring to estimates computed by leaving out one of 200 jack-knife blocks. For each bivariate genetic correlation, delete values of genetic correlation were calculated for each of the 200 blocks (Eq. (4)), where G = genetic covariance and h2 = SNP-based heritability.
$${r}_{g}=\,\frac{G}{\sqrt{{h}^{2}\left({{{\rm{trait}}}}1\right)\cdot \,{h}^{2}\left({{{\rm{trait}}}}2\right)}}$$
(4)
Jack-knife pseudo-values were then calculated for each of the 200 blocks (Eq. (5)), where P = jack-knife pseudo-value, n = total number of jack-knife blocks (200 in this case), \({r}_{g,\,{{{\rm{global}}}}}^{\left(1\right)}\) = the global genetic correlation obtained from LDSC for comparison one, \({r}_{g,\,{{{\rm{global}}}}}^{\left(2\right)}\) = the global genetic correlation obtained from LDSC for comparison two, \({r}_{g,{\backslash i}}^{(1)}\) = the delete genetic correlation estimated with block i removed from comparison one, and \({r}_{g,{\backslash i}}^{(2)}\) = the delete genetic correlation estimated with block i removed from comparison two.
$$P=n\cdot \left({r}_{g,{{{\rm{global}}}}}^{\left(1\right)}-{r}_{g,{{{\rm{global}}}}}^{\left(2\right)}\right)-(n-1)\cdot ({r}_{g,{\backslash i}}^{\left(1\right)}-{r}_{g,{\backslash i}}^{\left(2\right)})$$
(5)
The mean and standard error of the 200 jack-knife pseudo-values estimates the difference between the two genetic correlations and was compared to the null hypothesis that there is no difference between the genetic correlations by calculating the Z-score, where Ho = the null hypothesis (0 in this case) (Eq. (3)). The P-value was calculated from a standard normal distribution using a two-tailed test followed by the Benjamini Hochberg correction for 11 tests (all traits) or two tests (sex-specific BMI). As a sensitivity analysis, the Z-score method was also used to determine whether rg between MDD and each trait is significantly different across sexes because although it is not theoretically appropriate it is commonly used (Supplementary Methods 4).
We further explored the metabolic traits BMI and metabolic syndrome that showed significant sex-specific rg. To quantify polygenic overlap between MDD in females/males and each metabolic trait, we used MiXeR v1.328,29. Gwas-pw v0.2130 was used to identify causal risk loci shared by MDD and each metabolic trait that are sex-specific or shared across the sexes. Inputs to gwas-pw were our female MDD summary statistics and female BMI summary statistics97, or our male MDD summary statistics and male BMI summary statistics97, and the recommended European PLINK bed file that splits the genome (autosomes only) into approximately independent LD blocks. The correlation between beta values of SNPs within genomic regions with a PPA < 0.2 as calculated in fgwas v0.3.698 was used to account for potential overlapping of cohorts. Genomic regions with a PPA > 0.5 for model 3 were compared between the female MDD–female BMI and male MDD–male BMI analyses to identify genomic regions with a causal variant shared by MDD and BMI that are female-specific, male-specific or shared by both sexes. Subsequently, for each of these identified regions the SNP with the largest PPA that was above 0.5 was selected as a causal MDD/BMI variant. These causal variants were then annotated using SNP2GENE from FUMA v1.5.231 with the same settings as described above (‘Polygenic overlap of MDD across sexes’). The above was repeated for the comparison of the sex-combined metabolic syndrome summary statistics99 with our female and male MDD summary statistics.
Reporting summary
Further information on research design is available in the Nature Portfolio Reporting Summary linked to this article.