
Experiment datasets
This study systematically evaluates protein-protein interaction (PPI) networks from four model organisms: Saccharomyces cerevisiae, Arabidopsis thaliana, Drosophila melanogaster, and Caenorhabditis elegans [28,29,30,31]. All PPI data were obtained from the STRING database (v12.0) [17], with protein function annotations derived from the Gene Ontology Consortium [32]. Table 1 summarizes the basic characteristics of each dataset, where FN denotes the number of functional categories and PWA represents the count of proteins with GO annotations.
The protein function annotation integration pipeline comprises six key steps: 1. GAF data initialization: Extraction of experimentally validated protein function annotations from Gene Ontology Annotation Files (GAF), filtering for high-confidence evidence codes (e.g., EXP/IDA) followed by hierarchical screening using the GODag module from goatools package. 2. STRING network processing: Removal of self-interacting edges while retaining high-confidence physical interactions (confidence score \(>500\)), with STRING identifiers uniformly mapped to UniProt IDs [4]. 3. ID mapping conversion: Standardization of gene IDs from GAF and protein IDs from STRING to UniProt IDs, with their intersection forming the core dataset. 4. Domain information integration: Extraction of conserved domain features from InterProScan results to establish a protein domain mapping dictionary. 5. Network reconstruction: Rebuilding the PPI network based on shared UniProt IDs, preserving only nodes and edges present in both datasets to ensure data consistency. 6. Annotation data filtering: Reverse mapping of UniProt IDs to original identifiers to generate the final integrated dataset containing protein lists, PPI networks, domain dictionaries, and GO annotations.
Table 1 Basic characteristics of datasets from four speciesEvaluation metrics
This study employed four key metrics to assess model performance: Recall, Precision, Fmax, and AUCPR. The formal definitions of these metrics are as follows:
$$\begin{aligned} &{Recall}= \frac{TP}{TP + FN} \\& {Precision}= \frac{TP}{TP + FP} \\& F_{\max}= \frac{2 \times {Precision} \times {Recall}}{{Precision + Recall}} \end{aligned}$$
where
True positives (TP): number of correctly predicted functional annotations
False positives (FP): number of incorrectly predicted functional annotations
False negatives (FN): number of known functional annotations that were not predicted
The recall rate (Recall) quantifies the model’s ability to identify known functions, while the precision rate (Precision) measures the accuracy of predictions. The Fmax score, as the harmonic mean of precision and recall, provides a comprehensive performance evaluation.
Given the prevalent class imbalance in protein function annotation, we additionally calculated the Area Under the Precision-Recall Curve (AUCPR) as an alternative evaluation metric. The Precision-Recall curve, generated by plotting precision against recall at various thresholds, visually demonstrates model performance for rare functional categories. The AUCPR represents the area under this curve, with higher values indicating superior model performance.
In summary, higher Fmax and AUCPR values correspond to better functional annotation capability of the model.
Model parameter analysis
This study systematically evaluated the impact of the decay parameter \(\gamma \) within the biologically relevant range (\(\gamma \in [0,1]\)) on model performance, with 21 equally spaced sampling points. Evaluation metrics included Recall, Precision, and Fmax values across three gene ontology (GO) categories: biological process (BP), molecular function (MF), and cellular component (CC), using a fixed classification threshold of \(\theta = 0.5\).
The experimental results in Fig. 2 demonstrated that when \(\gamma \) = 0 or 1, the model exhibited suboptimal performance in all GO categories for Recall, Precision, and Fmax metrics, as consistently shown in the three panels (A, B, C). Notably, peak performance was achieved when \(\gamma \) approached 0.15, with Fmax values reaching 0.31 for BP, 0.29 for MF, and 0.48 for CC. Performance remained stable within the \(\gamma \in [0.05,0.3]\) range but showed a sharp decline when \(\gamma \) exceeded 0.3.
Fig. 2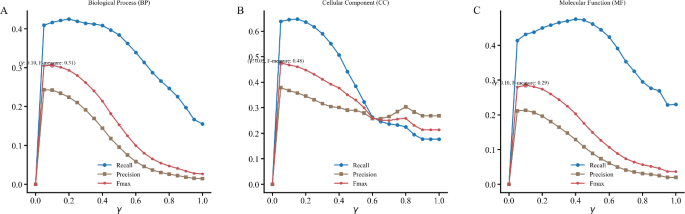
Impact of \(\gamma \) parameter on model performance. Panels A, B, and C display average Recall, Precision, and Fmax values for BP, MF, and CC GO annotations respectively, across different \(\gamma \) values
Comparative analysis revealed that both \(\gamma \) = 1 and \(\gamma \) = 0 performed significantly worse than intermediate values. These results confirm the necessity of combining contextual similarity with compositional similarity. Based on the experimental findings, we selected \(\gamma \) = 0.15 as the default parameter for subsequent experiments, where the model achieved optimal performance while maintaining stability.
k-fold comparative experiments
This study employed the benchmark dataset of Saccharomyces cerevisiae and adopted the k-fold cross-validation method for comparative performance evaluation, with k set to 0.1-fold to enhance statistical significance. Four mainstream feature selection methods were selected as baseline comparison models, including DCS [33], GrAPFI [34], PON [35], and FS-Weight.
First, to comprehensively evaluate the performance advantages of the TAFS model, we systematically analyzed the prediction efficacy for three Gene Ontology (GO) annotations? Biological process (BP), cellular component (CC), and molecular function (MF)? across a threshold range of 0–1 (step size 0.05).
The experimental results (Fig. 3) demonstrate that the TAFS model significantly outperforms baseline methods such as DCS, FSWeight, GrAPFI, and PON in predicting BP and CC GO annotations on the Saccharomyces cerevisiae PPI dataset. Specifically, for BP prediction, TAFS achieved the highest Fmax value of 0.291 at a threshold of 0.4, representing an 18.3% improvement over the second-best method. For CC prediction, TAFS attained an Fmax value of 0.472 at a threshold of 0.5, surpassing FSWeight by 7.0%. In MF prediction, TAFS reached a peak Fmax value of 0.306 at a threshold of 0.8, outperforming GrAPFI by 12.1%. These improvements primarily stem from the TAFS model’s multi-scale feature fusion mechanism, which maintains high precision (average 0.287) while significantly enhancing recall (average 0.392), thereby achieving superior prediction performance balance, particularly suited for large-scale protein function annotation tasks.
Fig. 3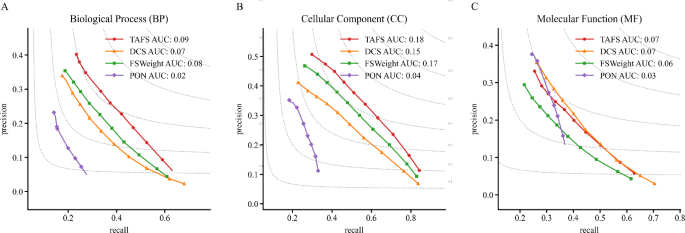
k-fold PR curve comparative experiments. Comparison models include: DCS, PON, GrAPFI, FSWeight, and TAFS. Panels A, B, and C display the Recall and Precision values for BP, CC, and MF GO annotations, respectively. The x-axis represents Recall, and the y-axis represents Precision
Second, with a fixed threshold of 0.5, Table 2 presents the performance comparison between the TAFS model and the four baseline methods for BP, CC, and MF GO annotation predictions. In terms of the Fmax composite metric, TAFS significantly outperformed all comparison methods in BP (0.300) and CC (0.472) predictions, with the Fmax value for BP prediction being 15.8% higher than that of the second-best method, FSWeight. Notably, for BP prediction, TAFS achieved the highest recall (0.363) while maintaining a precision of 0.256, indicating its ability to effectively balance prediction comprehensiveness and accuracy.
For MF prediction, GrAPFI and PON demonstrated relatively high precision (0.396 and 0.383, respectively), but their recall values (0.307 and 0.291) were notably lower, reflecting the conservative nature of these methods. In contrast, TAFS achieved a recall of 0.392 while maintaining a moderate precision of 0.227, resulting in a more balanced performance. Particularly noteworthy are the CC prediction results, where TAFS exhibited significant leads in both recall (0.588) and precision (0.394), attributable to its feature selection algorithm’s specificity in capturing subcellular localization signals. Overall, the experimental data validate the comprehensive advantages of the TAFS model in multi-category functional annotation prediction, especially in scenarios requiring a balance between sensitivity and specificity.
As shown in Table 2.
Table 2 Performance comparison of different methods across BP, CC, and MF ontology categories using Fmax, recall, and precision as evaluation metricsCross-species experimental validation
To systematically evaluate the predictive performance of the topology-aware functional similarity (TAFS) algorithm, this study selected protein-protein interaction (PPI) network datasets from four different model organisms (Saccharomyces cerevisiae and Escherichia coli) for cross-validation. These datasets exhibit significant differences in scale (ranging from 2000 to 40,000 interactions) and topological properties, enabling comprehensive testing of the algorithm’s robustness across PPI networks of varying complexity.
For validation, we employed a rigorous leave-one-out cross-validation (LOO-CV) scheme. The specific implementation process was as follows: For each target protein, all functional annotation information was first removed from its reference functional matrix, followed by constructing a training set based on functional annotations from the remaining n-1 proteins. This iterative validation strategy allows accurate assessment of the algorithm’s performance in predicting individual protein functions.
Table 3 Comparative performance evaluation of functional annotation methods across multiple species datasets for biological process (BP), cellular component (CC), and molecular function (MF) ontologies
The TAFS algorithm demonstrates significant advantages in cross-species protein function prediction tasks. As shown in Table 3, across four model organisms (Arabidopsis thaliana, Caenorhabditis elegans, Drosophila melanogaster, and Saccharomyces cerevisiae), TAFS maintains leading performance in both Biological Process (BP) and Cellular Component (CC) Gene Ontology categories. Notably, for BP prediction tasks, TAFS achieves performance improvements of 16.9–25.1% compared to the second-best methods (S. cerevisiae and C. elegans datasets), validating the effectiveness of the topology-aware mechanism in capturing complex biological processes.
For CC prediction, TAFS exhibits the strongest stability, ranking first in Fmax metrics across all datasets, with performance improvements of 4.3% and 12.9% in A. thaliana and D. melanogaster datasets, respectively. This indicates the algorithm’s superior capability in identifying topology features related to subcellular localization. Although TAFS shows relatively lower absolute rankings (4th-5th) in molecular function (MF) prediction, its performance gap with the best methods remains within 7.3% (S. cerevisiae dataset), while significantly outperforming traditional methods like DCS and FSWeight, demonstrating its competitiveness in molecular function prediction.
Cross-species comparative analysis reveals two key findings: First, TAFS performs best in evolutionarily advanced eukaryotes (S. cerevisiae, BP Fmax 0.3), likely due to the more complex topological structures in higher organisms’ PPI networks. Second, even in smaller-scale datasets like C. elegans ( 2000 interactions), TAFS maintains stable prediction performance (CC Fmax 0.472), confirming the algorithm’s adaptability to small-sample data. These results provide experimental evidence for extending TAFS applications to non-model organisms.
k-fold functional ablation experiments
Protein interaction networks (PINs) commonly exhibit missing functional annotations. To evaluate algorithm robustness under real-world biological data scenarios, we conducted progressive annotation ablation experiments based on the aforementioned S. cerevisiae dataset, simulating data environments with varying degrees of completeness. Using the fully annotated dataset as a benchmark, we employed random sampling to sequentially remove 10
Experiments were conducted with a fixed classification threshold of 0.5 and decay factor \(\gamma \) set to 0.15. Each missing proportion was independently repeated 1000 times to obtain stable statistical results. For comprehensive evaluation, three core metrics were selected: Precision reflecting prediction accuracy, Recall measuring functional coverage completeness, and Fmax as the comprehensive performance indicator. DCS, GrAPFI, PON, and FSWeight served as benchmark controls.
Table 4 Comparative performance metrics (Fmax, recall, precision) of functional annotation ablation experiments across varying data proportions
Table 4 presents the functional annotation ablation performance comparison between the TAFS model and four other methods (DCS, FSWeight, GrAPFI, and PON) across three ontology categories: biological process (BP), cellular component (CC), and molecular function (MF). The overall trend demonstrates that TAFS consistently achieves superior comprehensive performance across all tested proportions (10%, 20%, 50%, 80%), with its Fmax values leading in all three ontology categories. Particularly notable is its performance in the CC category, where at 10% ablation it achieves an Fmax of 0.472, outperforming the second-best method FSWeight by 7%.
Specifically, TAFS excels in Recall metrics, maintaining the highest values across BP and CC categories at all proportions. For instance, at 10% ablation in BP, TAFS achieves a Recall of 0.363, representing a 13.4% improvement over the DCS method. This indicates TAFS’s superior capability in identifying true functional annotations. Although GrAPFI and PON show advantages in Precision for the MF category (e.g., 0.396 and 0.383 respectively at 10% ablation), their Recall values are significantly lower than TAFS (0.307/0.291 vs 0.392), reflecting their conservative prediction tendencies that miss more true annotations.
Notably, while all methods exhibit performance degradation with increasing ablation proportions, TAFS demonstrates better robustness. At 80% high ablation, TAFS maintains an Fmax of 0.379 in the CC category, showing only a 2.7% decrease compared to the best alternative method FSWeight, while GrAPFI and PON decrease by 53.8% and 52.8% respectively. This suggests TAFS’s stronger stability in high-noise ablation scenarios, likely attributable to its integrated feature selection and adaptive threshold mechanisms that effectively balance precision and recall.