
Demographics, clinical characteristics, core AD fluid, digital and imaging biomarkers among groups
A total of 1223 participants were included in this study, consisting of 461 with aMCI, 238 with AD dementia, and 524 CU. The overall proportion of females was 57.40%, with the highest proportion in the AD group (68.91%) and the lowest in the CU group (48.90%). The average age was 74.06 ± 7.28 years, with no significant differences in age among groups (F = 2.9267, P = 0.0539). The CU group had the longest educational years (9.52 ± 4.51 years), while the MCI and AD groups had shorter educational years. APOE-ε4 carriers accounted for 23.96%, with the highest carrier rate in the AD group (37.39%) and the lowest in the CU group (19.27%) with significant differences (X2 = 30.56, P < 0.0001). The detail and post hoc analysis can be found in the Table 1.
Table 1 Demographics of participants
The digital and fluid biomarkers were significantly different among the three groups. GFAP (F = 103.3351, P < 0.0001), NFL (F = 25.1172, P < 0.0001), p-Tau181 (F = 8.9750, P = 0.0001), p-Tau217 (F = 95.6686, P < 0.0001), these four indicators were the lowest in the CU group and the highest in the AD group, and there were significant differences between the groups. On the contrary, Aβ42 and Aβ42/40 showed a potential lower level in MCI or AD groups than that in CU group without significant differences (F = 2.0699, P = 0.1266). Regarding PSD, the digital biomarker, gradually increased with the course of the disease, and PSD in AD group has the biggest value against that in the CU group with a significant difference (F = 130.8601, P < 0.0001). The details and post hoc analysis can be found in the Table 1.
Since the assessment of amyloid pathology is crucial in the ATN framework of AD, AV45-PET examinations were completed in 201 people including 72 CU, 21 aMCI, 108 AD, of which 49 were negative and 152 were positive after visual judgment. The demographic information and AD-related biomarker can be found in the Supplementary Table 1. We further calculated the SUVR of different ROIs. After quality inspection, preprocessing and SNBPI toolbox calculation, we included 123 samples for statistical analysis, of which 37 were negative and 86 were positive. The SUVR in each ROI which had significant associations were shown in the Table 2. As expected, Aβ SUVR in these regions, including frontal lobe (t=-7.0402, p < 0.0001), parietal lobe (t=-7.1796, p < 0.0001), temporal lobe (t=-7.7205, p < 0.0001), occipital lobe (t=-7.7586, p < 0.0001), insula (t=-7.287, p < 0.0001), limbic system (t=-6.4329, p < 0.0001), subcortical (t=-3.7746, p = 0.0003), and total brain (t=-9.2686, p < 0.0001), were significantly higher in the positive group.
Table 2 Information of AV45 PET imagingCorrelation of PSD with cognitive assessments, fluid biomarkers, and amyloid burden in the brain
To further investigate the correlation between PSD and AD-related markers, the significant associations between them from 3 aspects were found after controlling for age, gender, education level, and APOE genotype: cognitive level, fluid biomarkers, and amyloid burden. ⑴ Correlation with cognitive level: PSD was negatively correlated with MoCA (r = -0.3285, P < 0.0001) (Fig. 1B), and showed significant differences between groups, with the smallest value in the CDR 0 group (P < 0.0001) (Fig. 1B); ⑵ Correlations with serum biomarker: PSD was positively correlated with GFAP (r = 0.0737, P = 0.0108), NFL (r = 0.0603, P = 0.0372) and p-Tau217 (r = 0.1208, P = < 0.0001), rather than Aβ42/40 (r = -0.0357, P = 0.2172)(Fig. 1C-F); ⑶Correlation with AV45 SUVR: PSD had no significant correlation with whole brain amyloid burden (r = 0.1779, P = 0.0530). But in further analysis of brain regions, there were positive correlation with AV45 SUVR in the frontal lobe (r = 0.2042, P = 0.0259), temporal lobe (r = 0.2111, P = 0.0212), except the whole brain burden presented as Aβmeta SUVR(r = 0.1779 P = 0.053) (Fig. 2A-C). Other partial correlation analysis can be found in Supplementary Table 2.
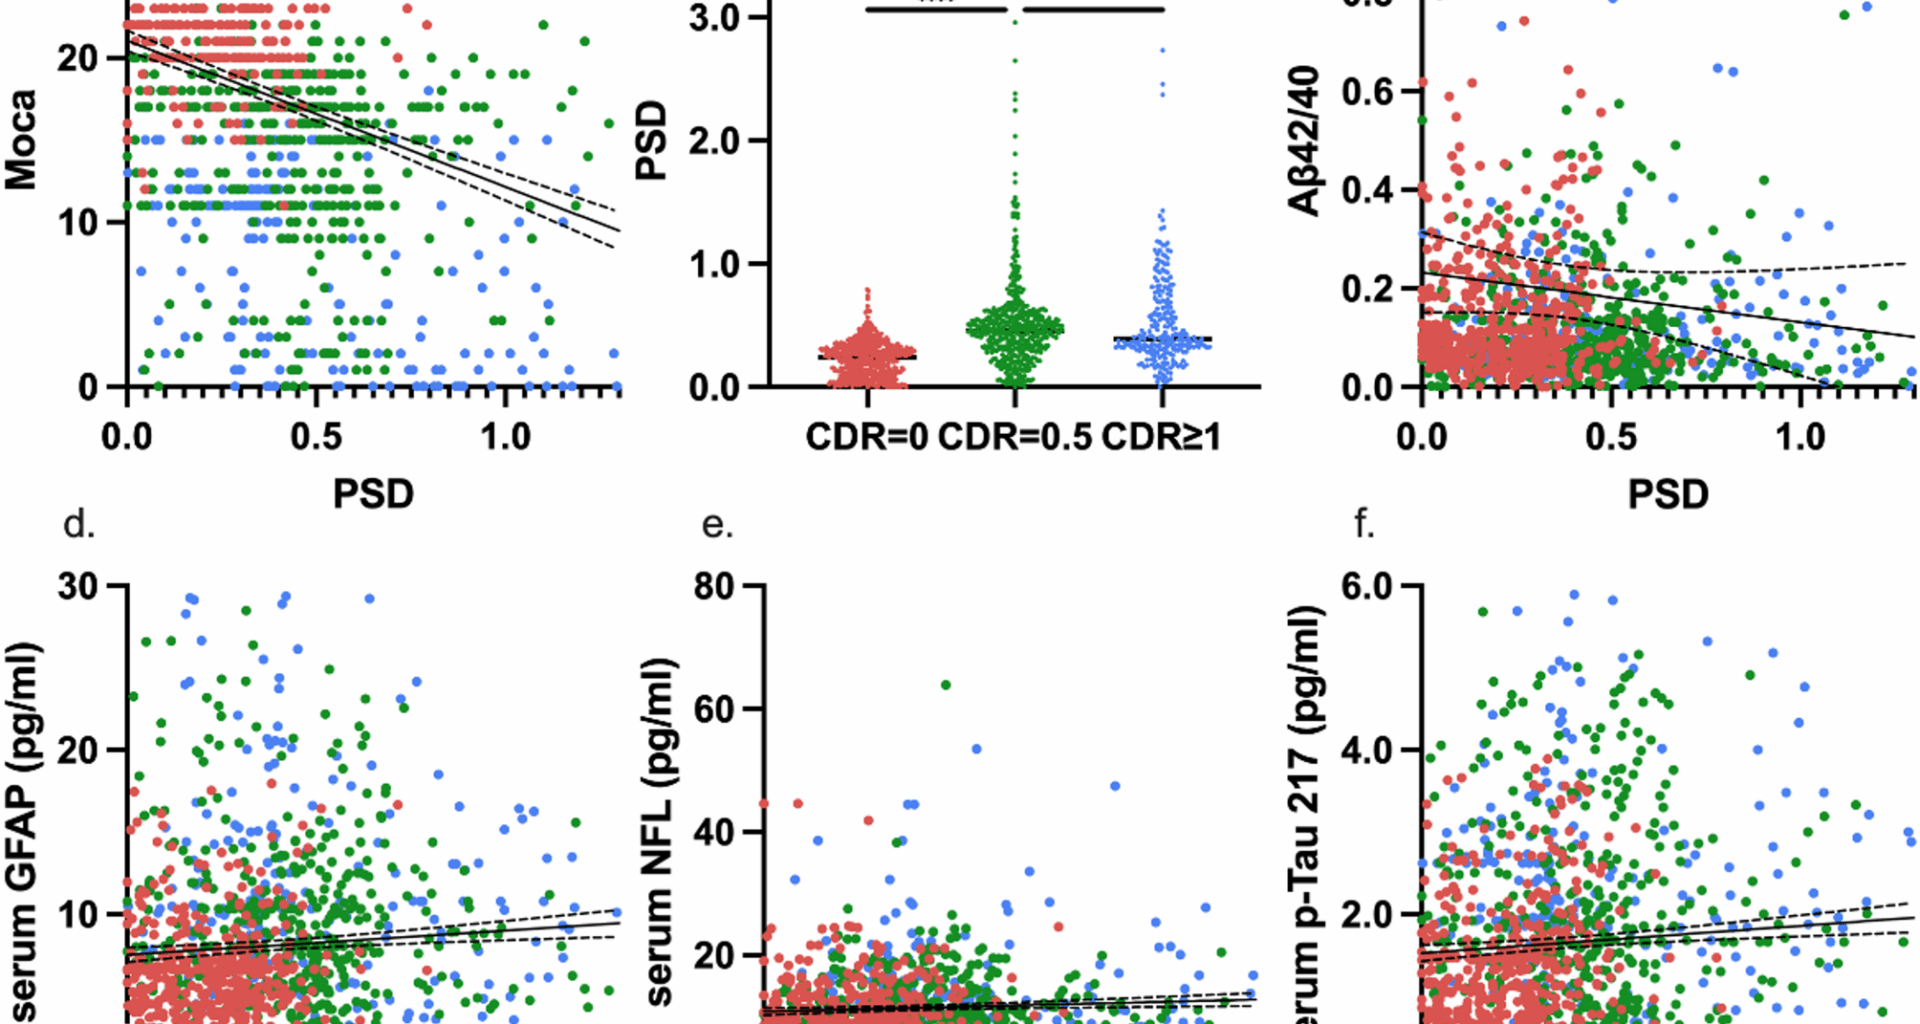
Fig. 1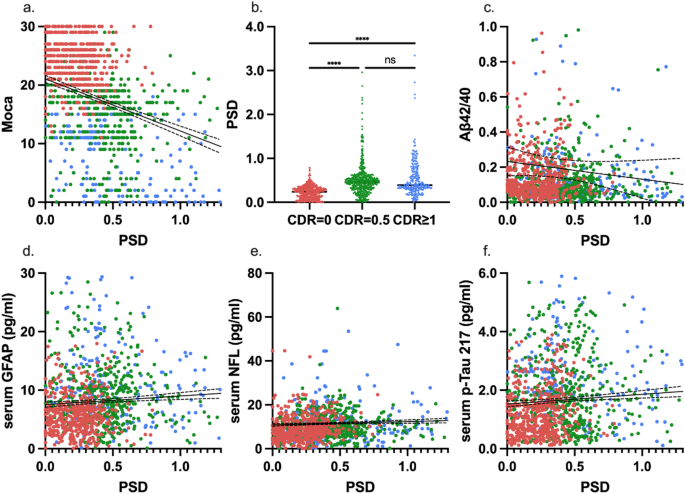
Correlation of PSD with cognitive assessments, fluid biomarkers. (a) Pearson correlation curve between PSD and Moca; (b) Differences in PSD under different CDR scores; (c-f) Pearson correlation curve between PSD and different serum biomarkers (Aβ42/40, GFAP, NFL, p-Tau217) and the r value, p value of partial correlation analysis
Fig. 2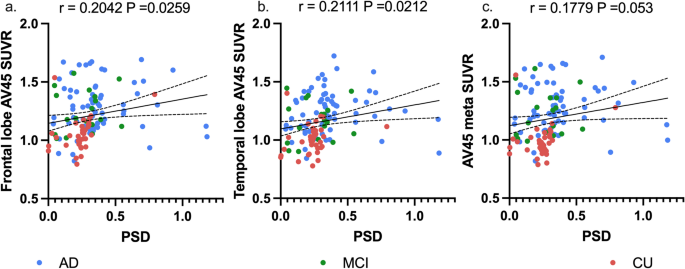
Correlation of PSD with amyloid burden in the brain, and the trend of biomarkers at different Aβ deposition levels. (a-c) Pearson correlation curve between PSD and different AV45 PET ROI SUVR (frontal lobe, temporal lobe, and the AV45 meta SUVR) and the r value, p value of partial correlation analysis
The speech digital biomarkers and serum biomarkers are affected by central amyloid pathology. We used the LOWESS model to measure the association between speech digital biomarkers, serum p-Tau217, and Aβ42/40, and central amyloid deposition. Surprisingly, the results of correlation analysis revealed that PSD and serum p-Tau217 were sensitive to amyloid deposition, which appeared to have two distinct stages. In the stage before the inflection point of amyloid deposition changes (Aβ meta SUVR < 1.20), PSD, serum, p-Tau217 and GFAP showed an upward trend, but after the inflection point, they reached a plateau and no significant increase is observed (Fig. 3A-C). However, the correlation of Aβ42/40 with amyloid deposition was not significant (Fig. 3D) with an upward trend.
Fig. 3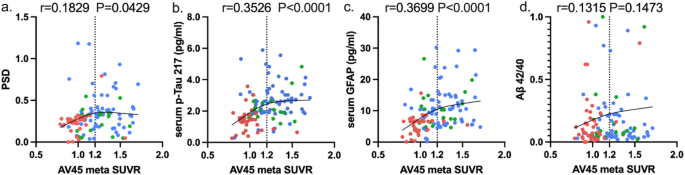
The trend of biomarkers at different Aβ deposition levels. (a-d) LOWESS curve between AV45 meta SUVR and different biomarkers (PSD, p-Tau217, GFAP, Aβ42/40, NFL) and the corresponding r value, p value of Pearson correlation
Combining digital and fluid markers to identify individuals with cognitive impairment
Demographic information, speech digital biomarkers, serum biomarkers, and genetic information (APOE), were used to identify CI. We used 1223 participants as modeling samples, with aMCI, probable AD or AD as the CI population as the identification target. The best model containing all features was established using the XGBoost model with an AUC of 0.951 (95%CI, 0.925 to 0.976). Finally, through excluding the low-weight serum biomarkers by SHAP values (Supplementary Fig. 2), we found the simplest and most efficient model, whose prediction AUC in the test set was 0.928 (95%CI, 0.897 to 0.960), and there was no significant difference between the AUC and the best model. The model included age, sex, years of education, APOE genotype, PSD, GFAP (Fig. 4A). PSD contributed the most among all parameters, while GFAP is the largest among all serum indicators. The screening process of the model can be found in Supplementary Table 3. Through SHAP values, we can observe that PSD and GFAP contribute the most in this model, and their interaction also has a significant impact on the model. The SHAP importance of each feature in the model can be found in Supplementary Fig. 2B, D-I. The decision curves for each model are shown in Supplementary Fig. 2 J.
Fig. 4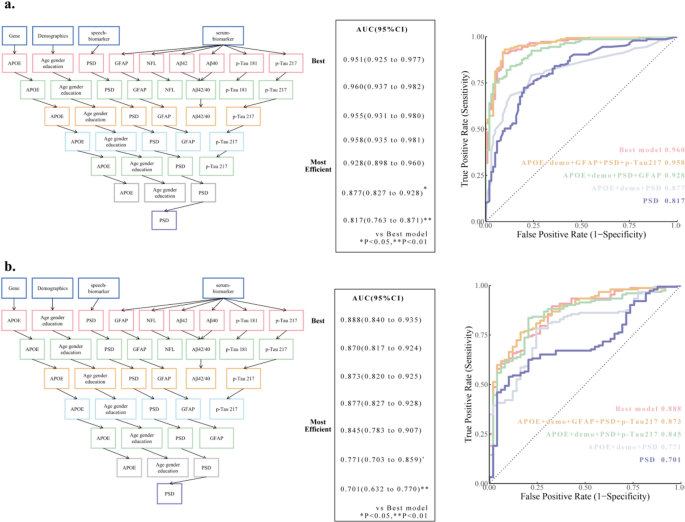
The diagnosis model of cognitive impairment screen and prediction of amyloid status in the brain. (a, b) The XGBoost and Logistic regression model process. The best fit model shows the data-driven model selection with the highest area under the receiver-operating characteristic (ROC) curve (AUC). In subsequent models, modalities were removed step by step to obtain a similar and efficient model performance with as few significant measures as possible. Comparisons between AUCs were performed using DeLong statistics. (a, right) ROC curve analyses of the different models for discriminating cognitive impairment. (b, right) ROC curve analyses of the different models for discriminating Aβ status as determined by positron emission tomography (PET) scans.PSD, percentage of silence duration; GFAP, Glial Fibrillary Acidic Protein; NFL, Neurofilament; 95%CI, 95% Confidence Interval; *, P < 0.05, **, P < 0.01
Combining digital and fluid markers to speculate on possible Aβ status
Next, we tried to assess whether combining digital with serum biomarkers could further improve the accuracy of predicting PET Aβ status. We selected 201 participants who completed AV45 PET imaging as the sample, of which 152 amyloid-positive patients served as the identification target. With the same method, we constructed the most efficient Logistic regression model with AUC = 0.845 (95% CI, 0.783 to 0.907). The model included age, gender, years of education, APOE genotype, PSD, and p-Tau217 (Fig. 4B). Serum p-Tau217 contributed the most among all parameters. The screening process of the model can be found in Supplementary Table 4. Through SHAP values, we can observe that p-Tau217, APOE genotype, and PSD contribute the most to this model. The SHAP importance of each feature in the model can be found in Supplementary Fig. 3B-H. The decision curves for each model are shown in Supplementary Fig. 3I.