
Study population
This study utilises data from COVICAT, an adult COVID-19 population-based cohort in Catalonia [2, 10, 11], established in 2020 to assess the health impact of the COVID-19 pandemic on the population of Catalonia. COVICAT is a nested study survey from the GCAT cohort [12]. The GCAT is a population-based cohort of nearly 20,000 participants from Catalonia, who voluntarily enrolled in the study (2014–2018) with the unique restriction of being between 40 and 65 years old and living in Catalonia. This cohort is linked to Electronic Health Records (EHR) from the public healthcare system, providing more than 15 years of retrospective follow-up. Participants from the GCAT cohort were invited to complete COVID-19-related surveys during the following periods: June–November 2020 (baseline), June–August 2021 (first follow-up) and February–May 2023 (second follow-up), with a participation rate of 74% [2].
Ethical approval was obtained by the ethics committees at the Hospital Universitari Germans Trias i Pujol (CEI no. PI-13–020, PI-20–182). All participants provided informed consent, agreed to potential re-contact and can opt-out or withdraw their consent for specific areas of research.
Inclusion and exclusion criteria
From COVICAT participants, we included those with data from the 2021 and 2023 surveys where long COVID was assessed (n = 8918). Then, we excluded those individuals without linked electronic health record (EHR) data (n = 399), individuals who had moved outside Catalonia (n = 42) and those with no diagnosis information in their EHR (n = 99). Additionally, 56 participants were excluded due to technical reasons, including revoked consent and technical issues (n = 2), as well as birthdate discrepancies (n = 54). The final analytic sample comprised 8322 individuals, of whom 4874 (58.6%) were female.
Long COVID definition
We first defined long COVID based on WHO guidelines and the 2024 NASEM definition as follows: (i) self-reported SARS-CoV-2 infection and (ii) self-report of at least one symptom or sequel lasting at least 3 months, unexplained by other causes. These symptoms or sequelae included fever or low-grade fever; abdominal pain; headache; tiredness or unusual fatigue; chills, vertigo or dizziness; tingling sensation; loss of taste or smell; cardiovascular, respiratory, renal, dermatological, cognitive/neurological, psychological/psychiatric, muscular, haematological, endocrine and digestive problems; dry eyes or mouth; and menstrual disturbances. Consistent with our previous study [2], long COVID cases were identified by combining symptom reports from both the first (2021) and second (2023) follow-ups. To maximise statistical power in this case–control study, we used population controls, including all COVICAT individuals with and without a confirmed SARS-CoV-2 infection who were not classified as cases. An additional analysis was performed, restricting controls to individuals with self-reported SARS-CoV-2 infection.
COVID severity was classified according to WHO guidelines and defined severe cases as self-reported COVID-19 hospitalisation.
Clinical diagnoses
To analyse multimorbidity, we used prevalent chronic conditions diagnosed prior to the pandemic. Disease diagnoses were obtained from primary care, hospital and emergencies EHR. Disease diagnoses are encoded with the International Classification of Diseases (ICD) version 10 and 9 and converted into ICD-10 using a conversion table [13]. To avoid the influence of COVID-19, we excluded all diagnoses recorded after 2019, which resulted in 6161 distinct ICD-10 codes. Acute diagnoses were filtered out using the Chronic Conditions Indicator (CCI 2023), leaving 1776 chronic ICD-10 diagnoses. For recurrent diagnoses, only the first diagnosis date was retained. Diagnoses were then grouped at the three-digit ICD-10 level into 536 categories, characterised by diagnostic homogeneity, grouping conditions with similar clinical, anatomical, or etiological features. Sex-specific diagnoses (N40–N98, O00–O99, E28–E29 and C50–C63) were excluded from the overall analysis, as these diagnoses are only meaningful within sex-stratified contexts. Finally, a frequency filter retaining diagnoses present in at least 1% of participants yielded 106 diseases (79 in both sexes, 92 in women and 79 in men). These diagnoses were used to model disease trajectories and to investigate their association with long COVID.
Disease trajectories
Disease trajectories were assessed by analysing the temporal sequence and co-occurrence of diseases. To obtain them, we followed the method described by Giannoula et al. [8], by computing a disease history vector per individual, which is a vector of selected diseases in order of appearance. Then, common disease trajectories among all individuals were computed by pairwise comparison between all individuals’ disease history vectors, keeping those diagnoses that appeared in both individuals in the same order (equal or ascendant dates, as more than one diagnosis can be presented on the same date). This method allowed multiple trajectories per individual, even trajectories with opposite directions in the case that both diseases were diagnosed on the same date. For disease trajectories filtering, we removed those trajectories with less than 1% prevalence as well as disease trajectories of more than two diseases for simplicity. We then applied Fisher’s exact test and corrected for multiple testing using Benjamini–Hochberg False Discovery Rate (FDR) [14] to obtain enriched pairs of diagnosis. These trajectories were then analysed for their association with long COVID incidence.
Association analysis
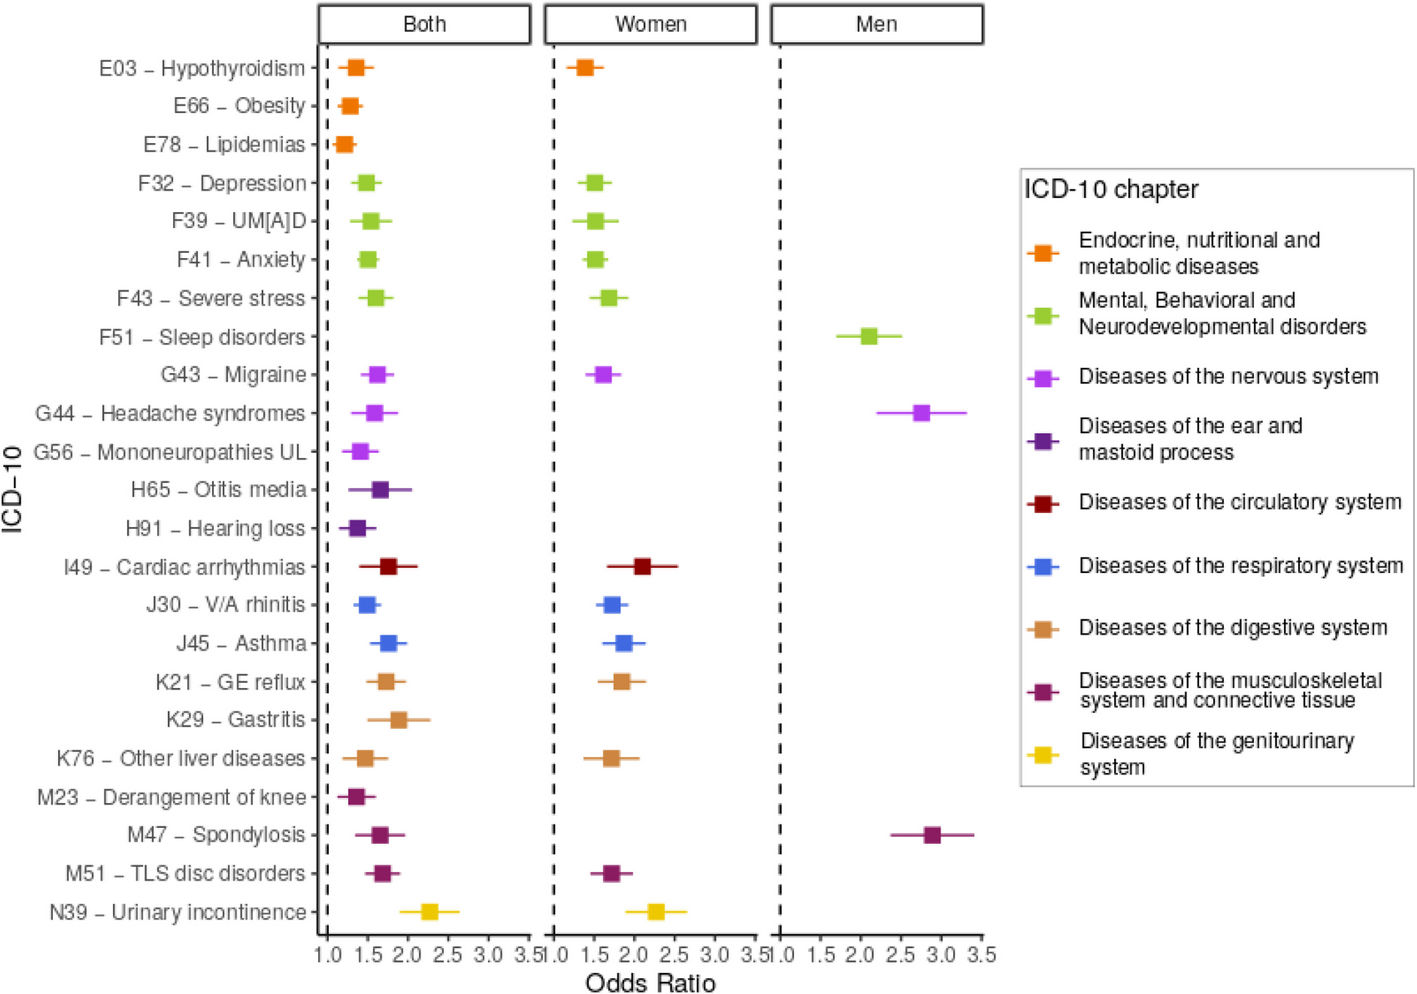
Statistical association between long COVID as the outcome and (i) selected diseases or (ii) selected disease trajectories as predictors was performed through logistic regression using age and sex (in the overall analysis) as covariates and reporting odds ratio (OR), standard error (SE), 95% confidence interval (CI) and p-value. Multiple test correction was performed using FDR. For each associated disease and disease trajectory derived from the first analysis, we then examined its association with long COVID symptoms to gain a more detailed understanding of the relationship, including the types and severity of long COVID. In addition, we performed sex-stratified analyses to assess sex-specific associations, also incorporating sex-specific diagnoses.
We analysed the effect of COVID-19 severity to distinguish its role from that of pre-pandemic disease trajectories, as severity is a known predictor of long COVID and may mediate some of the observed associations. We did that by conducting an additional analysis adjusting for disease severity. Specifically, COVID-19 severity—defined by hospitalisation.
To assess whether the observed associations between disease trajectories and long COVID could have occurred by chance, we performed 10,000 random simulations of long COVID case–control status, maintaining the same sex distribution (769 female and 293 male cases), generating a null distribution of significant associations expected randomly and setting the 99th percentile of the simulations as the significance threshold. Estimates were derived and used to assess sex-based differences and determine statistical significance.
We also assessed the overrepresentation of ICD-10 chapters, as a proxy of broadly coherent clinical groupings, among associated diseases compared to the initially selected ones. Enrichment was calculated relative to all disease trajectories identified in the study population, irrespective of their association with long COVID, to provide a comprehensive basis for comparison. These comparisons were performed using Fisher’s exact test and corrected by FDR. Finally, as a sensitivity analysis, (i) we restricted controls to individuals with confirmed SARS-CoV-2 infection to assess the robustness of the main findings and (ii) used vaccination status as a covariate to assess its effect as a confounder (results provided in the Additional File 1: Sensitivity analyses and Figs. S1–S2, Additional File 2: Tables S1–S4) [15,16,17]. All analyses were conducted using R [18].
Genetic correlation and PRS analysis
Genotypic data were available for 2108 of the included individuals (25.3%). These data were generated beforehand by our group, as described by Galvan-Femenía et al. [19]. Using this sample, we assessed the genetic contribution to long COVID by analysing all associated diseases, whether identified through trajectories or as individual conditions.
First, we performed genetic correlations to identify shared genetic determinants with long COVID, using publicly available GWAS summary statistics: (1) for each associated disease from FinnGen [20] (Additional File 2: Table S5) and (2) for long COVID, from the Host Genetics Initiative [16]. Pairwise genetic correlations between all diseases, including long COVID, were estimated using LD Score Regression (LDSC) [21], and p-values were corrected for multiple testing using FDR.
Secondly, using publicly available GWAS summary statistics, we computed polygenic risk scores (PRS) for our participants with available genetic data. Posterior SNP effect sizes for those summary statistic data were computed using PRScs [22] and individual scores were calculated using PLINK1.9 [23] as the cumulative sum of SNP dosages weighted by their posterior effect sizes. The resulting raw PRS were standardised into z-scores to enable comparison of odds ratios across analyses. These scores were used to test their association with long COVID through generalised linear models using age and sex as covariates, and associations were corrected using FDR.