
All tests were conducted at Biolytrics Vietnam between September 2018 and June 2020. Five experiments were performed. (1) validation of the GC-FID (Gas Chromatography with Flame Ionization Detection) compared to standard CIPAC HPLC (High Pressure Liquid Chromatography) method (2) evaluation of CAM and MKDT, (3) evaluation of MKDT with mosquito strains that were pyrethroid sensitive or resistant, (4) comparison of SWAM and BAM after washing a net 3 times in a day, (5) demonstrate the significance of correctly identifying the wash interval for incorporated nets, (6) measuring surface concentrations of two commercial nets using SWAM and CAM. For all evaluations deltamethrin-PBO ITNs were used except one that used a deltamethrin net.
Test nets
Polyethylene (PE) nets were provided by Intelligent Insect Control SARL and produced at Sunpack, Jiangsu, China. Yarns were extruded by mixing High Density PE with Low Density PE with masterbatches with active ingredients and antioxidants [4, 12]. Two types of nets were provided. One net had all yarns with 2 g of the pyrethroid deltamethrin (DM). The other type of net had 1.5 g DM plus 0.5 g PBO in one yarn and 13 g Piperonyl butoxide (PBO) in the other yarn. Yarns were warp knitted into mosquito nets where the ratio of the yarns determines the dosages of the DM-PBO net. A net with 3 g DM/kg and 11 g PBO/kg was made by having a yarn ratio DM-yarn to PBO yarn of 20:80. Experimental nets were also made with the high dosage DM yarn only, thus a 15 g DM/kg net was used for EM scanning to have more DM at the surface.
Two commercial nets combining PBO and DM were also compared: 1) 6 months old Tsara Boost batch number 187 produced on 08/2018 at Sunpack (specification: 3 g DM/kg net, 11 g PBO /kg net) and 2) 2.5 years old at the time of testing PermaNet 3.0 produced in Vietnam (specification: 4 g DM/kg net, 25 g PBO /kg net on the roof panel) batch number 1062(1)16 produced 07/2016. The two commercial nets were in unopened packages.
Net samplingPrinciple for net sampling
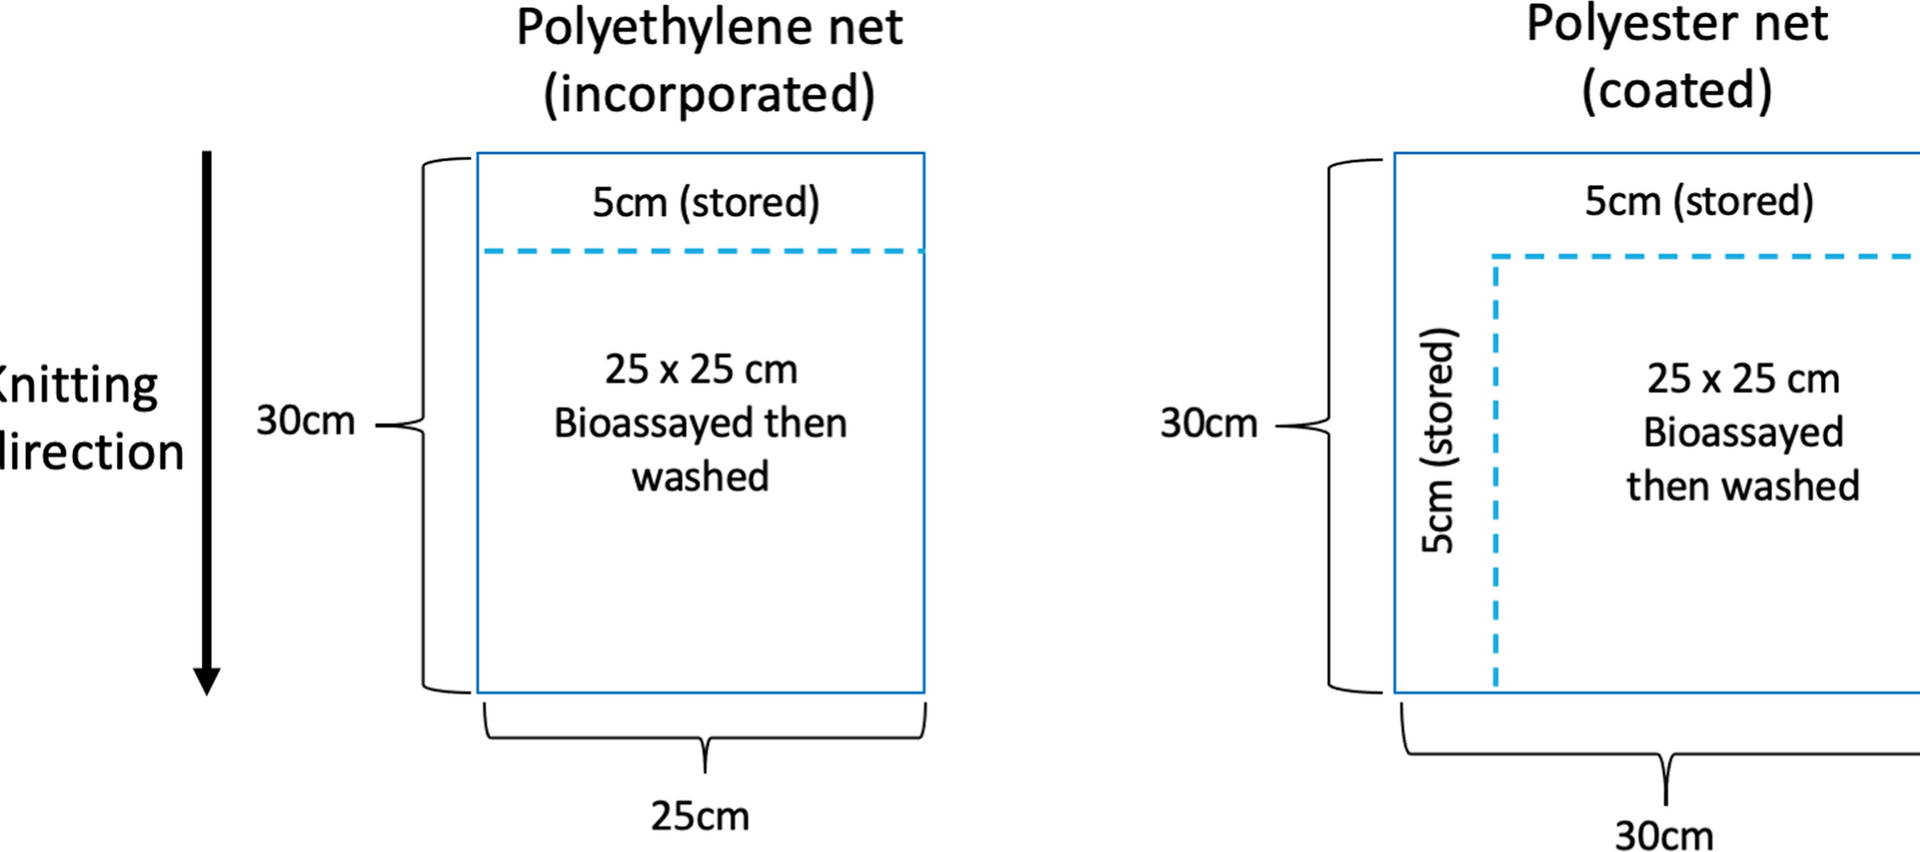
Series of samples were cut from nets along 30 cm wide panels that correspond to the yarns from two bins sitting opposite to each other on a knitting machine and knitted into the panel [4]. A net piece is cut, 25 cm wide × 30 cm high for polyethylene (PET) nets and 30 cm wide and 30 cm high for polyester (PE) nets. Before washing, samples were taken from a single sample by cutting 5 cm from the top for initial chemical analysis of PET nets and 5 cm from the top and side from Polyester (PE) nets. These samples represent the net total AI content before washing or regeneration. Then, further testing is conducted on the remaining piece followed by chemical analysis (Fig. 1). This method assures that samples are as homogenous as possible.
Fig. 1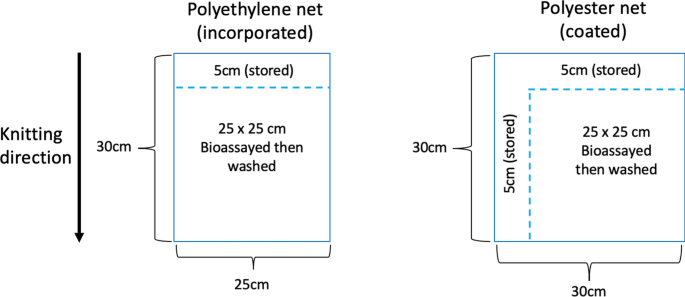
Cutting samples to ensure homogeneity. In ITNs, 30 cm wide panels are made from the yarns from two opposite bins on a knitting machine. There are 5 panels in a 150 cm high net that can be identified by measuring from the bottom of the panel across the knitting direction, 30 cm per band. Here are shown 2 panels from a polyethylene net (PE net) and 2 from a polyester net (PET Net). 25 × 30 cm samples can be cut to fit within a single 30 cm panel. Before And After Method (BAM) surface concentration analysis and associated bioassay: (1) strips are cut BEFORE washing: 5 cm from the top of the panel (polyethylene net) or from the top and sides (polyester net). These are refrigerated until whole chemical content analysis. (2) Bioassay(s) is (are) conducted on 25 × 25 cm samples. (3) Following the bio-assay the AFTER sample is washed once with soap and (4) 25 × 25 cm samples are refrigerated until whole chemical content analysis. (5) Total content chemical analysis is conducted on the BEFORE was and AFTER wash samples. (6) The total content in the AFTER wash is subtracted from the total content BEFORE wash to give the surface concentration that was removed by a single soap washing
Net washing
For regeneration tests, an initial wash off was conducted either with acetone or by 3 repeated soap washing in a day as used in WHO method for determining the regeneration time [6]. Samples from a DM + PBO net were determined for total content by (1) taking a subsample of 5 cm from the top before the washing, (2) conducting bioassay (MKDT) then (3) washing the net once after assay.
Determining surface regeneration time after initial soap or acetone washing and with bioassays using cold acetone method (CAM)
To chemically follow the accumulated effect of insecticide(s) release after the initial wash in the bioassays, at least one sample per time interval is needed since chemical assessments are sample destructive. Two pieces of 25 × 30 cm samples were cut from the sides of each of two PE ITNs drawn from one bale. Since nets are knitted from a multiple of 30 cm wide panels, panels can be identified by measuring the distance from the border. The 25 cm wide test panel was cut inside such a panel to be sure all yarns were from the same set of bins.
In total, 22 samples were cut, each of these were divided in 2 (top piece of 5 cm length and bottom piece of 25 cm length) (Fig. 1). MKDT were double determined from the bottom piece and 2 chemical analyses were made for all samples and wash solutions as detailed below.
One 25×25 cm sample was randomly selected from each panel and stored in foil at 5 °C. This sample was later exposed to cone bioassay to measure mortality and KD induced by the unwashed net. A subsample was extracted for total content and the rest acetone extracted for surface content (Fig. 2). Another sample was washed 3 times, regenerated for 1 day and exposed to cone bioassay. The remaining were either washed in soap water (10 samples) or in acetone (10 samples). The regeneration of surface concentrations after the 3 soap washes or the acetone wash was followed by storing the samples at 30 °C for a selected time. The samples were further divided in a 15 cm length and of 10 cm length, thus containing identical yarns. The 15 cm sample was used for determining the MKDT followed by analysis of total content by GC-FID. The 10 cm long sample was washed once in CIPAC soap water and the insecticide in the soap water extract analysed by HPLC (SWAM). For each day for each wash type, 2 replicates were conducted for (1) initial wash with acetone or (2) initial 3 washes with soap. At each time point: 1, 2, 3, 4, 5, 6, 7, 10, 15, 20 days, the net samples were tested using MKDT bioassays, total content, and total surface content as measured in cold acetone (CAM).
Soap washing
Net washing was performed using soap solution and an oscillatory water bath [6]. Samples were washed three times at the start of the experiment to remove insecticide on the ITN surface. The CIPAC soap solution was prepared by heating one bottle of polyoxyethylene glycol (25) monostearate (CAS number 9004-99-3 or 37231-60-0) to approximately 50 °C to melt, inverting the bottle several few times to ensure homogeneity. This was added to 80 ml of water, 12 g of sodium oleate (CAS number 143-19-1) and 8 g of polyoxyethylene glycol (25) monostearate in a glass flask and the mixture is heated to approximately 50 °C, inverting frequently until the mixture became clear and homogeneous.
Net samples were individually introduced into 1 L glass bottles containing 500 ml CIPAC MT 195 soap solution (2 g/L). The bottle was capped with a steel lid and placed in a 30 °C ± 2 °C water bath (Julabo SW22) in an upright position and shaken for 10 min after which the piece of netting was removed with tweezers and excess fluid removed by gently shaking. After washing, the piece of netting was rinsed twice in deionised water. For each rinse, the piece of netting was added to a 1 L glass bottle containing 500 ml of de-ionized water at 30 °C ± 2 °C. The bottle was capped with a steel lid, placed in a water bath and shaken for 10 min after which the net sample was removed using tweezers. This procedure was repeated, and after the second rinse, excess water was removed from the net sample and allowed to dry on a line for 30 min at room temperature (27 °C ± 5 °C) out of direct sunlight. Net pieces were dried for two hours on a line in the dark. Once dry, the net sample was wrapped in aluminium foil and stored at 30 °C in an incubator (Memmert UFE400/G410.2367) until bioassay and single soap washing.
Acetone wash
Net samples were individually introduced into 1 L glass bottles containing 500 ml cold acetone (20ºC) and soaked for 10 min after which the piece of netting was removed with tweezers and excess fluid removed by gently shaking into the bottle. Samples were then airdried as above.
Wash resistance testing
To test wash resistance, washes were conducted on the same netting pieces and analysed after 1, 3, 5, 10, 15 and 20 washes.
Chemical analysisStandard chemical analysis
Biolytrics Laboratories in Hanoi (BLH) used an ISO confirmed method for determining deltamethrin content in the nets as described in CIPAC/4682/m [16] that was developed by the Walloon Agricultural Research Centre in Gembloux, Belgium (WHO reference laboratory for quality control of pesticides). In short, the net piece is cut into very small pieces with an acetone cleaned scissor. Three analytical portions of 500 mg (exact weight from analytical balance, TE214S, 10–4 Sartorius) each are put into 3 conical flasks with 24 ml xylene and 1 ml of the internal standard solution mixed thoroughly at 20 °C. The flasks are connected to a reflux condenser system and heated to reflux at 130 °C for 60 min for completely dissolution of the samples. The solutions are cooled down to 25 °C and the flasks are filled up to volume with xylene (Xylene AR, Xilong Scientific, China). The solutions are filtered through a 0.2 μm nylon filter and 2 ml are transferred to injection vial and injected into the Gas Chromatograph with flame ionization detector (GC-FID 7890A Agilent) for analysing. Two samples are taken from each solution and injected separately. To validate the GC-FID method and know the net variations, analysis and reanalysis was carried out on the same piece of nets and compared to results of using the CIPAC defined HPLC method, CIPAC method 333/LN/(M2)/ (HPLC–DAD 100 Agilent). For these analyses, the net samples were cut into 5–10 mm pieces, that were mixed and portions from this mix were weighed into analytical portions and treated according to the specifics of each method. Both methods include the creation of calibration curves where known amount of analytical grade DM (Deltamethrin PESTANAL®, purity 99%, Sigma-Aldrich) or PBO (Piperonyl Butoxide PESTANAL®, purity 99%, Sigma-Aldrich) were injected in a serial dilution. Environmental conditions in the analytical lab were kept at 22 ± 2 °C, RH: 60% ± 10 °C.
Chemical analysis of cold acetone method (CAM) “wash off”
Wash in cold (20 °C) acetone (Acetone AR, Duc Giang Chemicals, Vietnam, purity 99.5%) was chosen to remove surface insecticides and used for a “clean start”, to determine surface concentrations and to estimate the ideal regeneration time, meaning stabilized level of insecticide after a clean start. After extraction of AIs in net samples by acetone at 20 °C, the acetone solutions were dried under nitrogen gas flow, then redissolved in xylene and analysed for determination of the AIs contents (DM and PBO) by GC-FID as outlined above. Cold acetone was chosen because it dissolves DM (s = 500 g/l at 20 °C) and piperonyl butoxide (s = 900 g/l at 20 °C) but does not swell polyethylene and should therefore not extract from the PE matrix. For “washing” of a net sample (25 × 25 cm), the sample was immersed in 20 °C acetone in a bottle hold in a temperature regulated bath (Julabo SW22) for 10 min. To determine amount extracted by cold acetone extraction, 1 g samples were cut from the test piece and immersed in Erlenmeyer cone bottles for 10 min at 20 °C in acetone. The analysis showed that to be sure to have all surface PBO dissolved, 99 g acetone had to be used. For DM, no change in extracted DM was found between 10 and 50 g acetone for a 1 g sample. After extraction of AIs in net samples by acetone at 20 °C, the acetone solutions were dried under nitrogen gas flow, then redissolved in xylene and analysed for determination of the AIs contents (DM and PBO) by GC-FID as outlined above.
Chemical analysis of soap washing method (SWAM)
DM and PBO were analysed in soap water used for washing samples. They were extracted with dichloromethane (Dichloromethane 24,233-1L-R, Sigma Aldrich) and determined by HPLC–UV using an external calibration standard. In short, 15 g sodium chloride is added to 100 ml of the soap solution with insecticides and mixed until dissolving completely. The solution was shaken 15 min thrice with 50 mL, 30 mL and then 20 mL of dichloromethane. The extracted dichloromethane solutions were filtered through a filter containing anhydrous sodium sulphate and combined into 100 mL-glass bottle. The dichloromethane solution was completely dried under a nitrogen stream (or a vacuum rotary evaporator). Finally, the residue was redissolved in 2 mL of External Standard (Mixture of solvents: Isooctane: dioxane (80:20, v/v) as described in the CIPAC 333 LN method and transferred to a HPLC vial. Then 10 µl was injected into HPLC after the injection of the calibration solution. Peaks of PBO and DM were read on the same graphs together with peak of the calibration and the concentration in the solution was calculated. Dosage per kg net was then calculated from the volume of soap water and weight of the net sample.
Surface concentration using before and after method (BAM)
For each sample used in wash tests or bioassays (Fig. 1), the upper 5 cm net (PE netting) or the L-shaped 5 cm wide (PET netting) was cut off to determine the total concentration (= surface + inside yarn or inside coating) of the insecticide before the first wash (\({C}_{0}\)). Concentration of the rest of the net after the wash was (\({C}_{1}\)). The difference between the concentrations (\({C}_{0}-{C}_{1}\)) corresponds to the amount lost in the washing process. If the washing is an acetone washing (PE nets only), this amount is the insecticide at the surface of the yarn before the washing. The results are given as
$$C_{Surf} = \left( {C_{0} – C_{1} } \right)$$
Or as a percentage of the initial concentration of DM as expressed in the equation below:
$$C_{Surf} = \left( {C_{0} – C_{1} } \right)/C_{0} *100$$
Comparison of pyrethroid susceptible and pyrethroid resistant strains by MKDT
The samples from the acetone or soap wash test series from two deltamethrin PBO ITNs were tested for each day with both the pyrethroid susceptible and the pyrethroid low sensitive strains. MKDT was determined on day 0 (before washing) then on days 1, 2, 3, 5, 7 and 10 post-washes (Fig. 2).
Fig. 2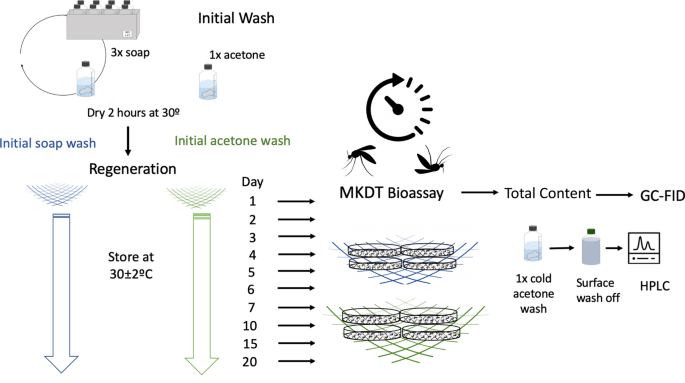
The regeneration of insecticides after initial soap or acetone washing were compared by analysing insecticide content in samples from panels of a net. For each panel samples were tested after a period of several days after the initial wash. Twin samples were analysed for MKDT and total content or extracted with cold acetone. Samples were either initially washed 3 times with soap or dipped in cold acetone to remove the surface content of insecticide. ITNs were then stored under controlled conditions at 30ºC for up to 20 days so that insecticide could be restored to the surface (regenerate) through migration. On each sampling day, 2 samples were bioassayed using the median knock down time (MKDT) with pyrethroid susceptible Anopheles dirus or pyrethroid resistant Culex quinquefasciatus S-lab mosquitoes and then the total content was measured using Gas Chromatography flame ionisation detection (GC-FID. For the two twin samples, surface extraction with cold acetone were analysed using High Pressure Liquid Chromatography (HPLC).
Comparing the two chemical methods to determine surface concentrations
Three samples of Tsara Boost had total content of DM and PBO determined, then washed 3 times and the total content was determined again, before and after determination (BAM) of chemical content. The content of DM and PBO in the 3 soap water solutions were determined (SWAM) and the residual DM and PBO were re-determined after the first extraction from the wash water to measure if the process was complete.
Wash resistance using MKDT and surface concentrations
Two DM + PBO nets had their regeneration time measured by MKDT. This interval was then applied for a standard laboratory wash/bioassay and chemical analysis following the standard WHO protocol [6] with analysis before wash, after 1, 3, 5, 10, and 15 washes (20 wash omitted in error). Bioassays were performed with both the pyrethroid susceptible and the pyrethroid resistant strains on the same pieces of nets the same day.
Mosquito strains
Anopheles dirus received from NIMPE (National Institute of Malaria, Parasitology and Entomology) in 2008 and Culex quinquefasciatus-S-Lab originating from the University of California and transferred from IRD in Montpellier (Ref V.3.2.1.L.FR.4) to NIMPE and then to Biolytrics Laboratories, Hanoi. They were reared according to the guidelines of the Malaria Research and Reference Reagent Resource Centre, MR4 [17] for Anopheles. Larvae are fed a powdered mix of 6 g bread flower, 2 g shrimp powder, 2 g chickpea flour, 1 vit B pill B1 and 110 g Aquafin red flakes for aquarium fish. Adults are fed 10% glucose on cotton wool. Females are blood-fed on live White Swiss female mice, weight 21–24 g. Anopheles dirus was confirmed fully susceptible at the time of testing [18]. The Cx. quinquefasciatus strain has low susceptibility to pyrethroids partially restored by PBO [18]. For all bioassays, 2–5 days old, non-blood fed females with access to sugar water were used.
BioassaysWHO cone bioassays
Five mosquitoes were introduced into a cone fixed on a test ITN sample held at a 45º angle, removed after three minutes and transferred to a paper cup and provided with with sugar water and kept at 25–27 °C, 80% RH. Knock-down was observed after 60 min (KD60) and mortality after 24 h (M24). This was repeated ten times so that 50 mosquitoes exposed per net sample, and 2–4 samples were tested per panel.
Median knock down time
For MKDT data, 4 groups of 11 mosquitoes were placed under petri-dishes fixed on a test ITN sample and the knock down time was followed from the first to the 9th mosquito using a stopwatch. Median knock down was measured as the time of mosquito number 6 to be knocked down or calculated from the linear correlation curve of KDT to number of mosquitoes. This was repeated 2 times per net sample, and 2–4 samples were tested per panel.
EM scanning
DM and DM-PBO net samples were analysed by EM scanning before and after soap wash or acetone dipping. The samples were coated with carbon graphite and scanned with electron microscope (Quanta 450, FEI, USA). This allowed us to see surface particles including DM crystal particles [19]. Secondary electronic imaging was obtained by collecting back scattered electrons (BSE). The back scattered electrons provide a diffuse reflection where the intensity of the back scattered electrons depends on the atomic weight of the atoms hit. that informs on the distribution of relatively heavy atoms like the halogen bromine. DM holds 2 bromine atoms. The back scanning thus reveals if there is bromine and therefore probably deltamethrin in areas of the yarn where there are no crystal particles, and thus find amorph deltamethrin. The analysis were carried out at the Centre for Excellence in Analysis and Experiment, Hanoi University, Vietnam (http://ceae.humg.edu.vn/do-sem/).
Data analysis
Data were entered into Excel and analysed in Stata 17.0 statistical software StataCorp, USA. Comparison between GC FID and HPLC was conducted using Two-sample Wilcoxon rank-sum to test for a difference between methods for each component: DM, PBO and R-isomer of DM.
Median Knock Down Time (MKDT) for the 6th mosquito was calculated from a linear regression of Knock down time for mosquito numbers 1 to 9. The correlation between 1) surface concentration by CAM and MKDT for An. dirus and 2) correlation between MKDT for An. dirus and Cx. quinquefasciatus was calculated with Pearsons correlation coefficient. The regeneration time was calculated as the first day that MKDT was within 20% of the 20-day MKDT for the net in test or the normalized change in surface concentration change reach 80% of the change. Comparison between MKDT for Tsara® Boost and PermaNet® 3.0 was conducted using Two-sample Wilcoxon rank-sum test.