
Enrichment of EMT in CRC
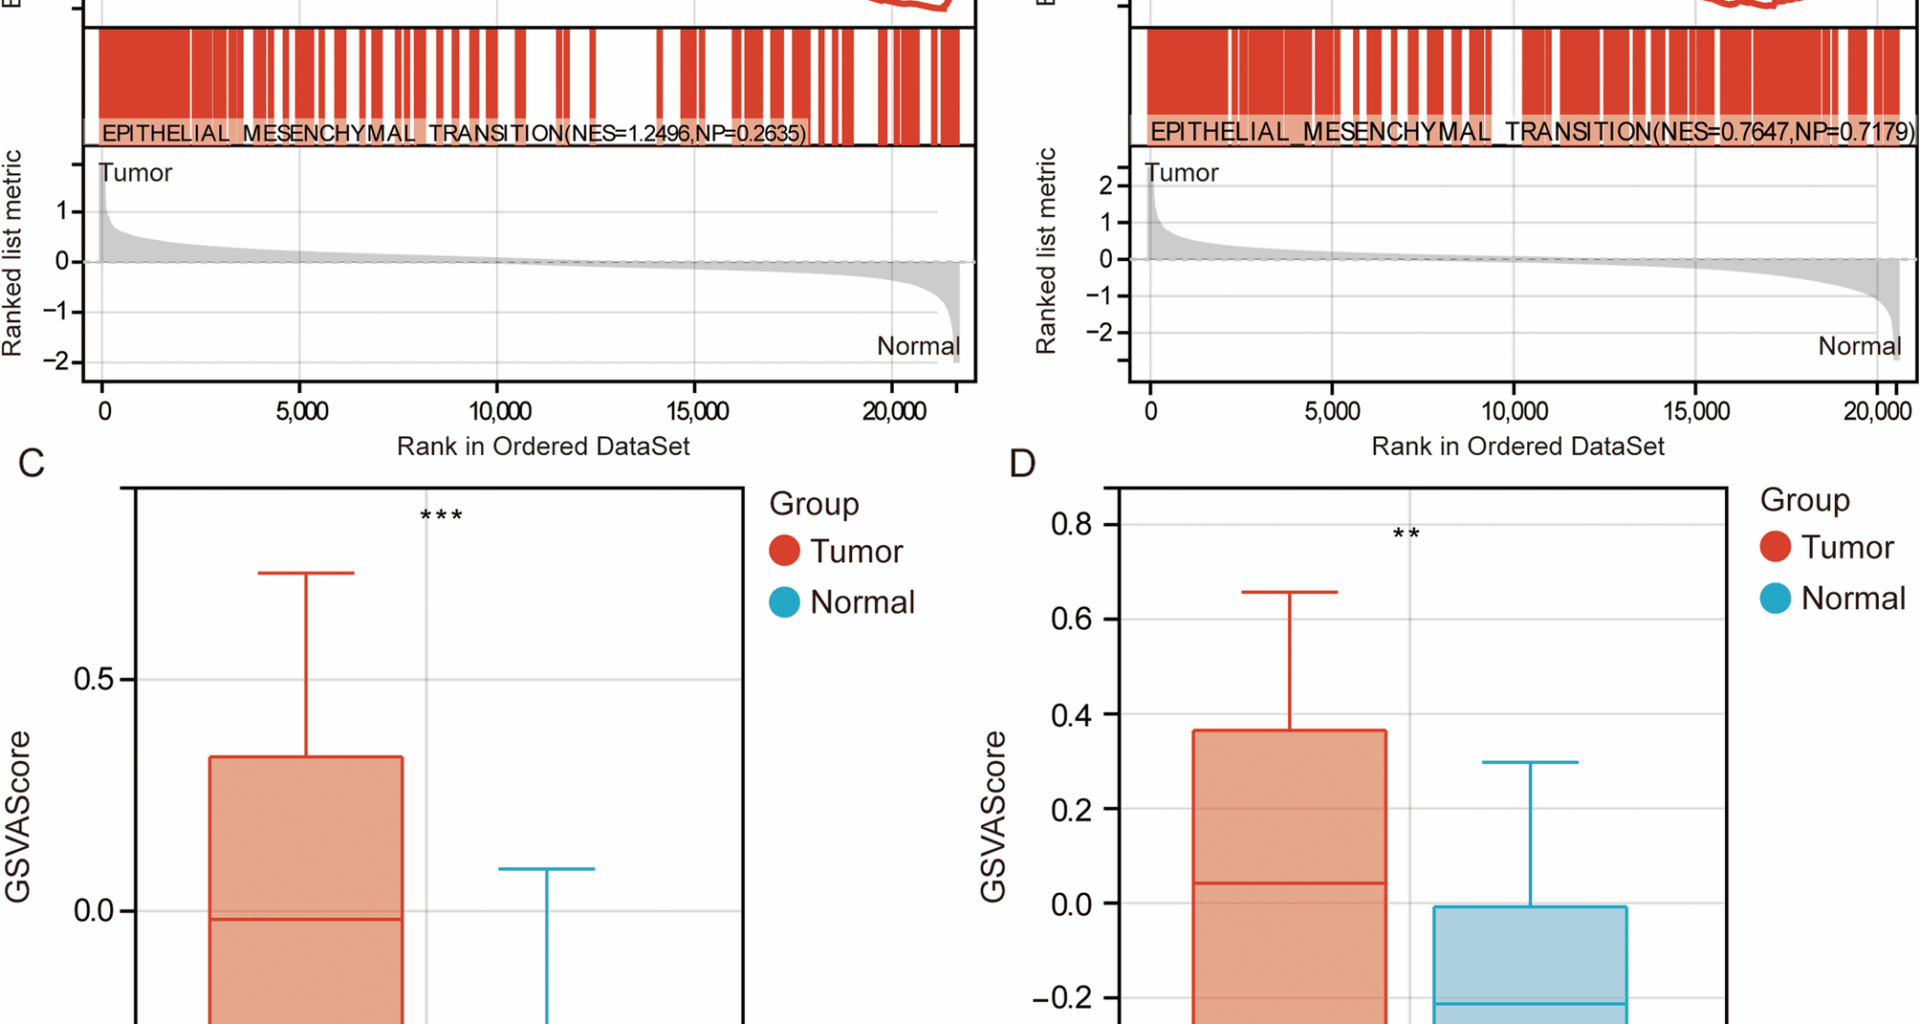
Analysis of gene expression data from the GSE39582 and TCGA datasets revealed that GSEA results indicated significant enrichment of EMT in CRC, suggesting that EMT might play a critical role in the initiation and progression of CRC (Fig. 1A, B). The GSVA scores showed that EMT activity was significantly higher in CRC samples compared to the control group (Fig. 1C, D). Differential expression analysis identified 2409 DEGs between CRC and control samples in the GSE39582 dataset (Fig. 2A), 11,446 DEGs between metastatic and primary CRC samples in the GSE131418 dataset (Fig. 2B), and 4810 DEGs between CRC and control samples in the TCGA dataset (Fig. 2C). Intersection analysis with EMT-related genes identified 36 EMT-DEGs (Fig. 2D). KEGG pathway enrichment analysis revealed that these EMT-DEGs were significantly enriched in several key signaling pathways, including ECM-receptor interaction, Focal adhesion, and the PI3K-Akt signaling pathway (Fig. 2E).
Fig. 1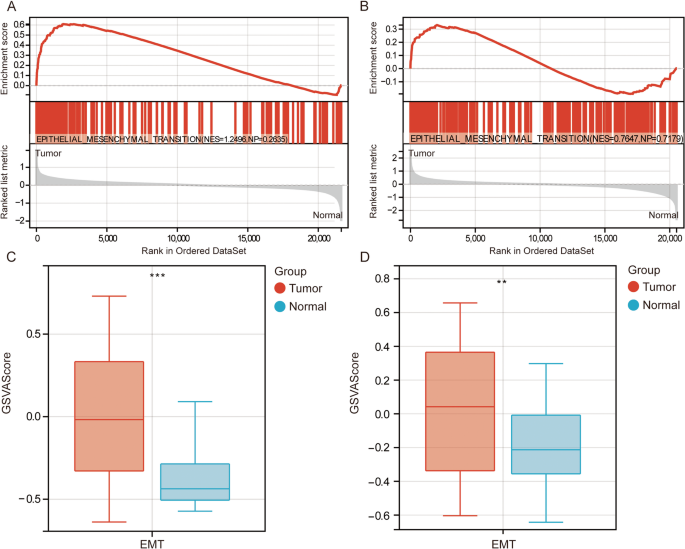
Enrichment analysis of EMT in CRC. GSEA results indicate significant enrichment of epithelial-mesenchymal transition (EMT)-related gene sets in CRC samples compared to control samples in GSE39582 (A) and TCGA (B). NES, normalized enrichment score; NP, normalized P value. C GSVA analysis of EMT activity scores across normal and CRC in GSE39582 dataset. n = 585. D. GSVA analysis of EMT activity scores across normal and CRC in TCGA. n = 328. **P < 0.01, ***P < 0.001
Fig. 2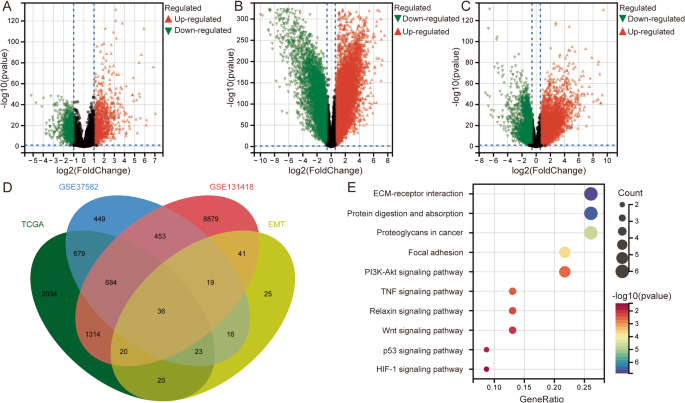
Differentially expressed genes and pathway enrichment analysis. A Volcano plot showing the distribution of differentially expressed genes between colorectal cancer and control samples in GSE39582. B Volcano plot showing the distribution of differentially expressed genes between metastatic CRC and primary CRC in GSE131418. C Volcano plot showing the distribution of differentially expressed genes between colorectal cancer and control samples in TCGA. D The intersection between differentially expressed genes and EMT-related genes. E KEGG pathway enrichment analysis of the 36 EMT-DEGs
Machine learning screening for EMT-related prognostic genes
The 35 constructed machine learning models were used to train and evaluate gene expression data from CRC patients to identify key genes associated with prognosis. Among all models, the RSF model demonstrated the strongest prognostic predictive capability, with the highest AUC value (Figure S1A). The RSF model included 22 EMT-DEGs (Figure S1B).
Based on the RSF model scores, CRC patients were stratified into high-risk and low-risk groups in the GSE39582 (Fig. 3A) and TCGA datasets (Fig. 3B). Kaplan-Meier survival curve analysis showed that patients in the high-risk group had significantly worse survival outcomes compared to those in the low-risk group (P < 0.001, Fig. 3C, E). The time-dependent ROC curves demonstrated the prognostic diagnostic performance of the RSF model scores, with AUC > 0.9 in GSE39582 (Fig. 3D) and AUC > 0.6 in TCGA (Fig. 3F).
Fig. 3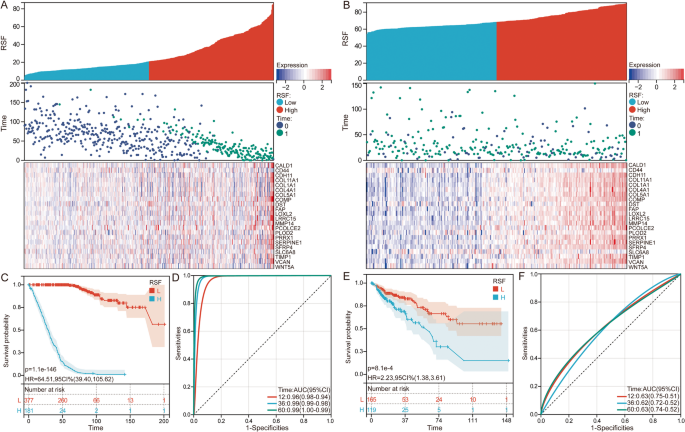
Prognostic stratification of CRC patients using the RSF model. A Distribution of RSF risk scores, survival status, and gene expression in GSE39582. B Distribution of RSF risk scores, survival status, and gene expression in TCGA. C Kaplan-Meier survival curves illustrating overall survival differences between high-risk and low-risk groups stratified by RSF model scores in GSE39582. D Time dependent ROC curve of RSF risk scores in GSE39582. E Kaplan-Meier survival curves illustrating overall survival differences between high-risk and low-risk groups stratified by RSF model scores in TCGA. F Time dependent ROC curve of RSF risk scores in TCGA
The Cox regression forest plot indicated that the high expression of PCOLCE2 and COMP was significantly associated with poor prognosis (Fig. 4A). Notably, COMP was significantly involved in the ECM-receptor interaction, Focal adhesion, and PI3K-Akt signaling pathways, highlighting its critical role in tumor progression. Kaplan-Meier survival curve analysis further confirmed that patients with high COMP expression had worse prognoses (Fig. 4B).
Fig. 4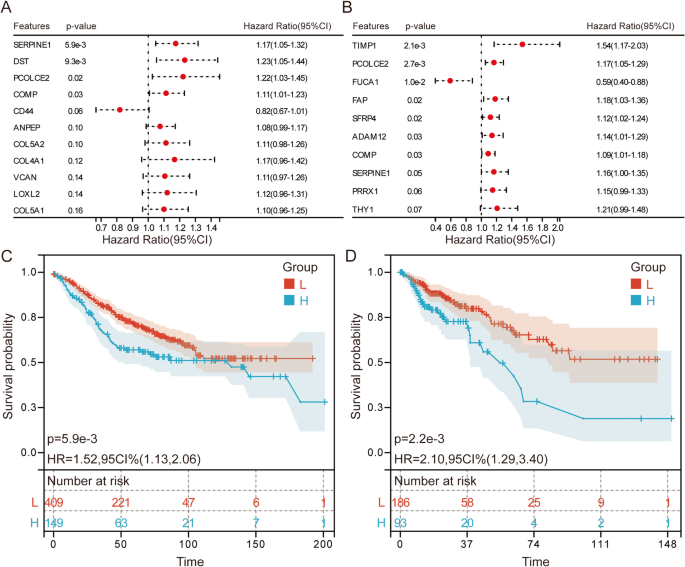
Cox regression forest plot and Kaplan-Meier survival analysis. Cox regression forest plot showing the hazard ratios (HR) and 95% confidence intervals (CI) for EMT-related genes in RSF model of GSE39582 (A) and TCGA (B). Kaplan-Meier survival curves for patients stratified by COMP expression levels in GSE39582 (C) and TCGA (D)
Single-cell transcriptomic analysis reveals tumor-specific expression of COMP and EMT-DEGs
To further dissect the cell-type-specific expression of COMP and EMT-related genes in CRC, we performed scRNA-seq analysis and identified 23 transcriptionally distinct clusters (Figure S2A). A total of 10 major cell types were identified following dimensionality reduction and unsupervised clustering, including epithelial cells, fibroblasts, macrophages, CD4 + and CD8 + T cells, B cells, Tregs, plasma cells, endothelial cells, mast cells, and natural killer T (NKT) cells (Figure S2B, S2C). Feature plots (Figure S2D) showed that COMP expression was specifically localized to fibroblasts and epithelial with clusters enriched for EMT-related genes, including COL1A1, MMP2, TIMP1, and EPCAM.
Detection in primary and metastatic CRC patients
H&E staining showed that the stromal regions in metastatic CRC tissues were looser, with significantly higher inflammatory cell infiltration compared to primary CRC tissues (Fig. 5A). RT-qPCR results demonstrated that in metastatic CRC tissues, the mRNA levels of COMP, Collagen 1, Laminin, Hyaluronan, EpCAM, and N-cadherin were significantly higher, while E-cadherin expression was significantly lower compared to primary CRC tissues (Fig. 5B). Western blot results showed that the protein levels of COMP, Collagen 1, Laminin, Hyaluronan, EpCAM, N-cadherin, MMP2, MMP9, and TIMP1 were significantly upregulated, while E-cadherin expression was significantly downregulated in metastatic CRC tissues compared to primary CRC tissues (Fig. 5C, Figure S3).
Fig. 5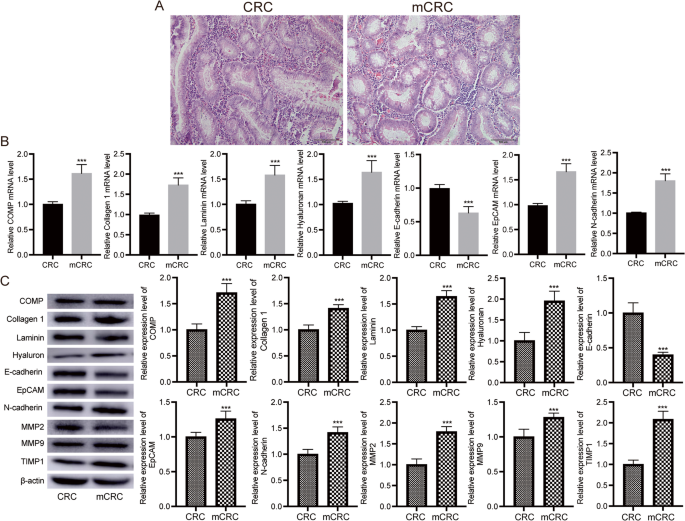
Analysis of pathology and molecular in primary and metastatic CRC. A Representative hematoxylin and eosin (HE) staining of primary and metastatic CRC. Bar = 100 μm. B RT-qPCR analysis of key EMT-related genes in primary and metastatic CRC tissues. n = 20. Data are shown as mean ± SD. ***P < 0.001. C Western blot analysis of key EMT-related genes in primary and metastatic CRC tissues. Original blots are presented in Figure S3. n = 20. Data are shown as mean ± SD. ***P < 0.001
Effect of COMP on the function of HT-29 cells
RT-qPCR and Western blotting demonstrated that HT-29 cells showed the highest COMP mRNA expression, followed by SW480 and HCT116 (Figure S4).
After transfecting HT-29 cells with si-COMP, the knockdown efficiency was confirmed using RT-qPCR and Western blot. Transfection with siRNA 1574 significantly reduced COMP mRNA and protein expression levels (Figure S5A). RT-qPCR results indicated that after COMP knockdown, the mRNA levels of Collagen 1, Laminin, Hyaluronan, EpCAM, and N-cadherin were significantly decreased, while E-cadherin levels were significantly increased in HT-29 cells (Fig. 6A). Western blot results showed that in COMP-knockdown HT-29 cells, the protein levels of Collagen 1, Laminin, Hyaluronan, EpCAM, N-cadherin, MMP2, MMP9, and TIMP1 were significantly reduced, whereas E-cadherin expression was significantly elevated (Fig. 6B, Figure S5B).
Fig. 6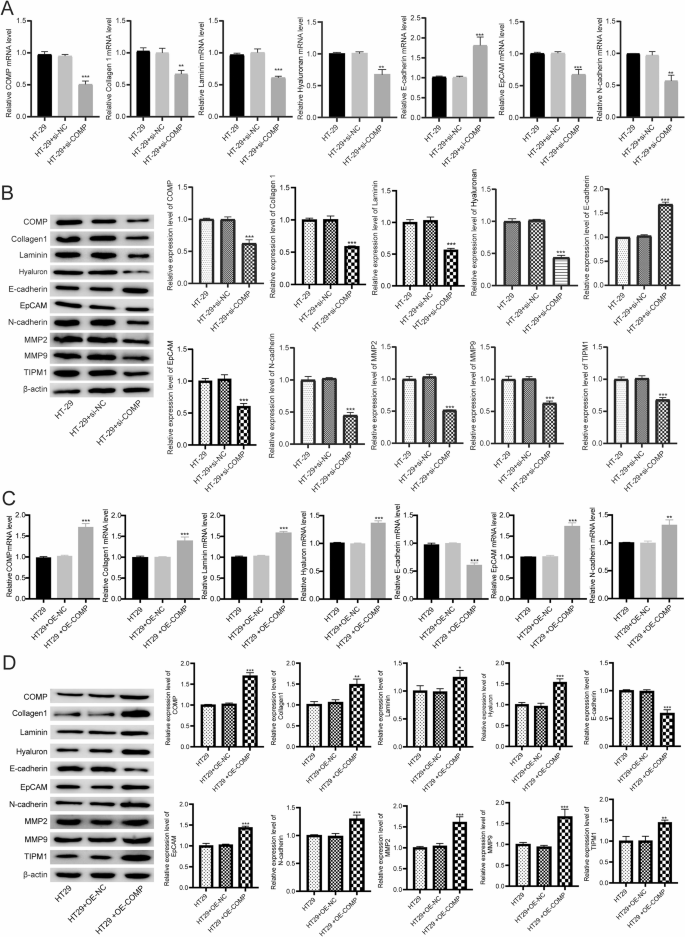
Effect of gene expression through regulating COMP in HT-29 cells. A RT-qPCR analysis of EMT-related genes after COMP knockdown. n = 9. Data are shown as mean ± SD. **P < 0.01, ***P < 0.001. B Western blot analysis of EMT-related genes after COMP knockdown. Original blots are presented in Figure S5B. n = 9. Data are shown as mean ± SD. ***P < 0.001. C RT-qPCR analysis of EMT-related genes after COMP overexpression. n = 9. Data are shown as mean ± SD. **P < 0.01, ***P < 0.001. D Western blot analysis of EMT-related genes after COMP overexpression. Original blots are presented in Figure S6. n = 9. Data are shown as mean ± SD. *P < 0.05, **P < 0.01, ***P < 0.001
To further validate the role of COMP in promoting EMT, we performed COMP overexpression experiments in HT-29 cells. RT-qPCR showed a significant increase in COMP, Collagen 1, Laminin, Hyaluronan, EpCAM, and N-cadherin and a significant reduced in E-cadherin mRNA expression following transfection with pcDNA3.1-COMP (Fig. 6C). Western blot also confirmed a significant increase in COMP, Collagen 1, Laminin, Hyaluronan, EpCAM, N-cadherin, MMP2, MMP9, and TIMP1 protein expression, and a significant reduced in E-cadherin following transfection with pcDNA3.1-COMP (Fig. 6D, Figure S6).
Additionally, we observed that E-cadherin expression was markedly downregulated, whereas both N-cadherin and EpCAM levels were significantly upregulated following TGF-β1 stimulation (Figure S7). Interestingly, COMP knockdown further increased E-cadherin expression, while reduced N-cadherin and EpCAM levels, compared to TGF-β1-treated controls. To investigate whether COMP affects EMT-related gene expression at the transcriptional level, we conducted dual-luciferase reporter assays targeting the promoter regions of EpCAM. The results showed that COMP overexpression significantly enhanced luciferase activity (Figure S8), suggesting transcriptional regulation.
These findings were further supported by migration and invasion assays. Transwell experiments demonstrated that COMP knockdown significantly reduced both migration and invasion capabilities, while COMP overexpressing significantly increased both migration and invasion capabilities of HT-29 cells (Fig. 7A and B), suggesting that suppression of COMP impairs the EMT-mediated motility phenotype. Additionally, CCK-8 assay results showed that COMP knockdown significantly inhibited the proliferation of HT-29 cells, with the proliferation rates at 24 and 48 h post-si-COMP transfection, and COMP overexpressing HT-29 cells exhibited increased proliferation (Fig. 7C). TUNEL assay demonstrated that COMP knockdown significantly increased the apoptosis rate of HT-29 cells, and COMP overexpressing reduced apoptosis rates (Fig. 7D).
Fig. 7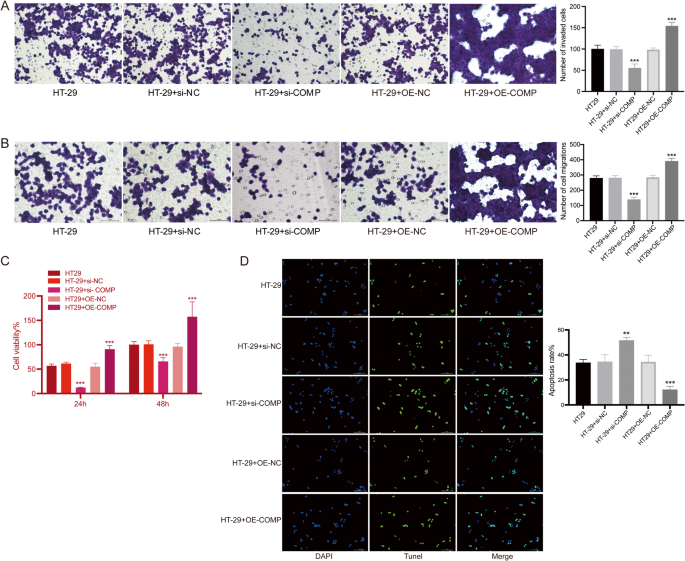
Effects of COMP on HT-29 cell invasion, migration, proliferation and apoptosis. A Representative images and quantification of invaded cells from the Transwell invasion assay. Bar = 100 μm. B Representative images and quantification of migrated cells from the Transwell migration assay. Bar = 100 μm. C Cell proliferation detected by CCK-8. D Cell apoptosis detected by Tunel. Bar = 100 μm. n = 9. Data are shown as mean ± SD. **P < 0.01, ***P < 0.001
COMP promotes CRC liver metastasis in vivo
To confirm the in vitro findings, we established an in vivo mouse model of CRC liver metastasis. Bioluminescence imaging revealed that mice in the COMP-OE group developed significantly higher hepatic tumor burden compared to controls, while the sh-COMP group exhibited markedly reduced liver metastatic signals (Fig. 8A). Molecular analysis of metastatic liver lesions by RT-qPCR demonstrated that the COMP-OE group showed significantly increased mRNA levels of Collagen I, Laminin, Hyaluronan, EpCAM, and N-cadherin, with a concomitant reduction in E-cadherin expression, indicating activation of the EMT program. In contrast, the sh-COMP group showed the opposite expression trend, consistent with EMT suppression (Fig. 8B).
Fig. 8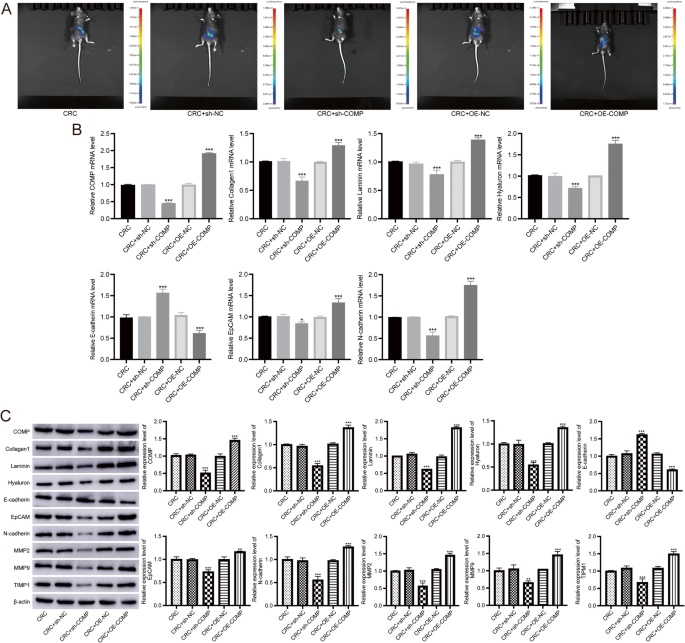
In vivo validation of COMP-mediated promotion of CRC liver metastasis and EMT activation. A Representative bioluminescence imaging of Liver metastases in 8 weeks after intrasplenic injection of HT-29 cells stably overexpressing COMP (COMP-OE), COMP knockdown (sh-COMP), or control vector. B RT-qPCR analysis of ECM and EMT-related genes in liver metastatic lesions. C Western blot analysis of key ECM/EMT markers in liver metastases. Original blots are presented in Figure S9. Data are presented as mean ± SD, n = 6 mice per group. **P < 0.01, ***P < 0.001
Western blot analysis further confirmed these findings at the protein level, the COMP-OE group exhibited elevated expression of Collagen I, Laminin, Hyaluronan, EpCAM, N-cadherin, MMP2, MMP9, and TIMP1, while E-cadherin was significantly downregulated. Conversely, the sh-COMP group showed a notable reduction in these ECM/EMT markers and restoration of E-cadherin expression (Fig. 8C, Figure S9).
COMP modulates PI3K-AKT signaling pathway
Furthermore, we examined PI3K-AKT signaling activity. Western blotting revealed that COMP knockdown significantly reduced the levels of phosphorylated PI3K and AKT, while total PI3K and AKT remained unchanged. Conversely, COMP overexpression enhanced the phosphorylation of both PI3K and AKT, indicating activation of the pathway (Fig. 9A, Figure S10A).
Fig. 9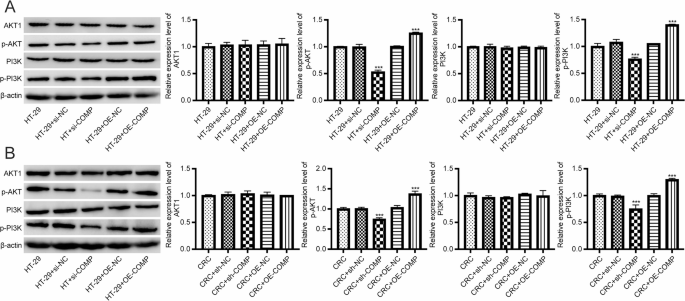
Detection of PI3K-AKT signaling pathway. A Western blot analysis of PI3K-AKT in HT-29 cells. Original blots are presented in Figure S10A. n = 9. Data are shown as mean ± SD. *** P<0.001. B Western blot analysis of PI3K-AKT in liver metastases. Original blots are presented in Figure S10B. Data are presented as mean ± SD, n = 6 mice per group. ***P < 0.001
Importantly, we also observed that phosphorylation of PI3K and AKT was significantly enhanced in the COMP-OE group in CRC mice, whereas total PI3K and AKT levels remained unchanged. In the sh-COMP group, phosphorylation of both proteins was markedly suppressed (Fig. 9B, Figure S10B).