
Patient characteristics
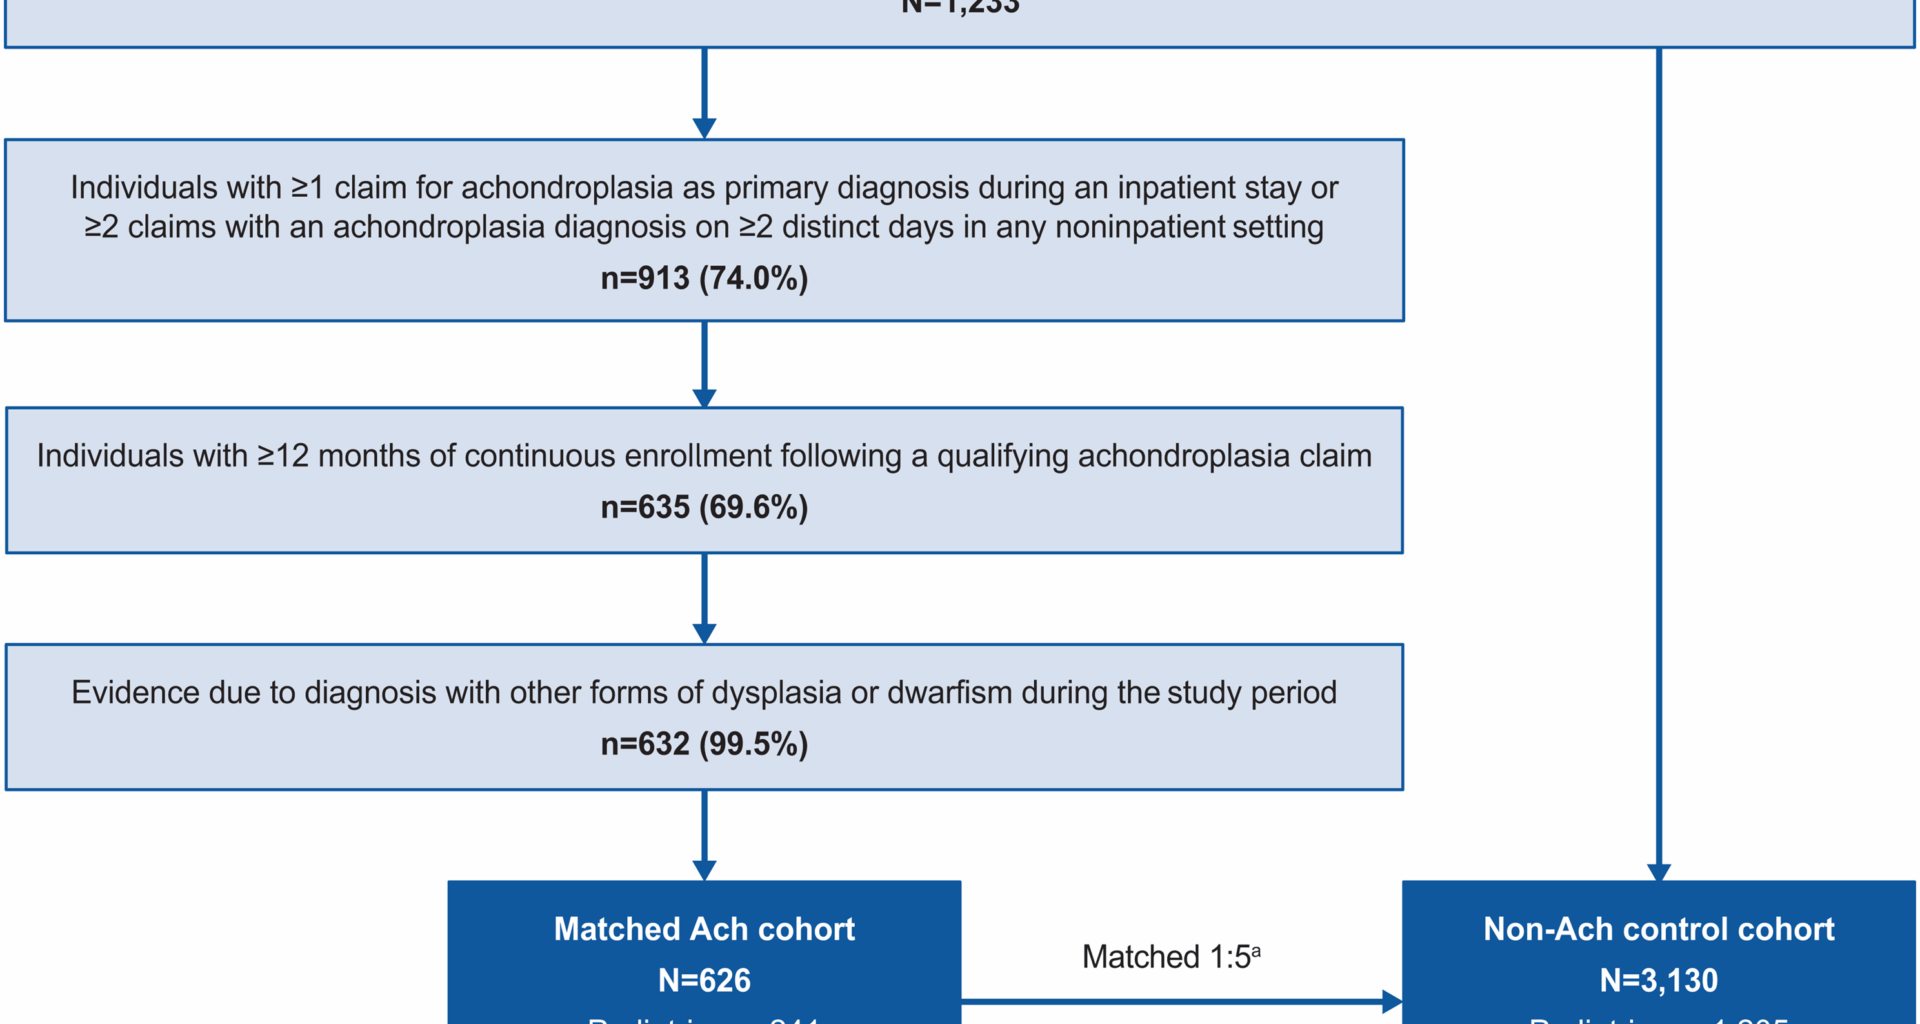
Overall, 626 people living with achondroplasia were matched with 3,130 people in the control cohort (Fig. 1). Mean (SD) age overall was 33.2 (24.4) years for people living with achondroplasia and 33.1 (24.3) years for the matched nonachondroplasia controls; both cohorts were 56.2% female. Subgroups of 241 pediatric and 385 adults with achondroplasia were matched with 1,205 and 1,925 nonachondroplasia controls, respectively. In children, mean (SD) age was 7.9 (5.4) years for achondroplasia and nonachondroplasia controls, 53.1% were female, and 54.4% of children with achondroplasia and 48.2% of matched nonachondroplasia controls were white (Table 1). In adults, mean age (SD) was 49.0 (17.3) years and 48.9 (17.1) years for achondroplasia and nonachondroplasia controls, respectively, and 58.2% in both groups were female. The majority of adults with achondroplasia and matched nonachondroplasia controls were White (68.8% vs. 68.5%).
Fig. 1
Cohort selection and attrition counts. Ach, achondroplasia; CDM, Optum’s deidentified Clinformatics® Data Mart; ICD, International Classification of Diseases. aPeople living with achondroplasia were matched to 5 people without achondroplasia based on age at index, sex, index date, and length of observation period; matched individuals had to be observable for at least the same number of days as the achondroplasia case
Table 1 Patient characteristics at index date stratified by age and presence of spinal stenosisPatient comorbidities
The proportions of people experiencing different types of comorbidities over all follow-up, stratified by age, are presented in Table 2. A significantly greater proportion of children living with achondroplasia had skeletal complications compared with matched nonachondroplasia controls (62.7% vs. 4.1%; P < 0.01). Among these, the most common skeletal complications observed in children with achondroplasia were leg deformities (32.4% vs. 0.7%; P < 0.01) and spinal canal stenosis (19.1% vs. 0.0%; P < 0.01). Other nonskeletal complications were also more frequently observed in children with achondroplasia than in matched nonachondroplasia controls, including otitis media (55.2% vs. 34.4%; P < 0.01), pain (51.9% vs. 41.7%; P < 0.01), and sleep apnea (39.4% vs. 4.1%; P < 0.01).
Table 2 Comorbidities during all follow-upa stratified by age and presence of spinal stenosis
Adults living with achondroplasia had a significantly higher mean (SD) CCI score than matched nonachondroplasia controls (1.7 [2.2] vs. 1.2 [2.1]; P < 0.01) and a significantly greater proportion had skeletal complications (75.1% vs. 32.9%; P < 0.01). The most prevalent skeletal complications were arthritis/osteoarthritis (48.8% vs. 26.0%), SpS (39.2% vs. 7.2%), and craniocervical foramen magnus stenosis (21.0% vs. 3.3%; all P < 0.01), while the most common nonskeletal complications were pain (85.7% vs. 68.4%), obesity (60.5% vs. 31.5%), and hypertension (59.7% vs. 42.3%; all P < 0.01). Mental health complications were also significantly more prevalent in adults with achondroplasia, including anxiety (42.3% vs. 29.3%) and depression (36.6% vs. 19.8%; both P < 0.01).
HCRU and costs
Annualized HCRU rates and associated healthcare costs over all available follow-up are shown in Table 3; Fig. 2, and Additional file: Table S4. Children living with achondroplasia were more likely to experience inpatient admissions (36.9% vs. 15.4%; P < 0.01) and other visits/complementary medicine services (65.1% vs. 42.3%; P < 0.01) than nonachondroplasia controls (Table 3). While the proportion of children with outpatient visits (100.0% vs. 99.3%; P = 0.37), ER visits (43.2% vs. 36.7%; P = 0.07), and pharmacy fills (88.0% vs. 85.7%; P = 0.41) were comparable between children with achondroplasia and nonachondroplasia controls, IRRs (95% CI) comparing the PPY rate of visits consistently indicated statistically significant higher HCRU incidence in children with achondroplasia across outpatient visits (13.18 vs. 6.28 PPY; IRR [95% CI]: 2.10 [2.05 to 2.15]), ER visits (0.30 vs. 0.20 PPY; IRR [95% CI]: 1.47 [1.27 to 1.69]), inpatient visits (0.30 vs. 0.09 PPY; IRR [95% CI]: 3.46 [2.94 to 4.08]), pharmacy fills (7.90 vs. 4.02 PPY; IRR [95% CI]: 1.97 [1.91 to 2.02]), and other visits (10.39 vs. 1.16 PPY; IRR [95% CI]: 8.94 [8.63 to 9.26]) (all P < 0.01).
Table 3 All-cause HCRU during all follow-upa stratified by age and presence of spinal stenosisFig. 2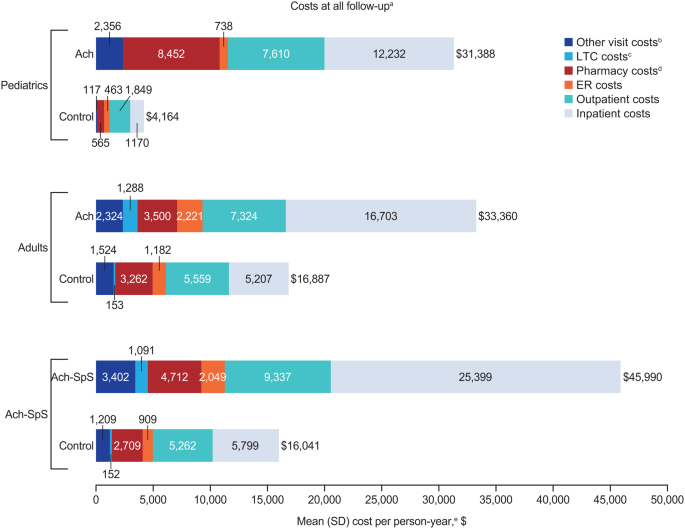
Healthcare costs during all follow-upa stratified by age and presence of spinal stenosis. Ach, achondroplasia; ER, emergency room; LTC, long-term care; SpS, spinal stenosis. aIndividuals had variable follow-up, from index until death, censoring, or loss to follow-up. bOther visits included complementary medicine services (e.g., physical medicine and rehabilitation procedures, physiotherapy, occupational therapy, chiropractic/osteopathic procedures, acupuncture, speech therapy, and medical imaging). cLong-term care days included time spent in assisted living facilities, group homes, skilled nursing facilities, nursing facilities, and hospices; long-term care episodes could have overlapped with other episodes of care and were not mutually exclusive from care in inpatient, outpatient, ER, and other settings. dPharmacy costs were compared between groups using a 2-part model of logistic regression and gamma generalized linear model with identity link. eCosts were compared using generalized linear models with a log link and robust variance. All tests compared people living with achondroplasia with matched nonachondroplasia controls
Mean annualized total healthcare costs were significantly higher in children with achondroplasia ($31,388 vs. $4,164 PPY; mean difference [95% CI]: $27,224 [$20,070 to $35,671]; P < 0.01) compared with matched nonachondroplasia controls (Fig. 2; Additional file: Table S4). The difference in total annualized healthcare costs appeared to be predominantly driven by the large differences in inpatient costs ($12,232 vs. $1,170 PPY; mean difference [95% CI]: $11,062 [$6,823-$16,383]; P < 0.01), pharmacy costs ($8,452 vs. $565 PPY; mean difference [95% CI]: $7,887 [$3,876-$12,672]; P < 0.01), and outpatient costs ($7,610 PPY vs. $1,849 PPY; mean difference [95% CI]: $5,761 [$4,480-$7,396]; P < 0.01).
The proportion of adults living with achondroplasia with outpatient visits (99.5% vs. 97.8%; P = 0.05) and pharmacy fills (96.1% vs. 92.4%; P = 0.01) was slightly but significantly higher than nonachondroplasia controls (Table 3); adults with achondroplasia were also significantly more likely to experience all-cause ER visits (58.4% vs. 40.2%), inpatient admissions (51.7% vs. 25.8%), LTC stays (12.5% vs. 2.7%), and other visits (89.6% vs. 75.6%) (all P < 0.01), compared with nonachondroplasia controls. Comparison of incidence rates for outpatient visits (13.88 vs. 10.04 PPY; IRR [95% CI]: 1.38 [1.36–1.41]), inpatient admissions (0.39 vs. 0.21 PPY; IRR [95% CI]: 1.88 [1.69–2.08]), LTC (1.93 vs. 0.31 PPY; IRR [95% CI]: 6.31 [5.95–6.68]), and other visits (14.06 vs. 5.55 PPY; IRR [95% CI]: 2.53 [2.49–2.58]) indicated a greater HCRU burden in adults with achondroplasia than nonachondroplasia controls (all P < 0.01).
Mean annualized total healthcare costs were significantly higher in adults with achondroplasia ($33,360 vs. $16,887 PPY; mean difference [95% CI]: $16,472 [$11,260-$21,885]; P < 0.01) compared with matched nonachondroplasia controls (Fig. 2; Additional file: Table S4). The difference in total healthcare costs was predominantly driven by the large differences in inpatient admission costs ($16,703 vs. $5,207 PPY, mean difference [95% CI]: $11,496 [$7,910-$15,488]; P < 0.01) and outpatient visit costs ($7,324 PPY vs. $5,559 PPY, mean difference [95% CI]: $1,765 [$498-$3,170]; P = 0.01).
Spinal stenosis subgroup analyses
A subgroup analysis assessed clinical outcomes in people living with Ach-SpS (n = 199; 74.6% >18 years at index date). Skeletal complications were substantially more frequent in the subgroup of people living with Ach-SpS (100.0%) compared with pediatric (62.7%) and adult (75.1%) achondroplasia cohorts (Table 2). The most common skeletal complications in people living with Ach-SpS included spinal canal stenosis (83.9% vs. 19.1% and 39.2% in children and adults with achondroplasia, respectively) and craniocervical foramen magnus stenosis (62.8% vs. 18.3% and 21.0% in children and adults with achondroplasia, respectively). People living with Ach-SpS commonly reported also nonskeletal complications, most frequently pain (86.9% vs. 51.9% and 85.7% in children and adults with achondroplasia, respectively) and other dysplasia or dwarfism (59.3% vs. 34.4% and 57.4% in children and adults with achondroplasia, respectively). While people living with Ach-SpS had comparable prevalences of anxiety and depression compared with adults with achondroplasia, these comorbidities were numerically higher in this group compared with children with achondroplasia (anxiety: 40.2%, vs. 15.8% and 42.3%; depression: 36.2%, vs. 9.1% and 36.6% in children and adults with achondroplasia, respectively).
People living with Ach-SpS frequently experienced inpatient admissions (65.3% vs. 36.9% and 51.7% in children and adults with achondroplasia, respectively). PPY incidence was higher in people living with Ach-SpS subgroup than in children and adults with achondroplasia for outpatient visits (17.47 PPY vs. 13.18 PPY and 13.88 PPY in children and adults with achondroplasia, respectively) and inpatient admissions (0.52 PPY vs. 0.30 PPY and 0.39 PPY in children and adults with achondroplasia, respectively) (Table 3). People living with Ach-SpS incurred substantial annualized total healthcare costs ($45,990 vs. $31,388 and $33,360 in children and adults with achondroplasia, respectively), largely driven by inpatient costs ($25,399 vs. $12,232 and $16,703 in children and adults with achondroplasia, respectively) (Fig. 2; Additional file: Table S4).