
Ethics
This protocol was approved by the institutional review board of Taipei Veterans General Hospital (2015-11-005 C, 2019-02-103 A & 2023-06-024CC). All investigations were performed by Declaration of Helsinki, and written informed consent was obtained from all participants.
Participants
Patients with RCVS were prospectively recruited from the Headache Clinics and Emergency Department in Taipei Veterans General Hospital, a tertiary referral center with over 3000 beds, between June 2018 and April 2023. The RCVS diagnosis was based on the criteria in our previous studies (Supplementary Table 1) [5, 6, 21], which were consistent with the ones in the International Classification of Headache Disorders, 3rd version (ICHD-3) [22]. The RCVS patients with headache onset to MRI intervals ≤ 30 days were defined as acute RCVS (aRCVS) and ≥ 90 days were remission RCVS (rRCVS) [6, 21, 23]. We acquired such definitions based on the criteria “6.7.3.1 Acute headache attributed to RCVS” in the ICHD-3 [22]. The diagnosis was confirmed by three experienced headache specialists (YFW, SJW and SPC). All participants underwent detailed neurological exams and completed thorough headache questionnaires. Although we treated all RCVS patients with nimodipine [24], some aRCVS patients were treated with nimodipine prior to MRI because the excruciating thunderclap headaches were only responsive to nimodpine but not the other painkillers [25]. We further examined the potential nimodipine effects on CBF in aRCVS. All subjects were naïve to other headache preventive medications.
Healthy controls (HCs) were recruited from the adjacent communities. Subjects with known psychiatric disorders, major neurologic deficits, prior cancer, personal or family history (within 2nd degree relatives) of moderate to severe headache were not recruited.
The sample size for this prospective study was determined via a power analysis for a two-group comparison using analysis of covariance (ANCOVA). The calculation utilized a standard two-sided significance level of α = 0.05 and a desired statistical power of 0.80. Based on our previous RCVS study, the required sample size was set to detect an effect size (Cohen’s f) of 0.44 [21]. This power calculation indicated a minimum required total sample of 310 subjects. Considering a constrained recruitment environment during COVID-19, we established a feasible recruitment target with an unequal allocation ratio of approximately 9:1, aiming for 280 RCVS patients and 30 healthy controls (HCs). To strictly follow the regulations in our hospital, this unequal allocation balanced statistical requirements with the logistical challenges of recruiting HCs, particularly during the COVID-19 pandemic. Therefore, the target number of HCs was reduced to approximately 30 to ensure the study remained feasible and timely.
Imaging protocols
All the MR exams were carried out and acquired on the same 3-Tesla (3T) machine with 8-channel head coil (MR750, GE Healthcare, Milwaukee, WI). All the MR images were performed in a whole-brain coverage. ASL data were acquired by pseudocontinuous ASL (pCASL) with 3D fast spin echo sequence (repetition time/echo time/postlabel delay = 4632/10.5/1525 ms; field of view = 240 × 240 mm, matrix size = 128 × 128, number of excitations = 3; number of slices = 36; slice thickness = 4.0 mm; background-suppressed). CBF maps were obtained according to both labeled and unlabeled ASL scans on FuncTool 3DASL platform (GE Healthcare). Other MR protocols have been reported in our previous studies [5, 26]. These MR protocols included T1-weighted three-dimensional fluid-attenuated inversion-recovery fast spoiled gradient recalled echo pulse sequence (for anatomical reference), time-of-flight MR angiography (TOF-MRA) and T2-fluid-attenuated inversion-recovery (T2-FLAIR).
MRI analysis
Voxelwise comparisons of CBF between study groups were conducted using Statistical Parametric Mapping (SPM12, Wellcome Institute of Neurology, University College London, UK) within the MATLAB environment (version R2016a; MathWorks, Natick, MA). The analysis pipeline comprised the following steps. First, the unlabeled ASL scans were coregistered to the corresponding T1-weighted anatomical images using SPM’s coregistration function. The resulting transformation matrix was then applied to map individual CBF maps to the T1-native space. Then, T1-weighted images underwent bias-field correction and segmentation into gray matter (GM), white matter (WM), and cerebrospinal fluid (CSF). These segmented images were rigidly aligned to the Montreal Neurological Institute (MNI) space. Subsequently, the Diffeomorphic Anatomical Registration Through Exponentiated Lie algebra (DARTEL) toolbox [27] was used to construct study-specific GM and WM templates from all participants’ aligned tissue segments. The derived flow fields were used to warp individual CBF maps to the MNI space and resample them to an isotropic voxel size of 1.5 mm. To address potential partial volume effect (PVE), individual CBF maps were adjusted based on the proportion of GM and WM in each voxel, derived from the segmented T1-weighted images [28]. Since CBF values may be variable, we masked all the voxels with CBF values lower than zero or exceeding two standard deviations (SDs) above the mean to eliminate potential outliers or preprocessing artifacts [18, 29]. The PVE-corrected CBF maps were then spatially smoothed using a 6-mm full width at half-maximum Gaussian kernel for subsequent statistical analyses.
Vascular analysis
Mean velocities of bilateral middle cerebral arteries (MCAs) and internal carotid arteries (ICAs), Lindegaard index (LI), pulsatility index (MMPI) and resistance index (MMRI) of MCAs were recorded and calculated by TCCS in patients with aRCVS on the same day of MRI [6, 8, 23]. The MCA evaluation included proximal and distal portions of M1 segments, separated by a distance of 20 mm [6, 8, 23]. The mean RI ratio of MCAs (MRIR) were also calculated as the ratio of distal to proximal M1 RI, reflecting the pulsation of M1 penetrating arteries [6, 8, 23]. The mean values of bilateral MCAs or ICAs vascular parameters were adopted in the final analysis.
All TCCS data were acquired on the same day as the compared MRI. To ensure imaging quality and mitigate operator-dependent bias, the TCCS parameter values were checked by two experienced neuroradiologists (CHW and JFL), and the consensus values were used for further analysis if a discrepancy existed.
An exploratory investigation was also conducted to examine potential correlations between MRA M1 diameter and global CBF. The average diameter of bilateral M1 segments at the narrowest point was measured and analyzed.
Statistical analysis
This study was composed of 3 major study Bundles. In Bundles 1 and 2, we investigated global and voxelwise CBF, respectively, with both cross-sectional and longitudinal analyses. Since RCVS exhibits hemodynamic and functional reversibility [3, 6,7,8, 21, 23] and abrupt vascular changes may occur within the acute stage [6,7,8], we further evaluated the CBF spatiotemporal patterns and aRCVS interval CBF dynamics in Bundle 3. Besides these three major Bundles, clinical and TCCS vascular parameters were also evaluated in aRCVS subjects.
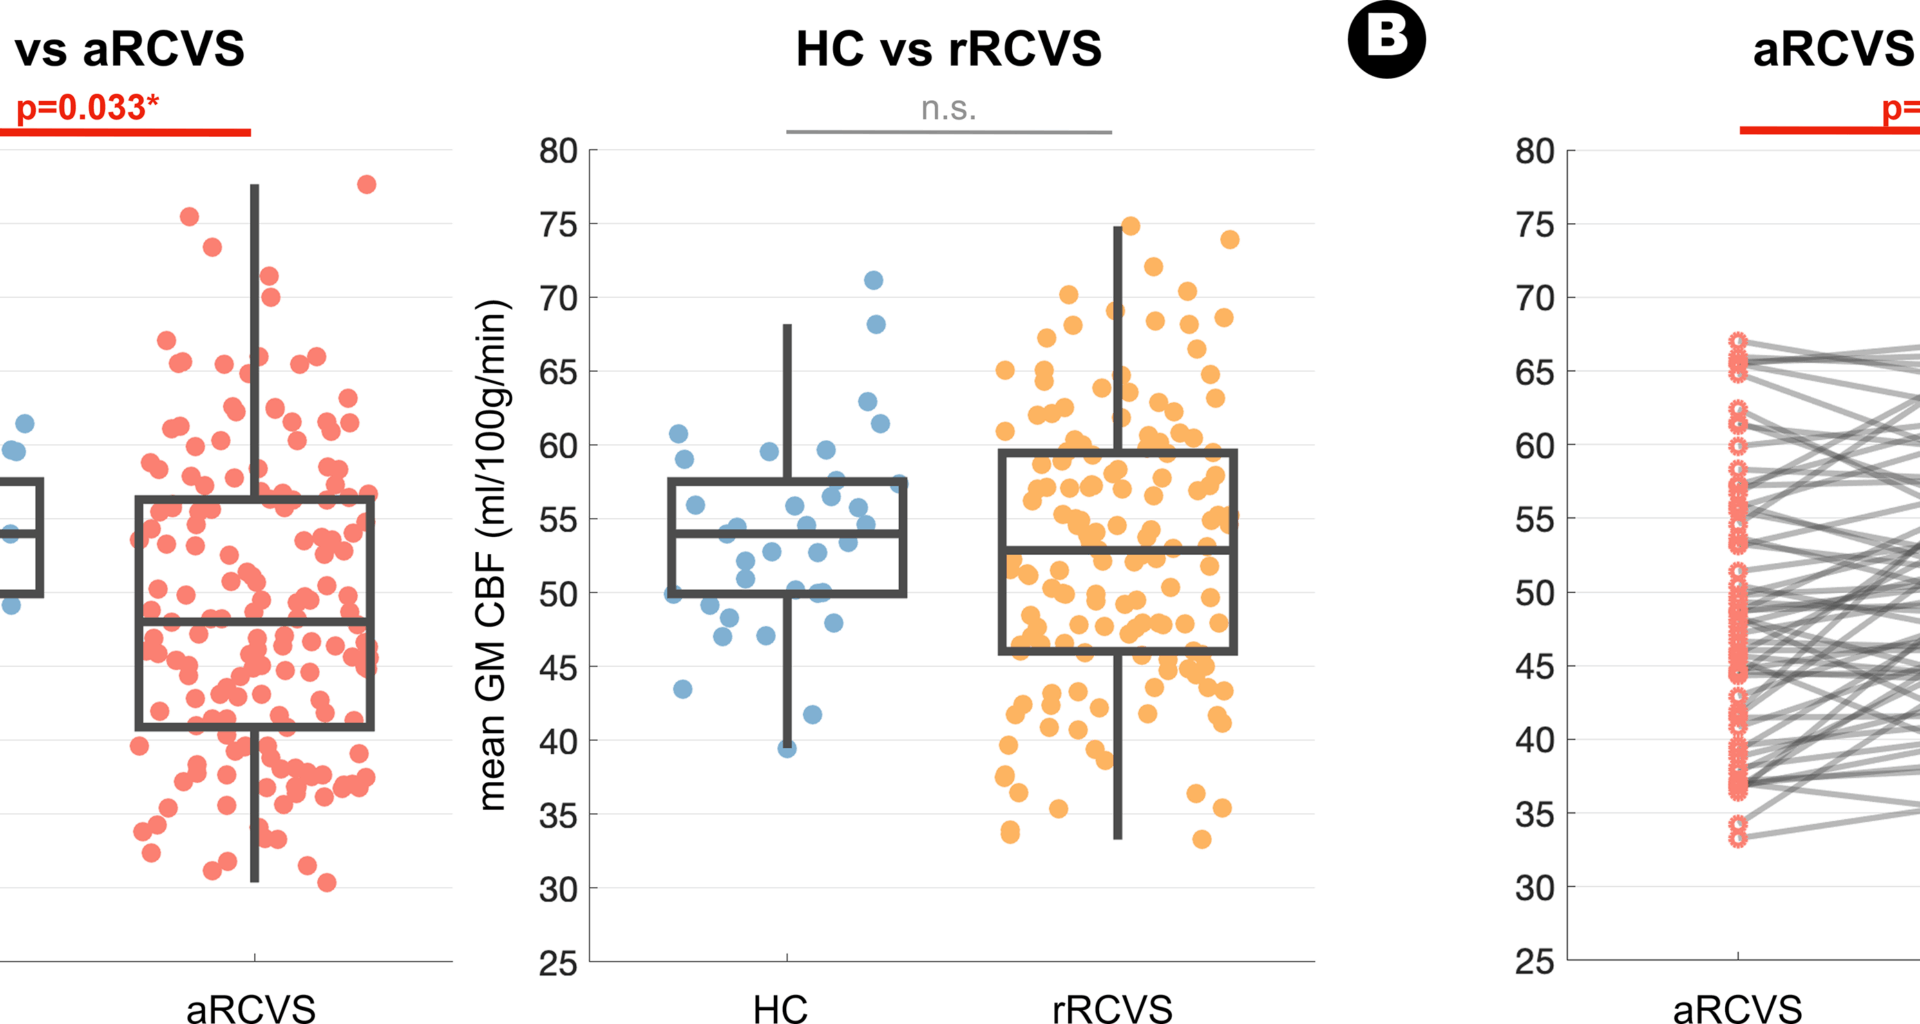
For Bundle 1, whole brain GM CBF values were extracted from unsmoothed PVE-corrected CBF maps for each participant. Two distinct ANCOVA models were used to evaluate the mean GM CBF changes between the patient groups and HC (aRCVS vs. HC and rRCVS vs. HC). For patients with CBF measurements available at both the acute and remission stages, we employed paired t-tests to examine longitudinal changes in global GM CBF value between these two stages of RCVS. For Bundle 2 analysis, the voxelwise statistical analyses within the SPM12 general linear model framework were employed to assess voxelwise CBF alterations between patients and HC (aRCVS vs. HC and rRCVS vs. HC, ANCOVA model with age and sex as nuisance variables) and the longitudinal change between the acute and remission stages of RCVS (paired t-test). For these voxelwise results, non-stationary cluster-level family-wise error (FWE) correction was used to account for multiple comparisons, resulting in a cluster-defining threshold of p < 0.005 and a corrected cluster significance of FWE-corrected p < 0.05. Additionally, all unthresholded statistical maps were uploaded to the NeuroVault website and are available through a permanent link (https://neurovault.org/collections/20402/). For Bundle 3 analysis, we first stratified RCVS patients into temporal cohorts to investigate the potential temporal changes of global GM CBF value over time. In aRCVS, patients were grouped at 7-day intervals, while those beyond the acute stage were categorized at 30-day intervals. Furthermore, to investigate the detailed spatial-temporal changes of voxelwise CBF in aRCVS, we applied two distinct sliding window analyses. In model A, we iteratively set the specific day (k) as the center of a 7-day window (where k ranges from 7 to 30 days after headache onset) and compared voxelwise CBF of individuals within the specific time window with HC. In model B, we examined the evolution of CBF alterations within the aRCVS group by comparing CBF values between consecutive time windows (individual in parcel below and above the specific day). We quantified the number of voxels with significant between-group statistical difference at a voxelwise statistical threshold of p < 0.01. Additionally, to ensure the robustness of these results, these analyses were evaluated with various window interval widths (5,7, and 10 days) and different statistical thresholds (p < 0.05, p < 0.01, p < 0.005, and p < 0.001).
The correlations between global CBF and the vascular and clinical parameters were examined by Pearson correlation coefficients. Since the number of thunderclap headaches and the numeric rating scale (NRS) were not continuous, their correlations with CBF were evaluated by Spearman’s rank correlation coefficients. The CBF differences between aRCVS subjects with and without nimodipine were evaluated by ANCOVA, with sex and age corrections.
To elaborate the numerical differences between RCVS subjects (n = 281) and HCs (n = 35), all the statistical comparisons in Bundles 1 and 2 were performed after adjusting for sex and age. In both models A and B in Bundle 3, we took age and sex as nuisance variables to compare their voxelwise CBF values using ANCOVA models.