
China’s carbon dioxide (CO2) emissions were unchanged from a year earlier in the third quarter of 2025, extending a flat or falling trend that started in March 2024.
The rapid adoption of electric vehicles (EVs) saw CO2 emissions from transport fuel drop by 5% year-on-year, while there were also declines from cement and steel production.
The new analysis for Carbon Brief shows that while emissions from the power sector were flat year-on-year, a big rise in the chemical industry’s CO2 output offset reductions elsewhere.
Other key findings include:
Power-sector CO2 emissions were flat in the third quarter, even as electricity demand growth accelerated to 6.1%, from 3.7% in the first half of the year.
This was achieved thanks to electricity generation from solar growing by 46% and wind by 11% year-on-year in the third quarter of 2025.
In the first nine months of the year, China completed 240 gigawatts (GW) of solar and 61GW of wind capacity, putting it on track for a new renewable record in 2025.
Oil demand and emissions in the transport sector fell by 5% in the third quarter, but grew elsewhere by 10%, as the production of plastics and other chemicals surged.
After the first three quarters of the year, China’s CO2 emissions in 2025 are now finely balanced between a small fall or rise, depending on what happens in the last quarter.
A drop in the full-year total became much more likely after September, which recorded an approximately 3% drop in emissions year-on-year.
Electricity demand – and associated emissions – have tended to grow fastest during the summer months, due to rapidly rising demand for air conditioning amid hotter summers.
If this pattern repeats, then China’s CO2 emissions will record a fall for the full year of 2025.
While an emission increase or decrease of 1% or less might not make a huge difference in an objective sense, it has heightened symbolic meaning, as China’s policymakers have left room for emissions to increase for several more years, leaving the timing of the peak open.
Either way, China is set to miss its target to cut carbon intensity – the CO2 emissions per unit of GDP – from 2020 to 2025, meaning steeper reductions are needed to hit the county’s 2030 goal.
Finely balanced emissions
China’s CO2 emissions have now been flat or falling for 18 months, starting in March 2024. This trend continued in the third quarter of 2025, when emissions were unchanged year-on-year.
This picture is finely balanced, however, with contrasting trends in different sectors of the economy underlying the ongoing plateau in CO2 emissions, shown in the figure below.
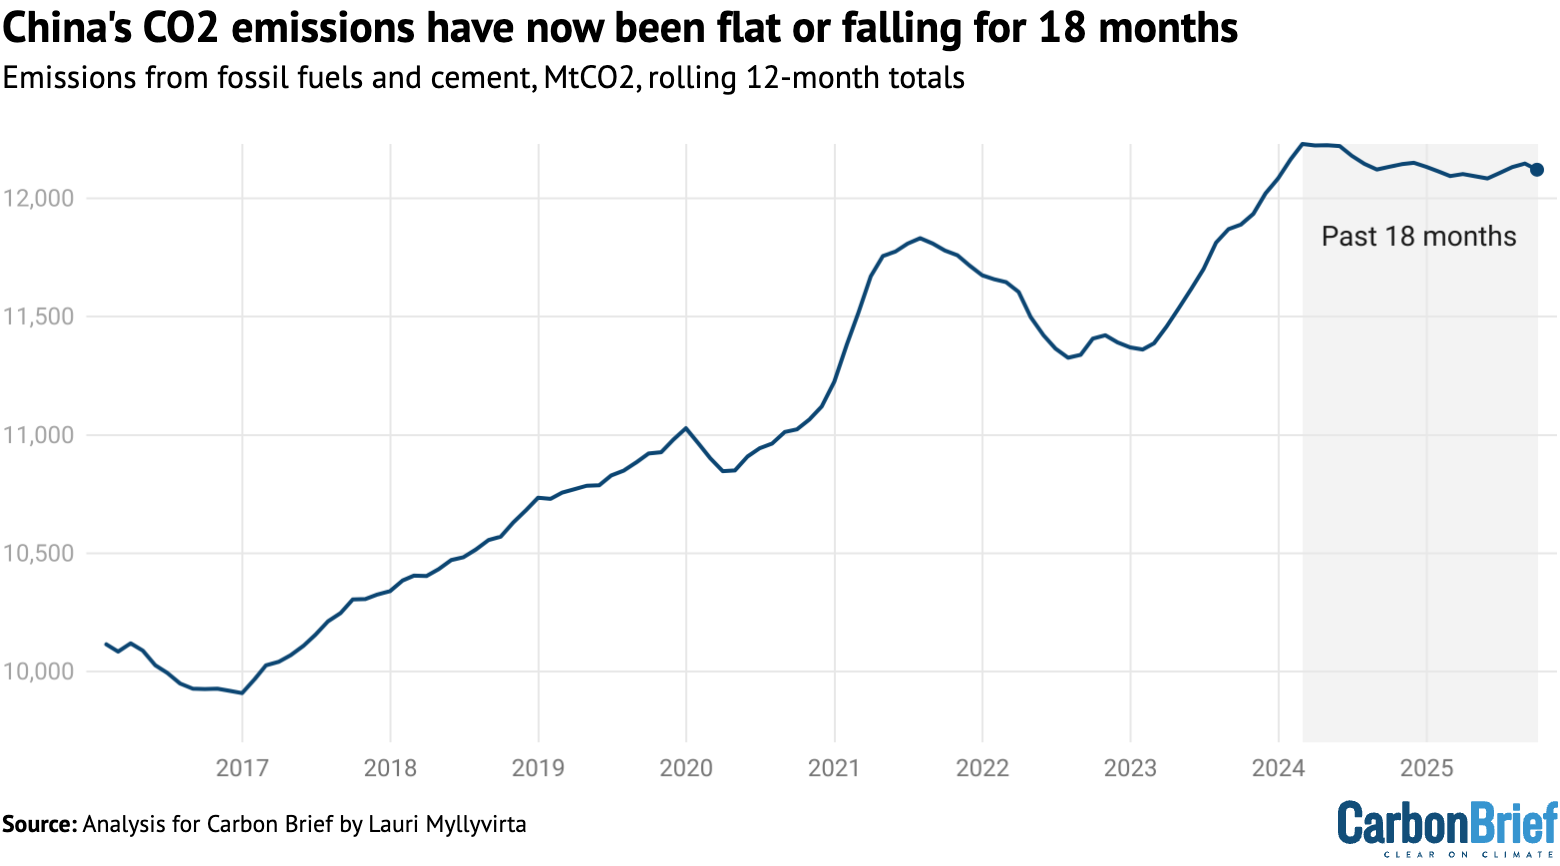 China’s CO2 emissions from fossil fuels and cement, million tonnes of CO2, rolling 12-month totals until September 2025. Source: Emissions are estimated from National Bureau of Statistics data on production of different fuels and cement, China Customs data on imports and exports and WIND Information data on changes in inventories, applying emissions factors from China’s latest national greenhouse gas emissions inventory and annual emissions factors per tonne of cement production until 2024. Sector breakdown of coal consumption is estimated using coal consumption data from WIND Information and electricity data from the National Energy Administration. The consumption of petrol, diesel and jet fuel is adjusted to match quarterly totals estimated by Sinopec.
Emissions from the production of cement and other building materials fell by 7% in the third quarter of 2025, while emissions from the metals industry fell 1%. This is due to the ongoing real-estate contraction, as the construction sector uses most of the country’s steel and cement output.
Emission reductions from steel production continued to lag the reductions in output, which fell 3%. This is because the fall in demand was absorbed by the lower-carbon electric-arc steelmakers, whereas carbon-intensive coal-based steel production was less affected.
China has struggled to increase the share of electric-arc steelmaking despite targets, due to the large capacity base and entrenched position of coal-based steelmaking crowding out the lower-emission producers.
Power-sector emissions were unchanged year-on-year in the third quarter, as strong growth from solar and wind generation, along with small increases from nuclear and hydro, nearly matched a rapid rise in demand.
Emissions from transport fell by 5% over the period, but oil consumption in other sectors grew by 10%, driven by chemical industry expansion. This resulted in a 2% rise in oil consumption overall.
Gas demand and emissions grew by 3% overall in the three-month period, with consumption in the power sector up by 9% and by 2% in other sectors.
The figure below shows how emissions in each of these sectors has changed in the first nine months of 2025, for example, power-sector CO2 output is down 2% in the year so far.
The rapid recent growth of CO2 emissions in the chemical industry is a continuation of recent trends and, as such, the sector’s coal and oil use have both surged in 2025 to date.
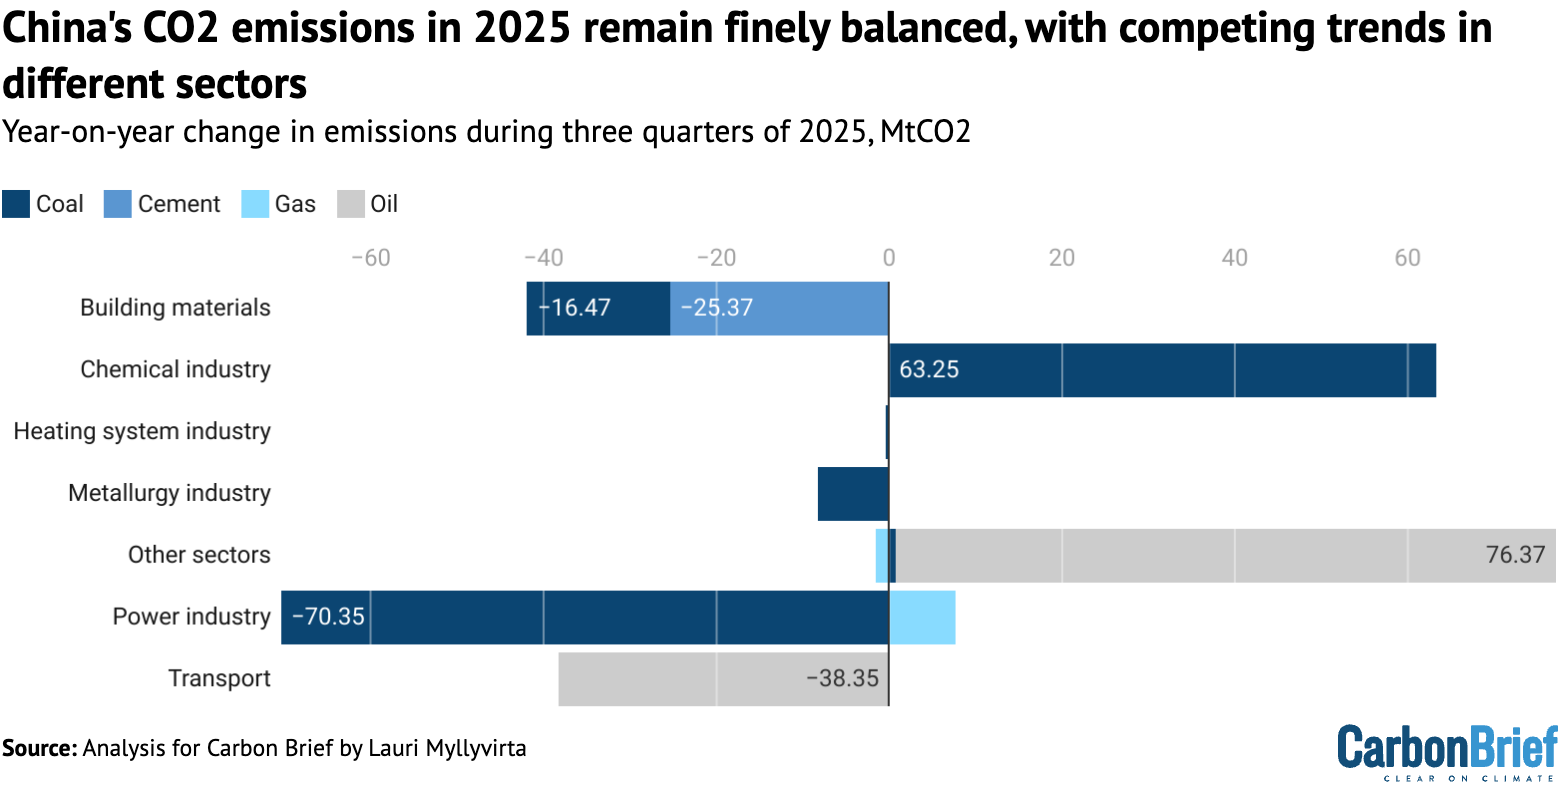 Year-on-year change in China’s CO2 emissions from fossil fuels and cement, for the period January-September 2025, million tonnes of CO2. Source: Emissions are estimated from National Bureau of Statistics data on production of different fuels and cement, China Customs data on imports and exports and WIND Information data on changes in inventories, applying emissions factors from China’s latest national greenhouse gas emissions inventory and annual emissions factors per tonne of cement production until 2024. Sector breakdown of coal consumption is estimated using coal consumption data from WIND Information and electricity data from the National Energy Administration. The consumption of petrol, diesel and jet fuel is adjusted to match quarterly totals estimated by Sinopec.
The outlook for emissions in the final quarter of 2025 – and the year as a whole – depends on whether further declines in cement, transport and power are enough to offset increases elsewhere.
Solar and wind growth keep power sector emissions flat
In the power sector, China’s dominant source of CO2, emissions remained flat in the third quarter even as electricity demand grew strongly.
Electricity generation from solar and wind grew by 30%, with solar up 46% and wind power generation increasing 11%. With small increases from nuclear and hydropower, non-fossil power sources covered almost 90% of the increase in demand, even as demand growth accelerated to 6.1% in the third quarter, up from 3.7% in the first half of the year.
This is illustrated in the figure below, where the columns show the change in generation by each source of non-fossil power every quarter and the line shows the increase in electricity demand.
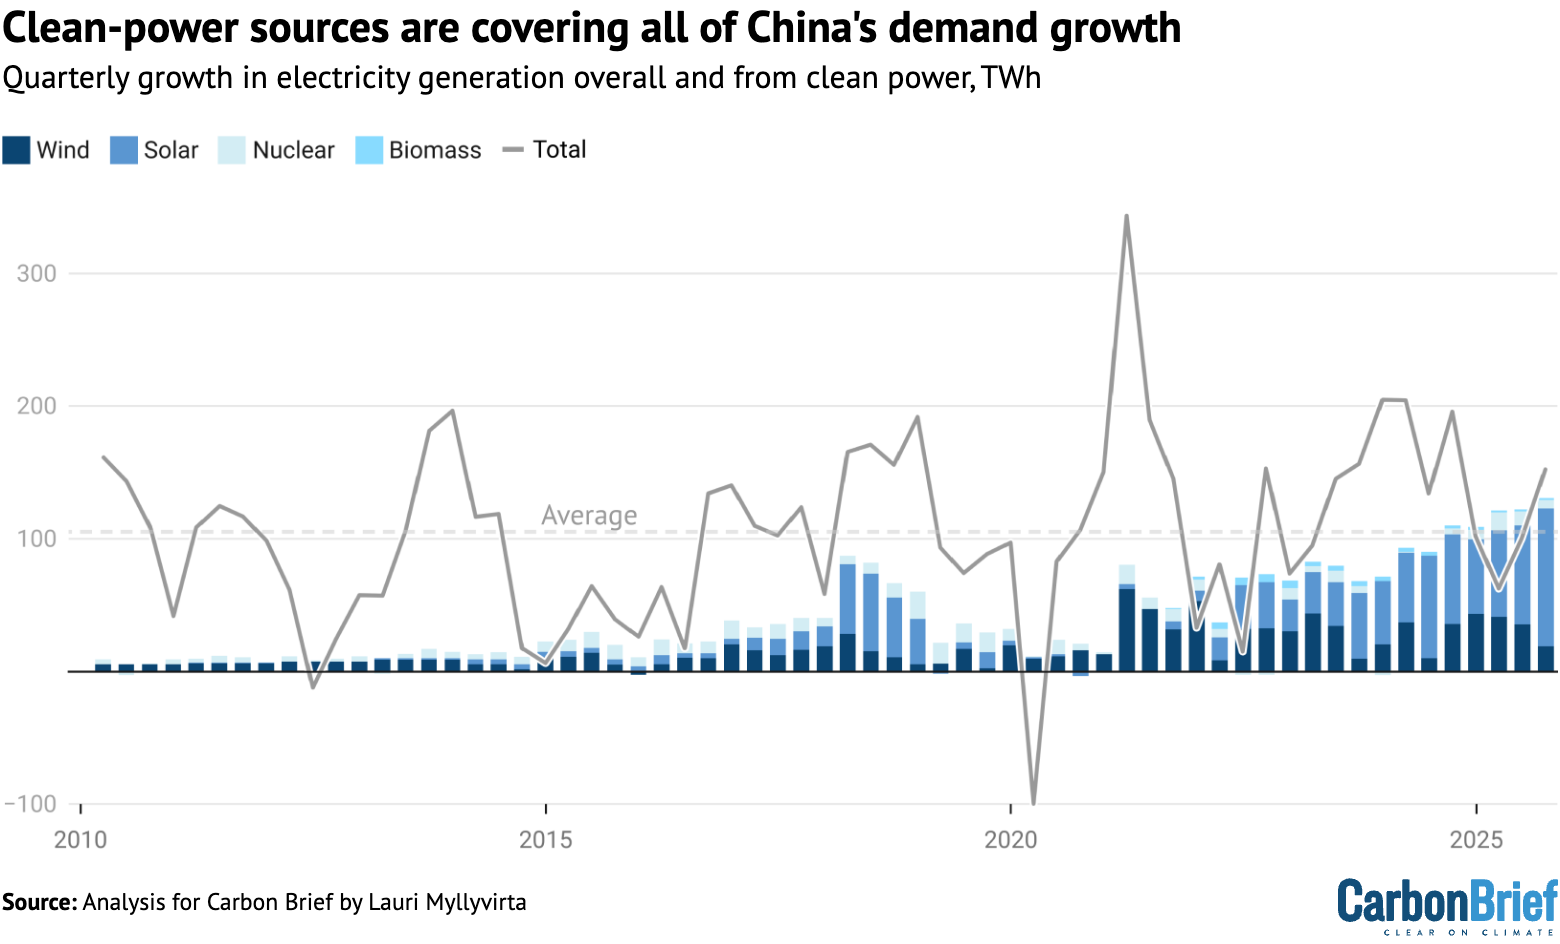 Columns: Year-on-year change in quarterly electricity generation from clean energy excluding hydro, terawatt hours. Solid and dashed line: Quarterly and average change in total electricity generation, TWh. Sources: China Electricity Council; Ember; analysis for Carbon Brief by Lauri Myllyvirta.
Despite a small increase in electricity generation from fossil fuels to cover the remaining 10% of demand growth, power sector emissions stayed unchanged in the third quarter of 2025.
This is because the average thermal efficiency of coal power – the amount of fuel per unit of output – improved slightly, while the share of gas-fired generation increased at the expense of coal.
The figure above shows that the growth in clean-power sources has been covering all or nearly all of the rise in electricity demand in recent quarters, but once again there is a fine balance.
As such, the outlook for the final quarter of 2025 and for power-sector emissions over the years ahead depends on the relative strength of rising demand and clean-power output.
From 2021 to 2025, there has been a marked seasonal pattern in electricity demand growth, with more rapid rises in the summer peak “cooling season”, from June to August.
In these months, residential electricity consumption grew by a striking 13% per year, compared with just 6% during other parts of the year. Industry and service-sector consumption also grew faster in the summer months.
As a result, growth in total power demand has been significantly faster, at 6.8% during the summer months, compared with 4.6% in the rest of the year.
This is due to both increased prevalence of air conditioning and to hotter summers, with the average number of “cooling-degree days” increasing by one third from 2015–16 to 2024–25, as shown in the figure below.
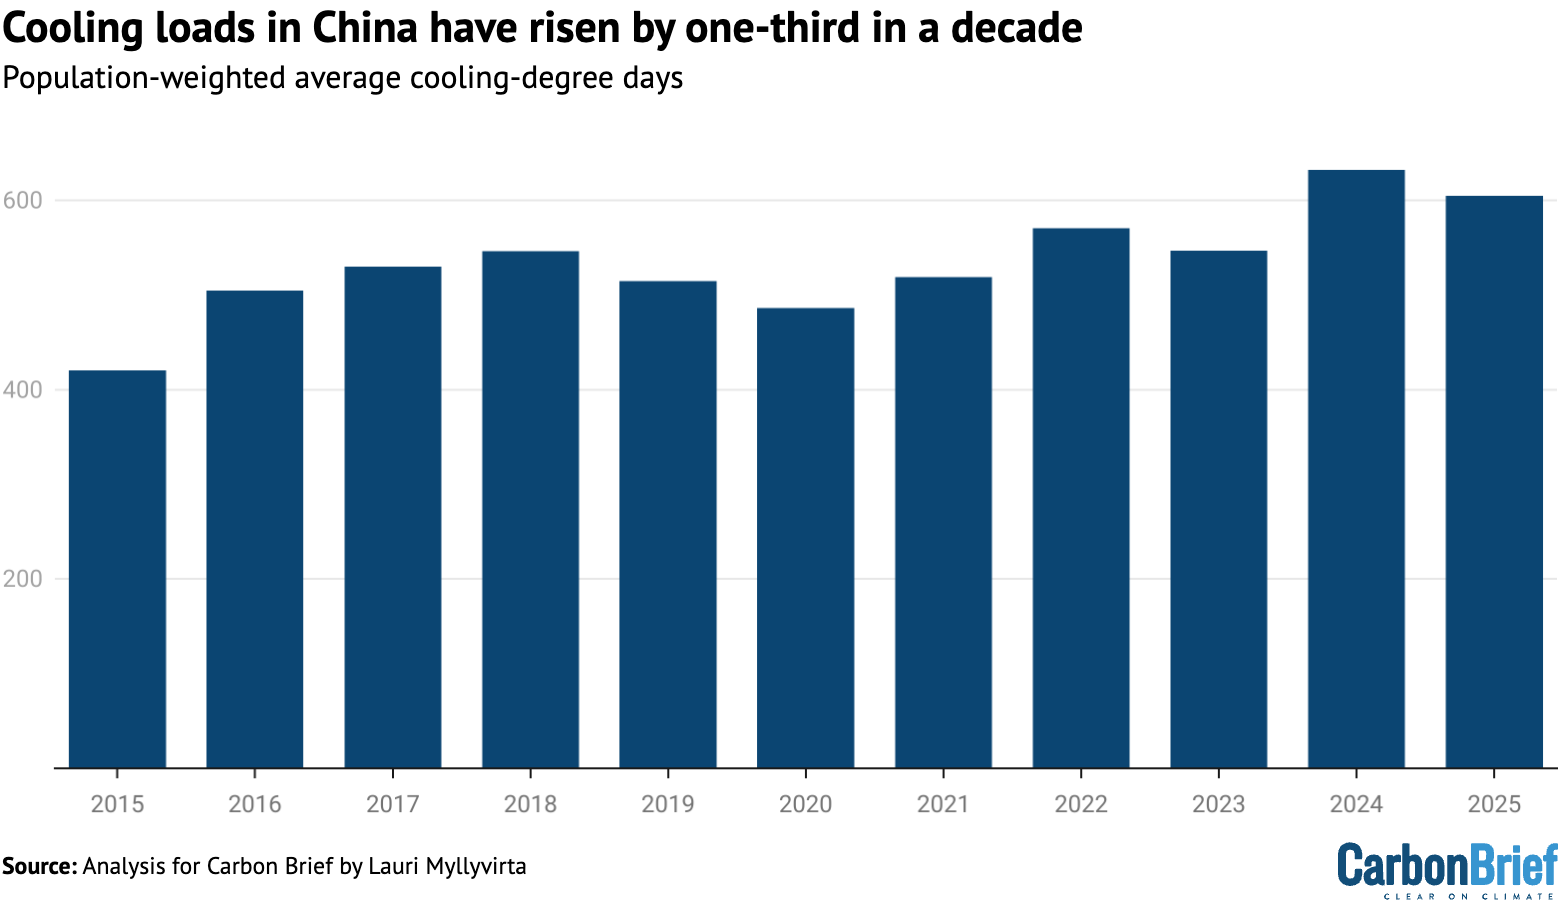 Average number of cooling degree-days in January-September of each year. Source: Calculated by CREA from NCEP gridded daily weather data, weighted by gridded population data.
This seasonal pattern implies that electricity consumption might ease off in the final quarter of 2025, which would set a lower bar for clean-power growth to meet or exceed rising demand.
On the generation side, the first nine months of 2025 has seen China adding 240GW of solar and 61GW of wind power capacity. While the rate of new installations has slowed down sharply since May, China is still on track for a new record for the whole year as developers rush to complete projects included in the 14th five-year plan, which finishes at the end of 2025.
China had 181GW of wind and 234GW of utility-scale solar under construction in early 2025, according to the Global Energy Monitor. After the capacity additions in the first nine months of 2025, this leaves 120GW of wind and 123GW of utility-scale solar under construction, much of which is likely to be commissioned this year.
The rate of new wind and solar additions in 2025 to date is shown in the figure below, alongside comparable figures for each year since 2020.
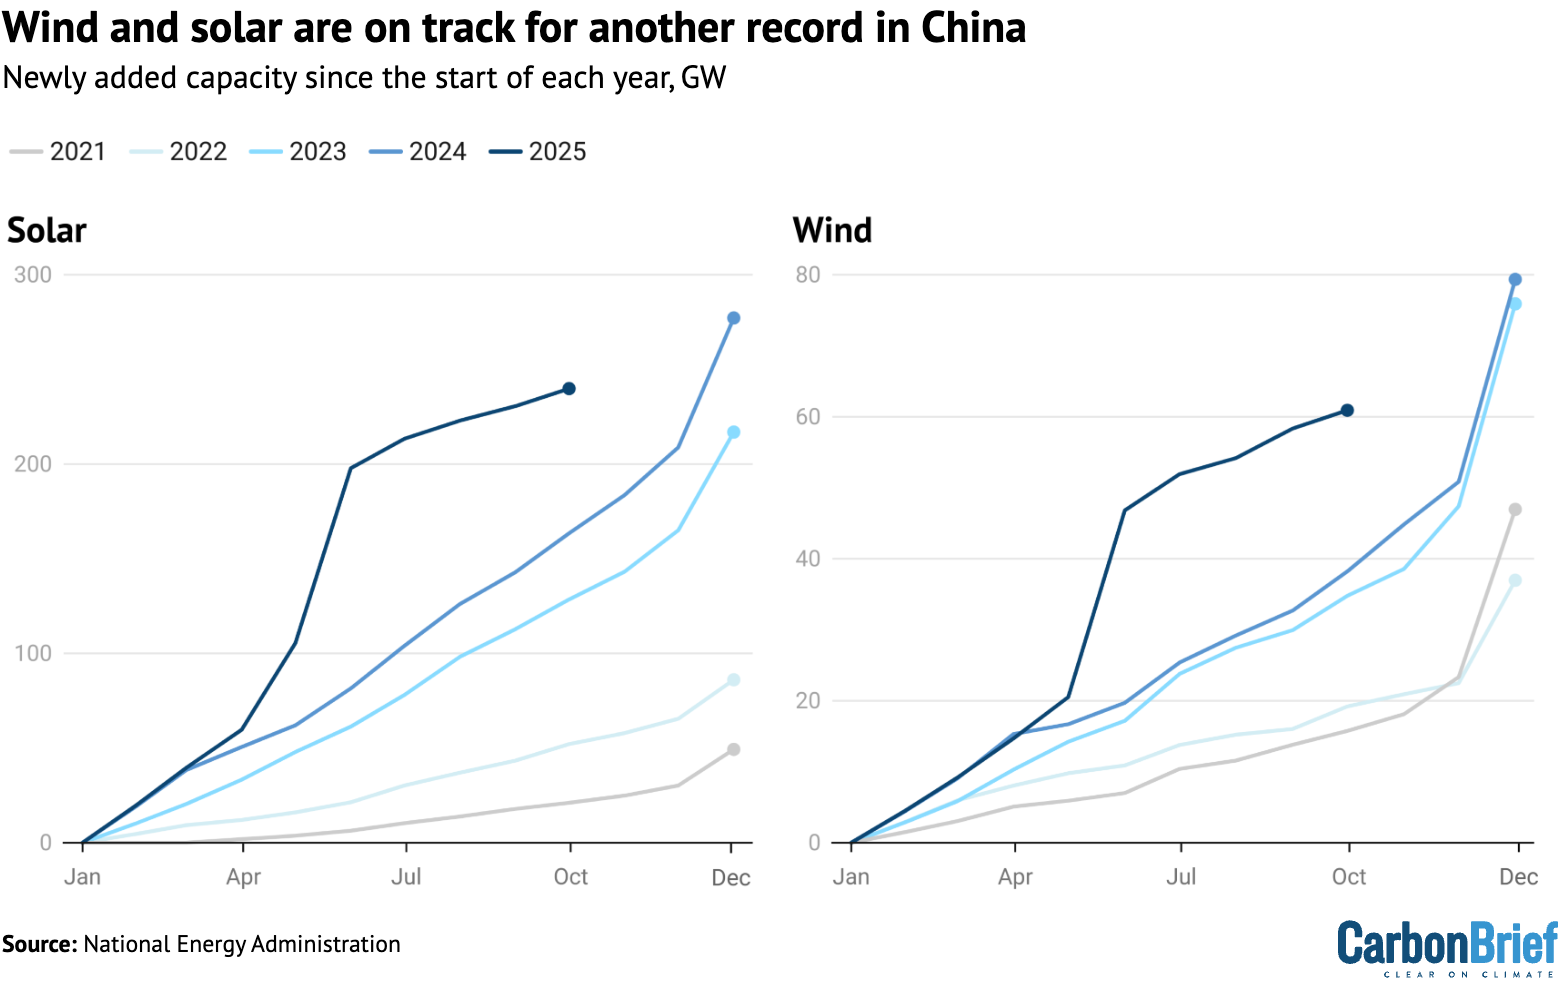 Newly added solar and wind power generating capacity in China, since the start of each year, gigawatts. Source: National Energy Administration.
The slowdown in installations in recent months is due to a new pricing system that requires developers of new solar and wind-power plants to secure contracts directly with buyers, instead of being guaranteed the benchmark price for coal power, which was the case until May.
The change in pricing led to a major rush to complete projects faster than originally scheduled, seen in the May 2025 bump in the figure above.
This left few projects to complete in the third quarter, meaning that the current slow pace in installations does not yet reflect the capacity growth that can be expected under the new system.
China’s power-sector emissions have been falling slowly since early 2024, due to the rapid growth of solar and wind power generation. The unprecedentedly large capacity additions have enabled non-fossil power generation to cover electricity demand growth, but only barely.
Any sustained slowdown in solar and wind deployment would mean that power-sector emissions would begin to creep up again, unless electricity demand slows sharply. This is not expected – the State Grid has forecast 5.6% annual demand growth until 2030, compared with 6.1% from 2019 to 2025.
One indicator pointing towards robust ongoing solar capacity growth is that the production of solar cells has continued at or above 2024 levels – even after the slowdown in installations in recent months – growing 8% year-on-year in the third quarter.
The amount of new solar-cell capacity produced in Chinese factories each month, minus exports, has tended to predict new domestic solar installations, with a lag.
However, the outlook for wind and solar growth in China is clouded by a large gap between industry and government expectations for the sector.
The China Wind Energy Association is targeting at least 120GW of wind-power capacity added per year in the next five years, while the China Photovoltaic Industry Association projects 235-270GW of solar added in 2026, rising to 280-340GW in 2030.
In contrast, president Xi Jinping recently announced that China would “strive to” bring the county’s installed solar and wind capacity to 3,600GW by 2035. This implies just 200GW of capacity added per year over the next decade, extending a target set earlier for 2025-27.
The pace of solar and wind deployment under the new pricing system depends heavily on the implementation of the national-level rules at the provincial level, particularly the choice of minimum pricing. Most provinces are yet to finalise their rules and only six provinces have published results from auctions for “contracts for difference” – the key policy instrument under the new rules – so far, with nine more auctions underway.
Meanwhile, the additions of new coal and gas-fired power capacity have accelerated, as the projects started after the government loosened permitting and started to promote coal-fired power projects in 2020 are starting to complete.
The result has been that the utilisation of coal-fired power capacity – the share of hours during which each unit is in operation – has begun to fall significantly, as power generation from coal has declined since April 2024. Utilisation peaked at 54% in the 12 months to February 2024 and fell to 51% in the 12 months to September 2025.
Another 230GW of coal-fired power capacity is under construction. If power generation from coal continues to stay stagnant and if all of this new capacity is added to the system, then utilisation would fall to 43%. This could prompt a rethink of the government’s promotion of coal-fired power projects.
Chemical industry’s runaway growth pushes up oil demand
In the oil sector, there are once again competing factors at work. China’s transport oil consumption has been falling since April 2024, driven in large part by the rapid adoption of EVs.
However, total oil consumption still increased 2% in the year to September, as a 4% fall in transport fuel use was more than offset by an 8% rise elsewhere, dominated by industrial demand.
Consumption fell by 4-5% across each of the three main transport fuels: diesel, used in trucks and other heavy vehicles; petrol, mainly used in cars; and jet fuel.
The reduction in petrol consumption accelerated in October, falling 8% year-on-year, erasing the usual spike seen at this time of year related to the week-long national holiday.
Within industry, the production of primary plastics grew 12% year-on-year in the first three quarters of 2025, while the production of chemical fibres grew by 11% and the production of ethylene by 7%. The increase in the output of these products accounts for the entire increase in oil use outside the transportation sector.
These sharp increases in chemical production are shown in the figure below.
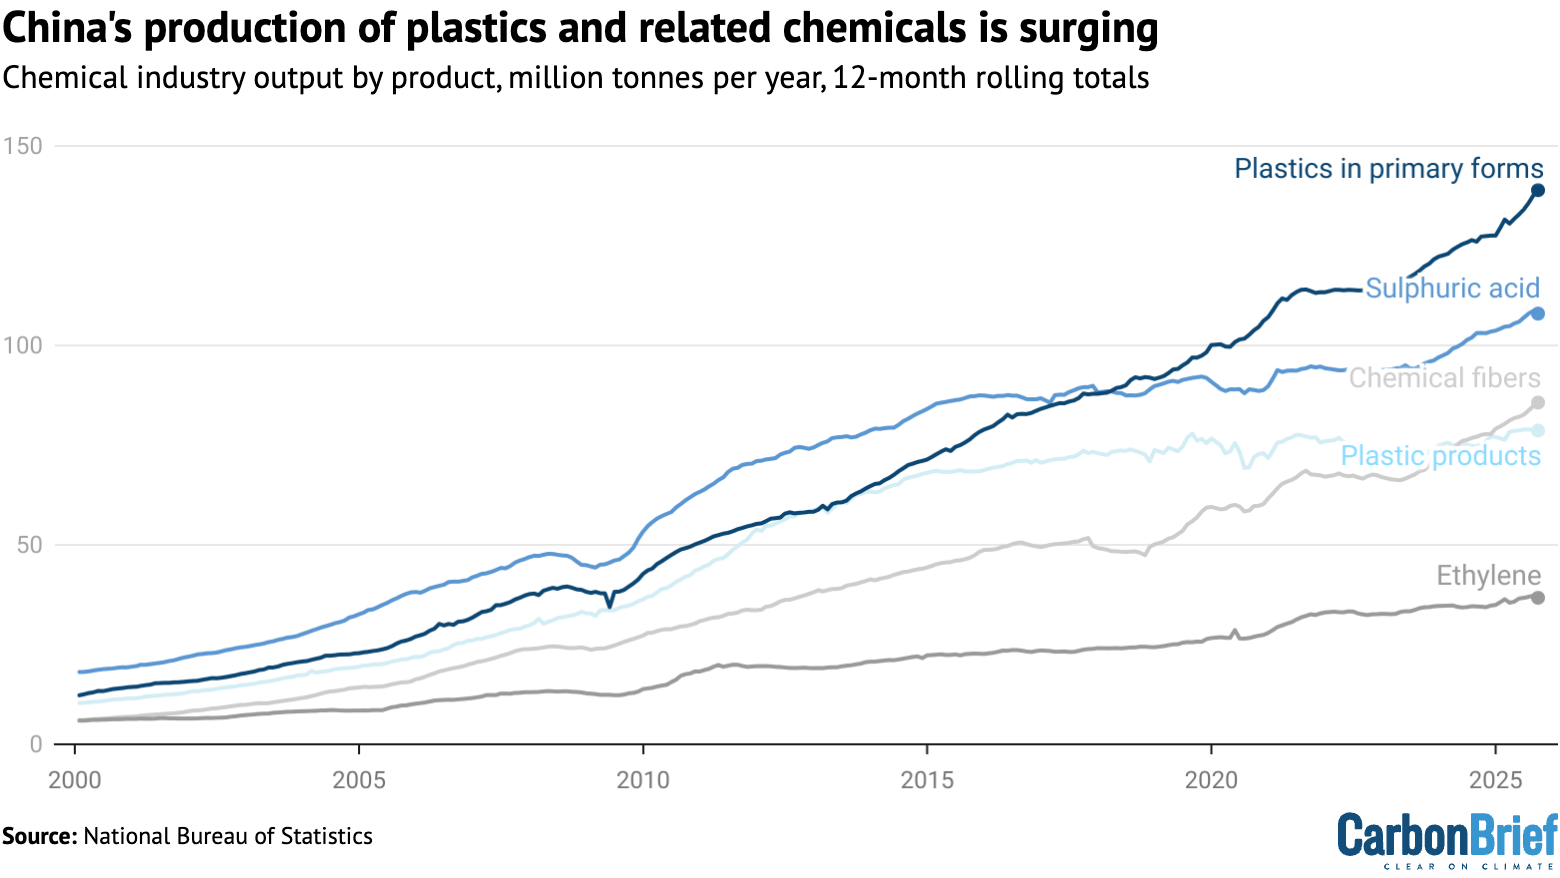 Chemical industry output by product, million tonnes per year, 12-month rolling totals. Source: NBS monthly industrial output data, except for primary plastics, NBS via Wind Financial Terminal.
One clear driver of the growth in plastics production is import substitution – replacing equivalent products imported from overseas – as well as growing exports.
China is still a net importer of primary plastics by value in 2025 so far, but only just. The value of imports fell by 8% while the value of exports increased by 8% in the first nine months of the year.
The five-year plan for 2021-25 targeted an increase in chemicals production to reduce the imports of key raw materials to less than 40% of demand, with projects launched to meet this target coming online this year.
More recently, the government has encouraged oil refineries to shift from the production of transport fuels to chemicals, in order to adapt to falling demand for oil in transportation. It set a target for the petrochemical and chemical sector’s economic output to grow by more than 5% per year in 2025-26.
The US-China tariff tit-for-tat has added further momentum to import substitution. The US has been China’s largest source of imports of polyethylene – the most widely used plastic in the world – since 2023, but China has expanded its domestic production in response to the trade spat.
Still, the change in China’s net exports of plastics cannot account for more than a fraction of the increase in output volume, however, as estimated based on reported polymer prices. This indicates that growing domestic demand is a major driver of the rapid growth in plastics production.
Packaging is the largest use of plastics in China, with the booming online retail and food delivery industry driving rapid growth.
Express parcel volumes grew 21% in 2024 and 17% through September 2025. The value of the single-use plastic tableware market averaged 21% annual growth from 2017 to 2022 and the revenue of the online food delivery industry is projected to grow 11% in 2025.
The government is taking measures to curb single-use plastics, but these would need to be intensified to fully counteract the growth rates seen in food deliveries and other drivers. The demand for high-performance materials in new manufacturing industries is also a significant driver.
Will China’s emissions peak early or rebound?
After the third quarter of 2025, it is clear that the plateau or slow decline of China’s CO2 emissions that started in early 2024 continues.
Whether emissions increased or decreased marginally in the first three quarters of the year is too close to call, given the uncertainties involved, but a drop in full-year emissions became much more likely after September, which recorded an approximately 3% drop in emissions year-on-year.
Still, either a small increase or decrease in the calendar year of 2025 remains possible and will be ultimately be decided by developments in the fourth quarter.
China’s emissions from fossil-fuel use are highly likely to increase this year, with the increase of coal and oil use in the chemical industry outweighing the reductions in emissions from the power, metals, building materials and transportation sectors. This will be balanced out by a fall in cement process emissions.
What is already clear is that the 2025 carbon-intensity target will be missed, as it would have required absolute emission reductions of 4% or more this year, after slow progress during the earlier years of the five-year period.
This also means that the carbon-intensity target in the next 15th five-year plan for 2026-2030 would need to be more ambitious than the one that China missed during the current period, to close the shortfall to the country’s 2030 intensity target.
China targeted an 18% reduction in 2021-25, but will only have achieved around 12% by the end of this year. It would then need a reduction of around 22-24% in the next five years to achieve its headline climate commitment for 2030, a 65% carbon-intensity reduction on 2005 levels.
Whether emissions fall this year – or not – has high symbolic significance. Having committed to peaking emissions “before 2030”, China’s policymakers have left their specific peaking year open.
China’s new greenhouse gas emission target for 2035, announced by Xi in September, was set as a reduction of 7-10% below an undefined “peak level”, making it clear that policymakers are still planning for – or at least leaving the door open to – a late peak, only just before 2030.
Setting this target from “peak levels” means that the timing and level of China’s emissions peak affects not only the path of its CO2 output in the next few years, but also the size of cuts needed to meet the 2035 goal – and presumably also subsequent targets thereafter.
The target of reducing emissions from “peak levels” could also create an incentive for provinces to increase emissions before the expected peak year, known as “storming the peak” in Chinese.
This incentive could be curbed by the creation of the “dual control” system for carbon intensity and total carbon emissions. The Central Committee of the Communist Party recently reiterated that this should happen during the next five-year period, but the specific timeline is an open question.
If the system is not operational from 2026, with annual carbon intensity and possibly absolute carbon emission targets allocated to provinces, then that could further allow for and incentivise emissions increases in the short term.
At the same time, China has made commitments to peak emissions before 2030, reduce coal consumption gradually during the 2026-30 period and to reduce carbon emissions per unit of GDP by more than 65% by 2030, from 2005 levels.
Meeting the last target – which China has made internationally as part of its 2030 Paris pledge – would require, in practice, that emissions in 2030 are limited at or below their 2024 level, given progress to date and expected GDP growth rates.
Realising these targets, in turn, would require clean-energy growth rates well above the minimum of 200GW of new wind and solar capacity per year, set by China’s 2035 pledge – unless the rate of energy-demand growth sees a sharp and unexpected slowdown.
Beating these minimum clean-energy growth rates would also be necessary if policymakers want to maintain the tailwind that these sectors have provided to China’s economy in recent years.
About the data
Data for the analysis was compiled from the National Bureau of Statistics of China, National Energy Administration of China, China Electricity Council and China Customs official data releases, from WIND Information, an industry data provider, and Sinopec, China’s largest oil refiner.
Wind and solar output, and thermal power breakdown by fuel, was calculated by multiplying power generating capacity at the end of each month by monthly utilisation, using data reported by China Electricity Council through Wind Financial Terminal.
Total generation from thermal power and generation from hydropower and nuclear power was taken from National Bureau of Statistics monthly releases.
Monthly utilisation data was not available for biomass, so the annual average of 52% for 2023 was applied. Power sector coal consumption was estimated based on power generation from coal and the average heat rate of coal-fired power plants during each month, to avoid the issue with official coal consumption numbers affecting recent data.
CO2 emissions estimates are based on National Bureau of Statistics default calorific values of fuels and emissions factors from China’s latest national greenhouse gas emissions inventory, for the year 2021. Cement CO2 emissions factor is based on annual estimates up to 2024.
For oil consumption, apparent consumption of transport fuels (diesel, petrol and jet fuel) is taken from Sinopec quarterly results, with monthly disaggregation based on production minus net exports. The consumption of these three fuels is labeled as oil product consumption in transportation, as it is the dominant sector for their use.
Apparent consumption of other oil products is calculated from refinery throughput, with the production of the transport fuels and the net exports of other oil products subtracted. Fossil-fuel consumption includes non-energy use, as most products are short-lived and incineration is the dominant disposal method.
Chengcheng Qiu, China analyst at Centre for Research on Energy and Clean Air, contributed research.