
Study population
The National Health and Nutrition Examination Survey (NHANES) is a cross-sectional national survey that collects data on demographics, health, and health behaviours. NHANES employs a repeated cross-sectional design, with different participants sampled in each 2-year survey cycle. Detailed information on the study design, data collection protocols, and publicly available datasets can be found at www.cdc.gov/nchs/nhanes/. This study used data from 2003 to 2018. All study protocols were approved by the Institutional Review Board of the National Center for Health Statistics, and participants provided written informed consent. The study included 9,933 participants aged ≥ 65 years, excluding those without data on frailty index (FI) variables or SDoH.
Baseline characteristics
Sociodemographic and lifestyle data were collected through standardized self-administered questionnaires. Sociodemographic variables included sex (male or female), age (recorded as a continuous variable), and race (categorized as non-Hispanic white, non-Hispanic Black, Mexican American, or other). Lifestyle factors encompassed alcohol consumption and smoking status: participants were classified as never drinkers (defined as consuming fewer than 12 alcoholic drinks in their lifetime) or current drinkers, while smoking status was categorized into nonsmokers (individuals who had never smoked or smoked fewer than 100 cigarettes in their lifetime), former smokers (those with a lifetime consumption of ≥ 100 cigarettes but abstinent at the time of interview), and current smokers. Dietary intake was assessed using 24-hour recalls conducted by trained staff at mobile centers via the USDA automated multiple-pass method. These data informed the calculation of the Healthy Eating Index-2010 (HEI-2010), selected for its alignment with the study’s data collection timeline to ensure contemporaneous dietary guideline adherence. The HEI-2010 comprises 12 components (maximum score: 100), with nine quantifying adequate intake of fruits, vegetables, whole grains, dairy, proteins, and fatty acids, and three evaluating moderation in refined grains, sodium, and empty calories (SoFAAS: solid fats, alcohol, added sugars). Lower moderation scores reflect higher consumption. Total HEI scores (0–100) correlate positively with diet quality.
Physical activity (PA) was evaluated using a 30-day retrospective questionnaire documenting activity type, duration, intensity, and frequency across transportation, occupational, and leisure domains. Metabolic equivalent task (MET) scores were calculated as: Total MET (minutes per week) = number of days *number of minutes* MET scores.
SDoH assessment
To explore the relationship between SDoH and frailty, we selected eight SDoH variables based on prior research [25]. These variables, defined by Health 2030 [26] and the World Health Organization [27] included employment status, household poverty-to-income ratio, food security, education level, access to healthcare, type of health insurance, homeownership, and marital status. Cumulative adverse SDoH counts (range: 0–8) were categorized as 0, 1–2, 3–5, or ≥ 6, with the latter group representing extreme disadvantage. Variable definitions are detailed in eTable 1.
Definition of frailty
Frailty levels were determined using the FI, calculated from 49 variables in the NHANES dataset related to signs, symptoms, disabilities, diseases, and laboratory measurements [28]. Each variable was recoded as 0 (absence of a deficit) or 1 (presence of a deficit), and the FI was computed as the ratio of present deficits to the total number of considered items (49) [29]. Based on established thresholds [30, 31], participants were categorized as non-frail (FI < 0.21) or frail (FI ≥ 0.21). For sensitivity analysis, we further applied a three-level frailty classification: non-frail (FI < 0.10), pre-frail (FI 0.10–0.20), and frail (FI ≥ 0.21). As NHANES is a cross-sectional survey, our outcome reflects the prevalence of frailty at the time of assessment rather than the incidence over time.
Statistical analysis
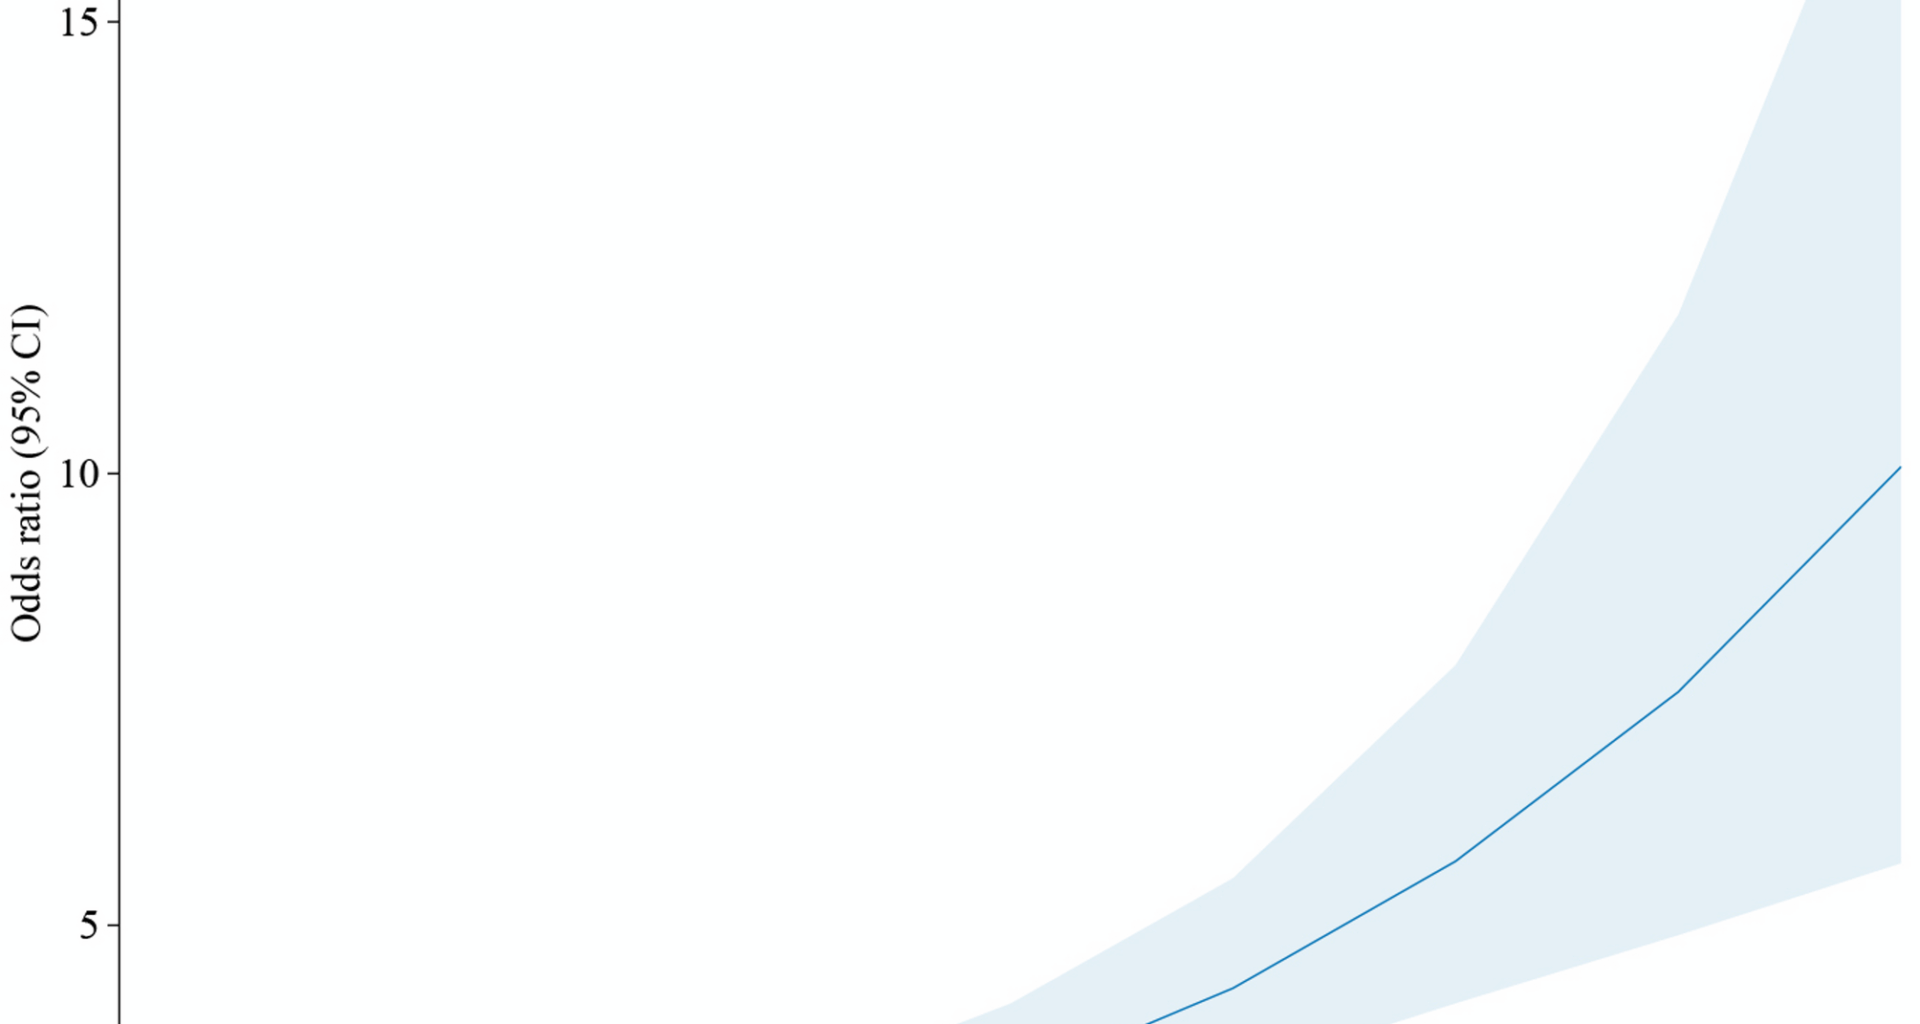
To account for oversampling in NHANES, we applied recommended survey weights. Continuous variables were expressed as mean ± SE, while categorical variables were presented as counts (percentages). Baseline characteristics were compared using t-tests for continuous variables and χ² tests for categorical variables. To examine the relationship between SDoH and FI, we conducted both unadjusted and adjusted multivariable logistic regression analyses. Model 1 was unadjusted (crude model), Model 2 adjusted for demographic factors (age, gender, and race/ethnicity), and Model 3 additionally incorporated body mass index (BMI), smoking status, drinking status, HEI2010 total score, and PA total MET. To explore the early influence of social determinants, we conducted weighted logistic regression to assess the association between cumulative SDoH and pre-frailty status, using non-frail individuals as the reference group. We also assessed the relationship between individual SDoH components (e.g., employment, poverty-to-income ratio) and FI. Nonlinear relationships between SDoH and FI were explored using restricted cubic splines. Stratified analyses were performed by age, sex, race, smoking, alcohol use, and obesity, with interaction terms to formally test for age-related differences in the impact of SDoH on FI in older adults.
All statistical analyses were conducted using R software (version 4.3.1; R Foundation for Statistical Computing, Vienna, Austria), utilizing the “survey” package to account for NHANES’ complex design. Statistical significance was set at P < 0.05.