
Among 12,069 elderly patients with sepsis (mean [SD] age, 77.0 [7.6] years; 6105 [50.6%] women) admitted to the ICU, 1976 (16.4%) had hypokalemia (serum potassium levels < 3.5 mmol/L), 8834 (73.2%) had normokalemia (serum potassium levels of 3.5–5.0 mmol/L), and 1259 (10.4%) had hyperkalemia levels (serum potassium levels > 5.0 mmol/L). The majority of patients were Caucasian (81.1%−82.4%) across all groups (Table 1).
Significant differences were observed in baseline characteristics across potassium groups. Patients with hyperkalemia (> 5.0 mmol/L) were more likely to be female (55.28% vs 52.03% vs 41.22%; P < 0.001) and had higher prevalence of comorbidities including CHF (12.55% vs 9.97% vs 7.54%; P < 0.001), AKI (39.08% vs 22.33% vs 19.18%; P < 0.001), and diabetes (32.35% vs 26.18% vs 23.41%; P < 0.001). The hyperkalemic group also demonstrated greater disease severity, with higher mean (SD) SOFA scores (5.68 [2.99] vs 4.18 [2.83] vs 3.92 [2.77]; P < 0.001). Laboratory values showed significant differences, particularly in renal function parameters, with higher mean serum creatinine (3.14 vs 1.80 vs 1.46 mg/dL; P < 0.001), BUN (58.62 vs 36.26 vs 30.08 mg/dL; P < 0.001) and lower eGFR (26.74 vs 48.56 vs 60.90 mL/min/1.73m2; P < 0.001) in the hyperkalemic group. Regarding clinical interventions, patients with hyperkalemia required more intensive support, with higher rates of mechanical ventilation (33.50% vs 25.84% vs 26.48%, P < 0.001) and dialysis (7.33% vs 4.40% vs 3.28%, P < 0.001). The 28-day ICU mortality rate was 11.5% in elderly patients with sepsis, showing a significant association with serum potassium levels, being highest in the hyperkalemic group (23.43% vs 10.12% vs 9.77%; P < 0.001). In our sensitivity analysis with five refined potassium categories (Table S1), similar trends were observed. Across ascending potassium groups, we found progressive increases in serum creatinine, BUN, SOFA scores, and declining pH values. The proportion of patients with CHF, AKI, and diabetes consistently increased across higher potassium categories.
In the univariate analysis (Table 2), serum potassium was significantly associated with increased mortality risk (OR 1.65, 95% CI 1.54–1.77, P < 0.001). In the stratified analysis, we examined the association between serum potassium levels (per 1 mmol/L increase) and 28-day ICU mortality across various subgroups. The association remained significant across most predefined subgroups. The association between serum potassium levels and mortality was consistent across age strata, with slightly stronger associations observed in elderly patients (OR, 1.79 [95% CI, 1.59–2.03] for age > 80 years vs 1.54 [95% CI, 1.34–1.76] for age ≤ 70 years). The relationship was similar between female (OR, 1.70 [95% CI, 1.54–1.87]) and male patients (OR, 1.61 [95% CI, 1.46–1.78]). The association persisted across various comorbidity subgroups, including patients with and without CHF (OR, 1.53 [95% CI, 1.24–1.88] and 1.67 [95% CI, 1.55–1.79], respectively), AKI(OR, 1.40 [95% CI, 1.25–1.56] and 1.71 [95% CI, 1.56–1.87], respectively), and diabetes (OR, 1.54 [95% CI, 1.35–1.77] and 1.71 [95% CI, 1.56–1.85], respectively). The relationship between serum potassium and mortality was consistent across different SOFA score categories. The association persisted across most laboratory parameters, with varying strengths of association. Renal function demonstrated particularly notable differences: patients with normal serum creatinine (≤ 1 mg/dL) showed no significant association (OR, 0.96 [95% CI, 0.75–1.22]; P = 0.723), whereas those with moderate (1–2 mg/dL) and severe (> 2 mg/dL) renal dysfunction demonstrated significant associations (OR, 1.63 [95% CI, 1.43–1.86] and OR, 1.38 [95% CI, 1.25–1.51], respectively). Similarly, when stratified by eGFR categories, patients with eGFR ≥ 60 mL/min/1.73m2 showed no significant association (eGFR ≥ 60: OR, 1.13 [95% CI, 0.90–1.41], P = 0.301, while those with eGFR < 60 mL/min/1.73m2 demonstrated significant associations (eGFR < 60, ≥ 45: OR, 1.50 [95% CI, 1.13–1.97], P = 0.005); eGFR < 45, ≥ 30: OR, 1.69 [95% CI, 1.41–2.02], P < 0.001; eGFR < 30: OR, 1.39 [95% CI, 1.27–1.52], P < 0.001).The association remained significant regardless of mechanical ventilation status but was not statistically significant among patients receiving dialysis (OR, 1.32 [95% CI, 0.97–1.80]; P = 0.080), possibly due to the smaller sample size in this subgroup (n = 522).
In multivariable analyses, serum potassium demonstrated a significant association with 28-day ICU mortality (Table 3). When analyzed as a continuous variable, each 1 mmol/L increase in serum potassium was associated with higher odds of mortality in the unadjusted model (OR, 1.65 [95% CI, 1.54–1.77]; P < 0.001). This association persisted after adjusting for age and sex (OR, 1.66 [95% CI, 1.55–1.77]; P < 0.001) and further adjustment for serum creatinine (OR, 1.52 [95% CI, 1.41–1.63]; P < 0.001). In the fully adjusted model, which accounted for demographics, comorbidities, disease severity, and clinical interventions, the association remained significant although attenuated (OR, 1.23 [95% CI, 1.09–1.39]; P = 0.001). When categorizing serum potassium levels, patients with hyperkalemia (> 5.0 mmol/L) showed substantially higher mortality risk compared with those with normal potassium levels (3.5–5.0 mmol/L). This relationship was robust across all adjustment models, with OR of 2.72 (95% CI, 2.34–3.15) in the unadjusted model and 1.45 (95% CI, 1.11–1.88) in the fully adjusted model (P = 0.007). Notably, patients with hypokalemia (< 3.5 mmol/L) did not show significantly different mortality risk compared with the reference group across all models. The ordinal analysis of serum potassium categories demonstrated a significant trend, with each categorical increase in potassium level associated with higher mortality risk (fully adjusted OR, 1.25 [95% CI, 1.04–1.50]; P = 0.020). In our sensitivity analysis with refined potassium categories(≤ 3.5, > 3.5 to ≤ 4.0, > 4.0 to ≤ 4.5, > 4.5 to ≤ 5.0, and > 5.0 mmol/L), multivariable analysis shows that when analyzing these five categorized serum potassium groups as an ordinal variable, each incremental category increase was associated with a 12% higher risk of death in the fully adjusted model (OR 1.12, 95% CI 1.04–1.21, P = 0.004)(Table S2). We conducted additional sensitivity analyses incorporating eGFR as an alternative measure of kidney function in Models 4 and 5 (Table S3). In Model 4, adjusted for age, sex, and eGFR, each 1 mmol/L increase in serum potassium was associated with a 39% increased risk of 28-day ICU mortality (OR 1.39, 95% CI 1.29–1.50, P < 0.001). In the fully adjusted Model 5 (with eGFR replacing serum creatinine along with all other covariates), the association remained significant but attenuated, with each 1 mmol/L increase corresponding to a 21% increased mortality risk (OR 1.21, 95% CI 1.07–1.37, P = 0.003).
Analysis using a generalized additive model revealed a significant linear association between serum potassium and 28-day ICU mortality after multivariable adjustment (χ2 = 10.73; P = 0.001)(Fig. 2). This finding was confirmed by restricted cubic spline analyses with both 3 knots (overall: χ2 = 11.97, P = 0.003; non-linearity: χ2 = 0.32, P = 0.574)(Figure S1) and 4 knots (overall: χ2 = 12.42, P = 0.006; non-linearity: χ2 = 0.79, P = 0.675)(Figure S2), where the non-significant tests for non-linearity further supported a predominantly linear relationship. Additionally, the smooth curve fitting analysis using a fully adjusted model with eGFR replacing serum creatinine also demonstrated a statistically significant association between serum potassium levels and 28-day ICU mortality (χ2 = 9.013, P = 0.003) (FigureS3). Furthermore, to assess robustness, restricted cubic spline analyses with eGFR replacing serum creatinine confirmed significant associations between serum potassium and 28-day ICU mortality using both 3 knots (P-overall = 0.006, P-nonlinear = 0.562) (Figure S4) and 4 knots (P-overall = 0.015, P-nonlinear = 0.742) (Figure S5).
Fig. 2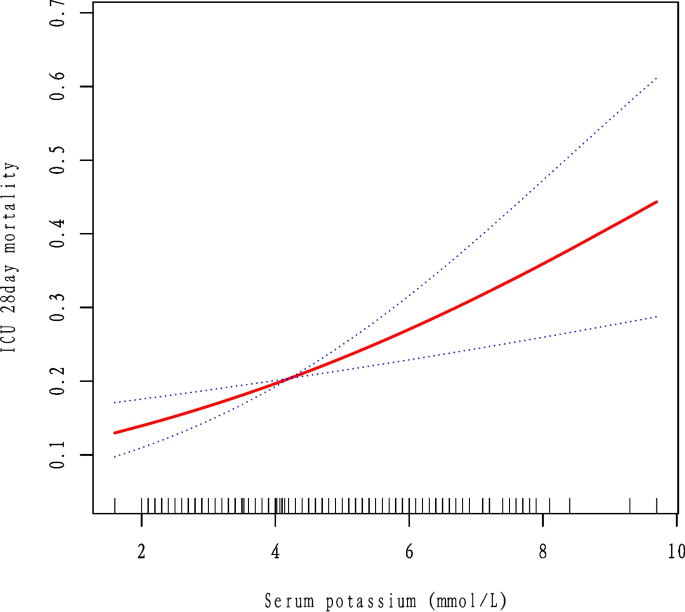
Association between serum potassium levels and 28-Day ICU mortality among elderly patients with sepsis analyzed using a generalized additive model with smoothing splines. The solid line represents the fitted curve, and the shaded area indicates the 95% confidence interval. The x-axis shows serum potassium levels (mmol/L), and the y-axis represents the probability of 28-day ICU mortality. The smoothing term for serum potassium was statistically significant (χ2 = 10.73; P =.001; effective degrees of freedom = 1.00). The model was adjusted for age, sex, serum creatinine, ethnicity, mechanical ventilation, dialysis, metastatic cancer, congestive heart failure, albumin, acute kidney injury, Sequential Organ Failure Assessment score, blood urea nitrogen, chronic obstructive pulmonary disease, diabetes, pneumonia, body mass index, pH, calcium, and sodium