
Patients and control groups
This study was an integrated part of a more extensive observational cohort study during the years 2018–2021, comprising visual and motor functions in children 5–13 years of age prenatally exposed to OMT (n = 63), and an age-matched control group (n = 63). The study was a collaboration between two different hospitals in Norway, Sørlandet Hospital (centre A) and Haukeland University Hospital (centre B), and recruitment of children to the study took place at both centres. Inclusion criteria for the OMT-group were: mother had been on OMT during pregnancy, and age at examination was between 5 and 13 years. The response rate was high at both study centres, in particular at centre A (95% in the OMT-group and 79% in the control group), but also at centre B (74% in the OMT-group and 50% in the control group). The details of the recruitment procedure have been described in a previous publication [19].
During the recruitment period, similar numbers of OMT-exposed children were entered into the study at the two participating centres (n = 32 at centre A and n = 31 at centre B). However, there were significantly more control children recruited at centre A (n = 53) than at centre B (n = 10). As the OCT instruments were different at the two centres, comparison of the OCT data between the OMT-exposed children and the controls had to be done separately, making it necessary to include more control children at centre B after inclusion in the main study had been closed, exclusively for the OCT-study. Thus, 14 additional healthy controls were recruited, making up a control group at centre B of totally 24 children. All children in the study except ten were born at term. Among the ten children born preterm (gestational age < 37 weeks), five were in the OMT-group (mean gestational age 35.0 ± 0.7 weeks) and five were in the control group (35.2 ± 0.8 weeks). No children had a gestational age less than 34 weeks.
Ocular fundus and OCT examination
As part of the study protocol, all the participating children (both the OMT-exposed and the control group) underwent a clinical examination of the ocular fundus after the instillation of dilating eye drops in both eyes (cyclopentolate 1%). This was done either with indirect ophthalmoscopy and a 20D lens, or with the slit lamp and a 90D lens. In addition, a colour fundus photo was taken, primarily for a closer evaluation of the optic disc. At centre A, the colour fundus photo was obtained by the OCT instrument (Topcon DRI OCT Triton, Topcon Corp., Tokyo, Japan), whereas centre B used a Zeiss fundus camera (Zeiss FF450 plus IR, Carl Zeiss Meditec, Jena, Germany) for this purpose. Both instruments have programs with a calliper function for the measurements of retinal structures on the images, and horizontal and vertical optic disc diameter for each eye was recorded (mean values of three measurements).
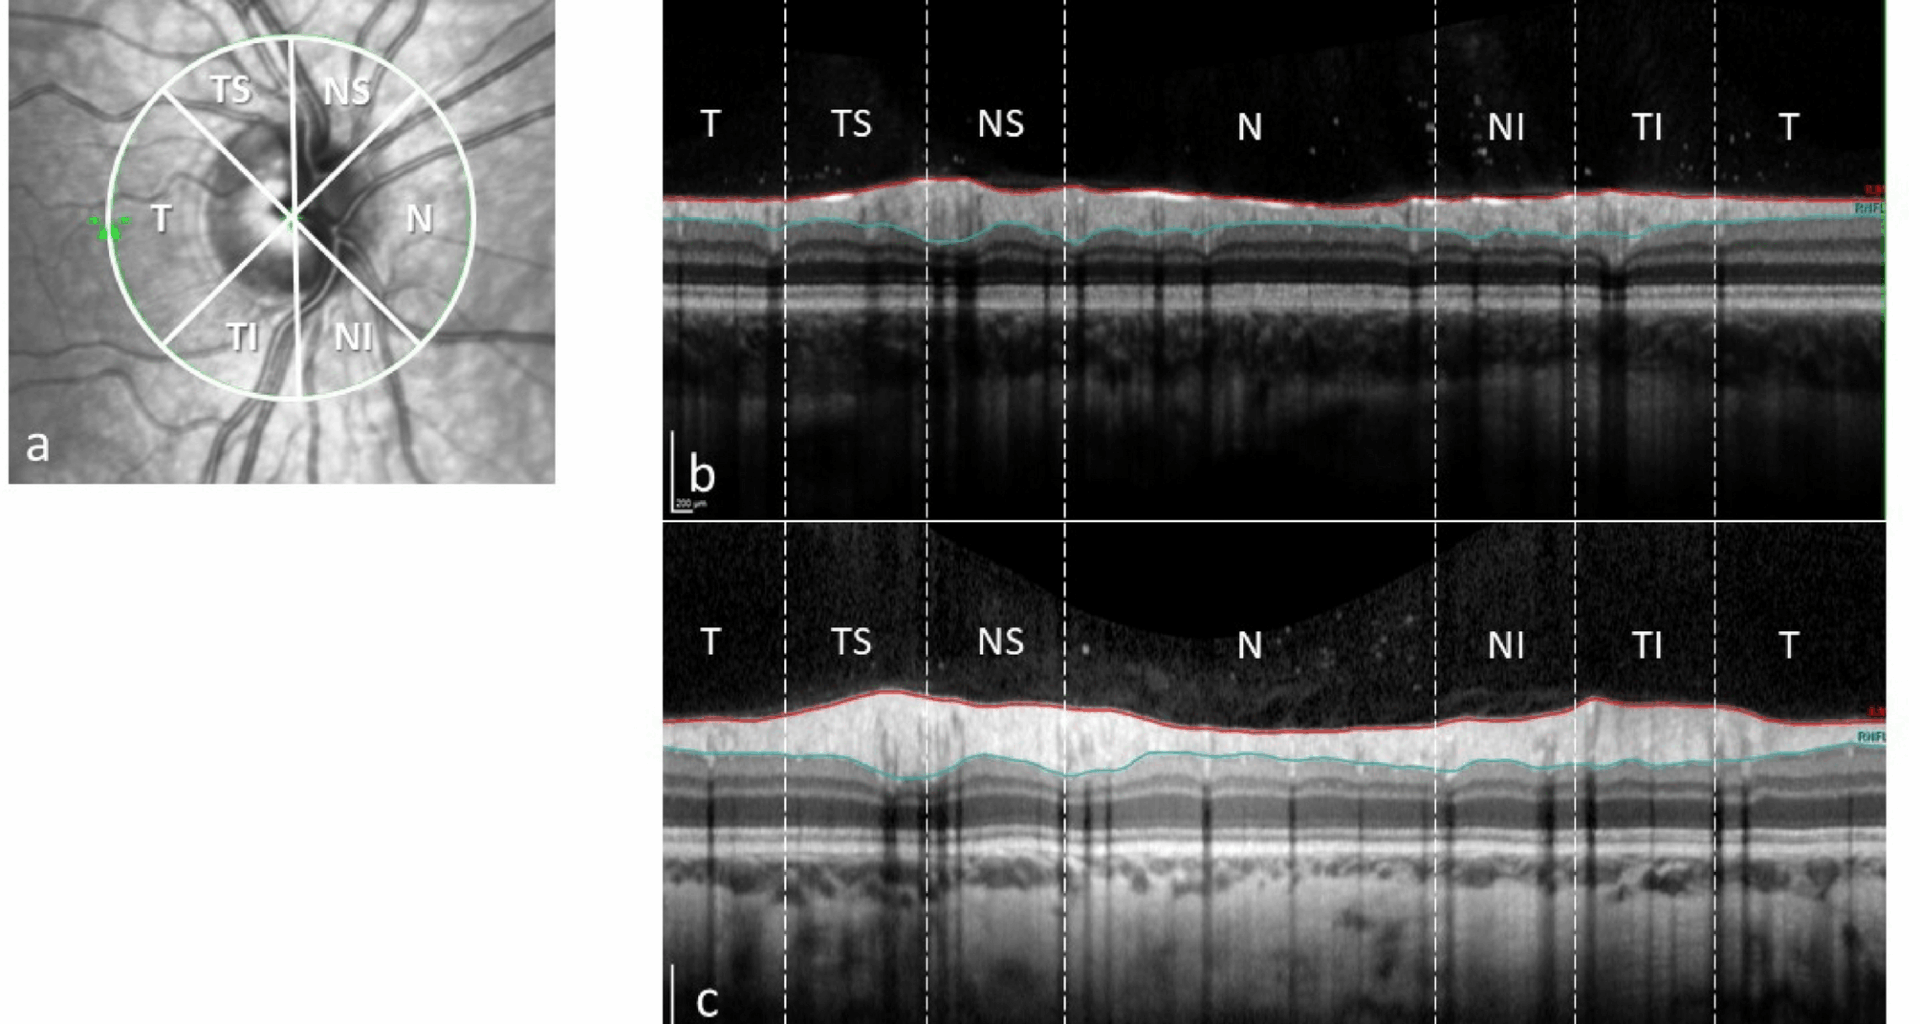
Furthermore, an OCT of the optic nerve head (peripapillary RNFL) and macula (retinal thickness and volumes) was done on both eyes. For the OCT examinations, there were also different instruments at the two centres; Topcon DRI OCT Triton (same instrument as above) at centre A, and Heidelberg Spectralis (Heidelberg Engineering GmbH, Heidelberg, Germany) at centre B. Mean average peripapillary RNFL thickness of the nerve head and of the six different sectors (temporal, nasal, nasal superior, nasal inferior, temporal superior and temporal inferior) was measured at both centres. Peripapillary RNFL is measured with a circle scan (diameter 3.0 mm) around the optic nerve. On an out-stretched scan of this circle, the inner limiting membrane and the border between the RNFL and the ganglion cell layer are outlined. From these two lines, the RNFL thickness is measured (Fig. 1).
Fig. 1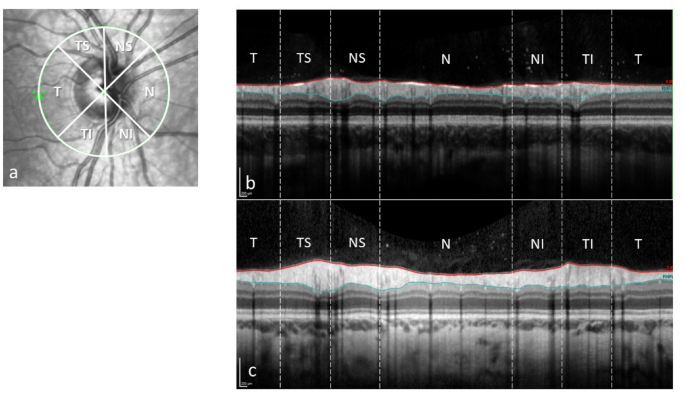
Peripapillary retinal nerve fibre layer; sectors (a), thickness scan (between the red and blue lines) from an OMT-patient (b) and a normal control (c). T: temporal, TS: temporal superior, NS: nasal superior, N: nasal, NI: nasal inferior, TI: temporal inferior
In macular OCT measurements, mean thickness of the nine subfields defined in the Early Treatment Diabetic Retinopathy Study (ETDRS) grid [23] was measured. Centrally, this grid has an inner circle around the fovea, with a diameter of 1 mm. Two additional, concentric circles outside the first circle, with diameters of 3 and 6 mm, respectively, define an inner zone (parafoveal, between the first and second circle) and an outer zone (perifoveal, between the second and third circle). Furthermore, the inner and outer zones are divided into 4 subfields by oblique lines, creating upper, lower, nasal and temporal sectors in both the inner and outer zones (Fig. 2).
Fig. 2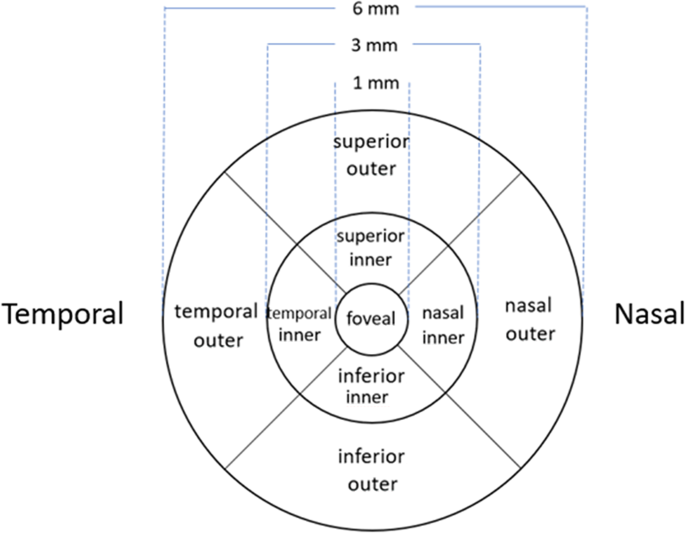
The ETDRS macular grid with nine subfields
Mean volume of each of the nine subfields was only possible to measure with the Heidelberg OCT instrument at centre B, while total macular volume (the whole grid area) could be measured at both centres. At centre A, an experienced ophthalmologist (JTM) did both the OCT examinations and the OCT image analyses, while at centre B, the examinations were done by an experienced ophthalmic photographer, and the image analyses were performed by an experienced ophthalmologist (OHH). The OCT scans were checked for centration and segmentation errors. When transferring the data from the OCT-instruments to the statistic program, all the data were also manually checked for outliers and transfer errors.
In order to explore any relation between the OCT-data and brain volume data from the MRI-article [21], we did correlation analyses between the average RNLF measurement of the optic nerve head and the 34 different MRI-measured volumes, performing separate analyses for left and right sides (left eye data to left brain volumes and vice versa).
Statistical analyses
SPSS version 29 (IBM Corp., Armonk, NY, USA), was used in the analyses. To compare OCT measurements between the OMT-exposed and the control group, as well as within the OMT-group, Student’s t-test was used, assuming a normal distribution of the means. Correlation analyses were performed using Pearson’s correlation coefficient. A two-sided p-value of ≤ 0.05 was considered as level of significance.