
Comparison of general characteristics and associated factors among older adults with different frailty statuses
A total of 9,093 older adults were included in this study, with ages ranging from 62 to 101 years and a mean age of 71.2 ± 7.0 years. Among them, 4,495 were women (mean age: 71.5 ± 7.2 years) and 4,598 were men (mean age: 70.9 ± 6.8 years). The distribution of frailty status among participants was as follows: 39.3% were classified as robust (3,572/9,093), 45.1% as pre-frail (4,098/9,093), and 15.6% as frail (1,423/9,093). Higher proportions of pre-frailty and frailty were observed among older participants, women, individuals from ethnic minority groups, those residing in rural areas, and those with lower educational attainment.
The analysis was further stratified by gender. Among older women, frailty status varied significantly across different age groups, ethnicities, places of residence, and marital statuses. In older men, frailty status also exhibited significant variation according to age group, educational level, and marital status (all P < 0.05). Additionally, all other factors examined—except for annual medical checkups, medicare coverage, and participation in online education—were found to be associated with frailty status in both men and women (Table 1).
Table 1 Comparison of general characteristics and related factors among older adults with different levels of frailtyAnalysis of frailty status in older adults at baseline and follow-up
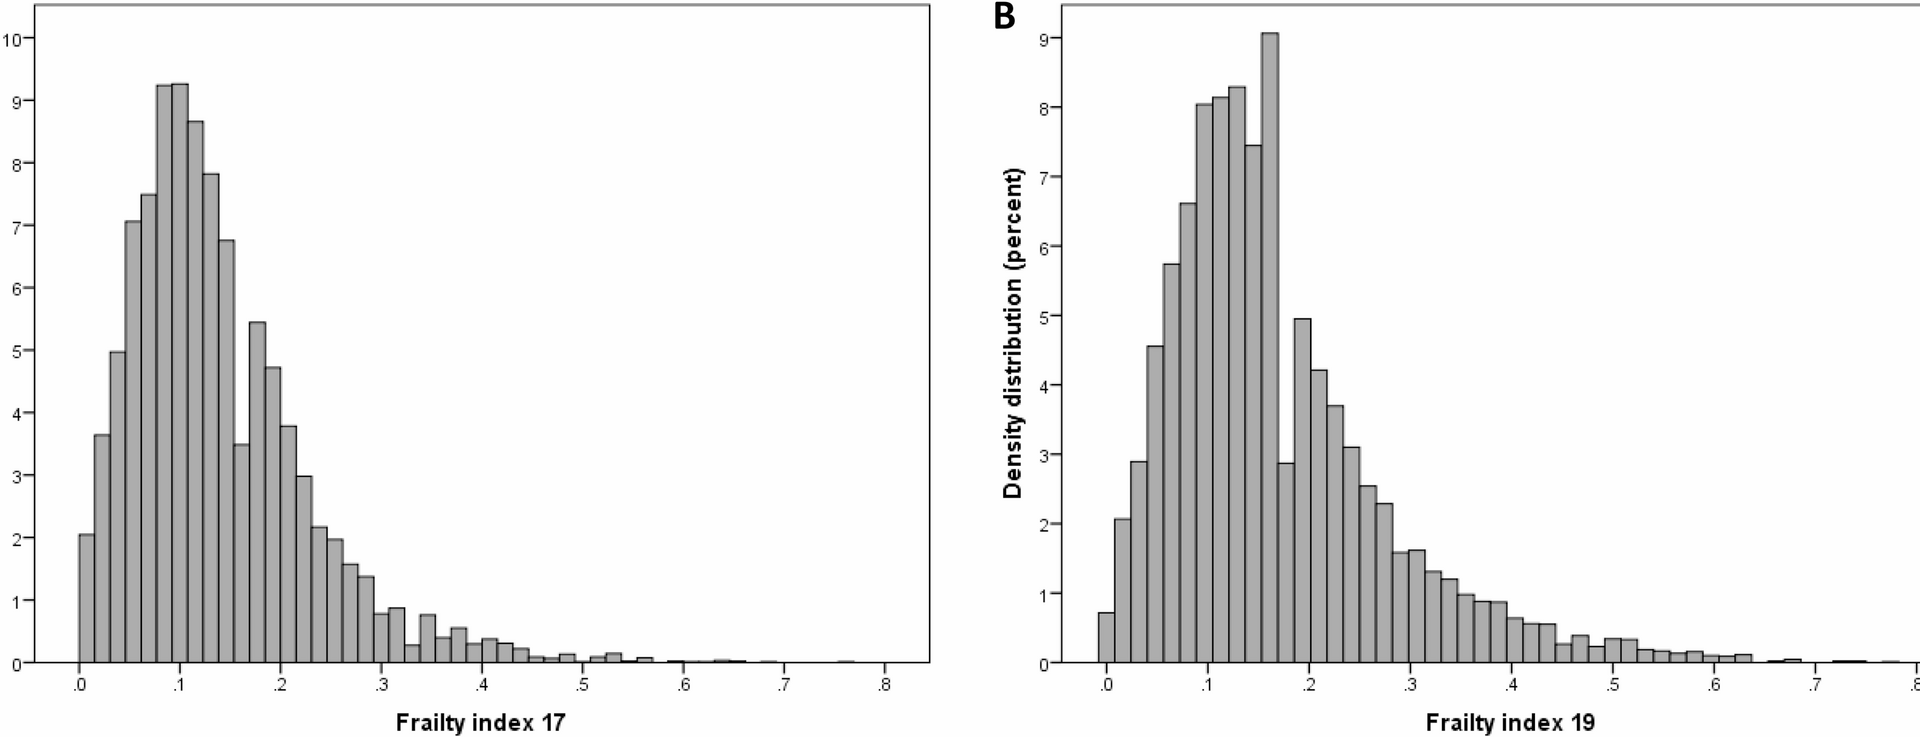
At baseline in 2017, the 9,093 older adults had a minimum FI value of 0, a maximum value of 0.76, a median of 0.12, a mode of 0.09, and a mean value of 0.14 ± 0.09. Specifically, men had a median FI value of 0.10 and a mean of 0.12 ± 0.08, while women had a median FI value of 0.14 and a mean of 0.15 ± 0.09. At the 2019 follow-up, the minimum FI value was 0, the maximum value was 0.77, the median was 0.14, and the mean FI value was 0.16 ± 0.11. For men, the median FI value was 0.13, with a mean of 0.15 ± 0.10, whereas women had a median FI value of 0.15 and a mean of 0.18 ± 0.11 (Fig. 1A–B). FI values were compared between men and women across different age groups. FI values increased with age, and women were found to be more frail than men in all age groups (Fig. 2A–B).
Fig. 1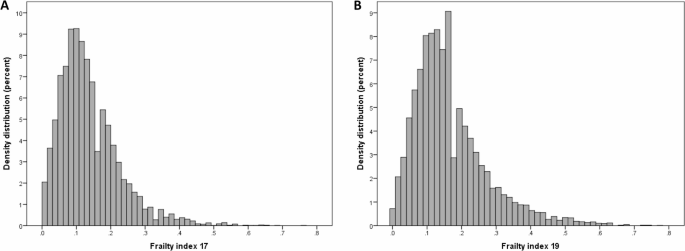
Distributions of frailty index (FI): panel (A) older adults at baseline in 2017.Panel (B) older adults at follow-up in 2019
Fig. 2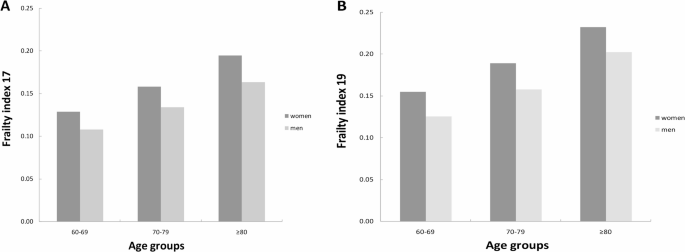
Mean frailty index in relation to age and sex. Panel (A) older adults at baseline in 2017. Panel (B) older adults at follow-up in 2019
Subsequently, trends in FI values across age groups were analyzed for older adults of different sexes. FI values increased exponentially with age in both older men and women, as represented by the model Ln(FI) = A + BXage. Women consistently exhibited higher FI values than men at all ages, both at baseline in 2017 and at follow-up in 2019. Notably, the frailty status of older men at the 2019 follow-up was comparable to that of older women at baseline in 2017 (Fig. 3). On a logarithmic scale, at baseline in 2017, older women showed a slightly lower rate of health deficit accumulation compared to men; however, this differences was statistically insignificant (B = 0.020 vs. B = 0.021, t = 1.049, P = 0.639). In contrast, by 2019, the mean annual relative growth rate of FI values was higher in women than in men (B = 0.023 vs. B = 0.020, t = 5.100, P < 0.001). This indicates that older women accumulated health deficits at a faster rate than men (Fig. 3).
Fig. 3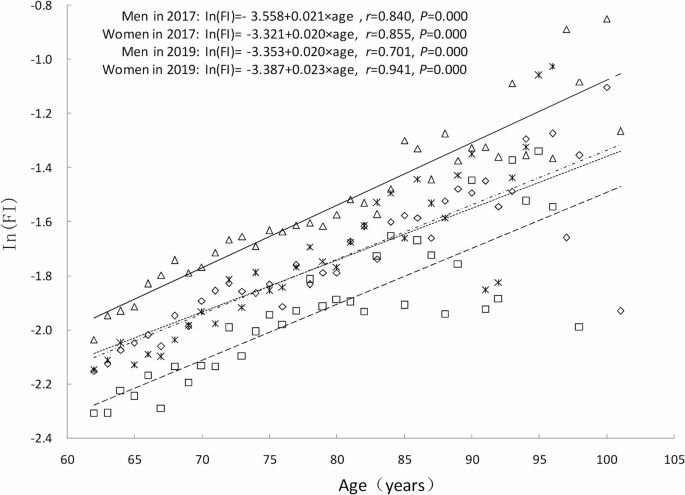
The relationship between age and the mean value of frailty index (FI) at baseline in 2017 and at follow-up in 2019. Men in 2017: square and dashed line; Women in 2017: diamond and dotted line; Men in 2019: star and dashed and dotted line; Women in 2019: triangle and solid line
Changes in frailty status
At baseline in 2017, the proportions of robust, pre-frail, and frail older adults were 39.3% (3,572/9,093), 45.1% (4,098/9,093), and 15.6% (1,423/9,093), respectively.By 2019, these proportions changed to 30.6% (2,784/9,093), 45.0% (4,089/9,093), and 24.4% (2,220/9,093). Over the 2-year follow-up, the frailty status of most older adults remained stable (56.2%, 5,111/9,093). However, 14.2% (1,292/9,093) experienced an improvement in frailty, while 29.6% (2,690/9,093) showed worsening frailty. Among those who remained in the same frailty category, 54.3% (1,939/3,572) of robust older adults, 55.1% (2,259/4,098) of pre-frail older adults, and 64.2% (913/1,423) of frail older adults did not change from their baseline frailty status. In terms of frailty transitions, 38.7% (1,383/3,572) of baseline robust older adults transitioned to pre-frail status, 25.8% (1,057/4,098) of pre-frail older adults progressed to frailty, and 7.0% (250/3,572) of robust older adults directly progressed to frailty. Notably, 31.4% (447/1,423) of frail older adults improved to a pre-frail status at the 2-year follow-up, 19.1% (782/4,098) of pre-frail older adults improved to a robust status, and 4.4% (63/1,423) of frail older adults reverted to robust status. Overall, transitions to more frail statuses (i.e., deterioration) were more common than improvements in frailty. Furthermore, transitions between adjacent frailty statuses occurred more frequently than transitions spanning multiple frailty stages [3,669 (40.3%) vs. 313 (3.4%)] (Fig. 4).
Fig. 4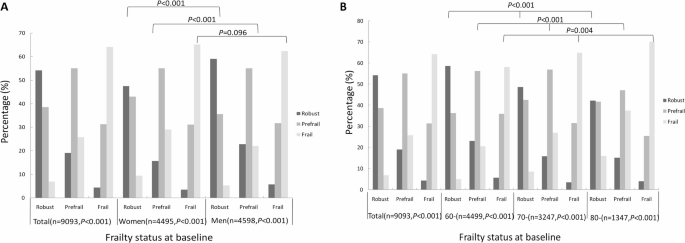
Changes in frailty status from baseline to follow-up: (A) according to sex, (B) according to age group
Further sex subgroup analyses revealed that among older women, 54.6% (2,453/4,495) had stable frailty statuses, 14.1% (635/4,495) showed improvement, and 31.3% (1,407/4,495) experienced worsening frailty. In contrast, among older men, 57.8% (2,658/4,598) had stable frailty statuses, 14.3% (657/4,598) showed improvement, and 27.9% (1,283/4,598) experienced worsening frailty. Overall, a higher proportion of women than men experienced worsening frailty (χ2 = 13.148, P = 0.001). Specifically, among robust and pre-frail older adults, a higher proportion of men than women maintained stable or improved frailty statuses, while women were more likely to experience worsening frailty (χ2 = 55.849, 47.820, both P < 0.001). However, among frail older adults, the difference in frailty status transitions between men and women was not statistically significant (χ2 = 4.695, P = 0.096) (Table 2; Fig. 4A). Age subgroup analyses showed that in the 60 + group, 57.7% (2,595/4,499) of older adults had stable frailty statuses, 13.8% (623/4,499) showed improvement, and 28.5% (1,281/4,499) experienced worsening frailty. In the 70 + group, these proportions were 55.6% (1,806/3,247), 14.0% (454/3,247), and 30.4% (987/3,247), respectively. For the 80 + group, the proportions were 52.7% (710/1,347), 16.0% (215/1,347), and 31.3% (422/1,347) (Table 2; Fig. 4B). Notably, the risk of worsening frailty increased with age (χ2 = 12.297, P = 0.015). Additionally, the association between age and frailty transition was significant across all baseline frailty statuses (robust, pre-frail, or frail) (χ2 = 82.809, 93.467, 15.251, all P < 0.05). In other words, older adults were more likely to experience worsening frailty as age increased (Table 2; Fig. 4B).
Table 2 Changes in frailty status among the study participants according to sex and ageLogistic regression analysis of factors influencing frailty transition in older adults
The baseline FI values for older adults whose frailty status remained stable, worsened, or improved were 0.14 ± 0.10, 0.10 ± 0.05, and 0.19 ± 0.07, respectively. Individuals with higher baseline frailty were more likely to experience improvements in their frailty statuses (F = 423.633, P < 0.001). Logistic regression analyses were conducted to investigate the factors influencing frailty transitions at different baseline frailty levels. The results are as follows: (1) Demographics: Among older adults with different frailty statuses, increasing age, being female, and living in a rural area were associated with worsened frailty status. However, being widowed, divorced, or unmarried, as well as having a low level of education, increased the risk of worsened frailty status only among robust and pre-frail older adults; these factors did not correlate with improved frailty status in frail older adults. Additionally, ethnic minority older adults were more likely to experience frailty improvement compared to Han Chinese older adults. (2) Family and economic status: Living alone increased the risk of worsened frailty status among pre-frail older adults. However, for frail older adults, living alone was associated with a higher likelihood of frailty improvement. Among robust and pre-frail older adults, being in paid work, receiving a pension, owning a home, and having good financial status reduced the risk of worsened frailty, but these factors had no effect on frail older adults. (3) Health and medical status: Engaging in more weekly exercise decreased the risk of worsened frailty but had no effect on frail older adults. Additionally, a 2-week illness history increased the risk of worsened frailty among robust older adults. Annual medical checkups reduced the risk of worsened frailty in robust older adults, but had no effect on pre-frail and frail older adults. Hospitalizations in the past year increased the risk of worsened frailty for both robust and pre-frail older adults. (4) Caregiver support: Providing support during illness had a positive effect on frailty improvement among pre-frail and frail older adults.(5) Social participation: Regular engagement in public welfare, senior associations, helping seniors in need, recreational activities (such as playing ball games or fishing), and internet access decreased the risk of worsened frailty, especially for robust or pre-frail older adults (Table 3).
Table 3 Logistic regression for factors influencing 2-year changes in frailty among the study participants [OR(95%CI)]
Further subgroup analysis by sex revealed the impact of various factors on frailty transition: (1) Demographics: age and place of residence affected frailty transitions in both older men and women. However, frail ethnic minority men were more likely to improve their frailty status compared to Han Chinese frail men. Educational attainment influenced frailty transitions only among pre-frail women. Additionally, marital status primarily affected pre-frail older women and robust older men. (2) Family and economic status: Living alone influenced frailty transitions in pre-frail older women and frail older men. All economic status variables were associated with frailty transitions in both men and women, except for receiving a pension, which only affected older women. (3) Health and medical status: The frequency of weekly exercise and hospitalizations in the past year influenced frailty transitions in both older men and women.A 2-week illness history affected only robust women. Moreover, annual medical checkups provided protection against frailty transitions in robust individuals but had no effect on pre-frail or frail individuals. (4) Caregiver support: Caregiver support during illness positively influenced frailty improvement, especially in frail older women and pre-frail and frail older men.(5) Social participation: With the exception of participation in online education, social participation positively affected frailty transitions among robust or pre-frail older men and women but had minimal impact on frail individuals (Table 3).