
Sign up for the Starts With a Bang newsletter
Travel the universe with Dr. Ethan Siegel as he answers the biggest questions of all.
When we measure an object that’s nearby — on Earth, in our Solar System, or elsewhere within the Milky Way — the information we get from the light that arrives is relatively straightforward. An object like the Sun, 150 million kilometers away, will have its light arrive after a journey of 500 seconds: the amount of time it takes light to travel across that distance of space. A star that’s 10 light-years away will have its emitted light arrive after a journey of 10 years; a star on the opposite edge of the galaxy a full 80,000 light-years away will require 80,000 years for its emitted light to arrive. For all of these objects,
they’re at a redshift of 0,
the temperature of the Big Bang is a cool 2.725 K,
and their distance (in light-years) and how long ago we’re seeing them (in years) are the same.
But that’s only because our planet, our Solar System, our galaxy, and even our Local Group are all gravitationally bound together. The space that separates two points within these structures is not expanding, but if we look to the broader Universe and to all galaxies more than about 5 million light-years away, the expansion of the Universe begins to matter. We have a few different parameters we can use to describe any distant object, including redshift, the cosmic temperature, the distance to it, or the “lookback time” to it, but the relationship is complicated. Here’s how they all relate.

The visible light spectrum of the Sun, which helps us understand not only its temperature and ionization, but the abundances of the elements present. The long, thick lines are hydrogen and helium, but every other line is from a heavy element that must have been created in a previous-generation star, rather than the hot Big Bang.
Credit: N.A.Sharp, NOAO/NSO/Kitt Peak FTS/AURA/NSF
Let’s start with the easiest thing to measure: redshift. When you measure a distant object, what you’re actually measuring is its light, or the photons (or, equivalently, light waves) emitted from that source that are now arriving at your eyes. When we have atoms, molecules, or ions in a laboratory setting, we can see that there are three types of light signals that can emerge from them.
There’s the continuum light, which is what happens to any object or system that gets heated up to a specific temperature: it emits a thermal, blackbody spectrum of radiation.
There are emission lines, which is what happens when atoms, molecules, or ions have electrons in an excited state. As the electrons cascade down in energy, from higher energy levels to lower energy levels, they emit light of a specific set of wavelengths: wavelengths that correspond to the quantum transitions particular to the atomic, molecular, or ionic configuration of that particular species.
And there are absorption lines, which is the exact opposite (absorptive) of the emission line (emissive) scenario. Those same atoms, molecules, and/or ions absorb the light from behind them — whether from a quasar, a background galaxy, a star, or from the continuum — revealing those same characteristic quantum transitions.
As long as that light travels through flat, unchanging, non-expanding space, the emitted wavelength will match the received/observed wavelength, just like it does for the light from our own Sun.
When light is emitted from a source, it has a particular wavelength. The longer it must travel through the expanding Universe before being absorbed by an observer, the greater the amount that the wavelength of that light will be redshifted, or stretched to longer values, compared to the wavelength it has when it was emitted.
Credit: Ben Gibson/Big Think
But if the space between the emitted object and the observer is indeed expanding, then the light’s wavelength will also stretch as it travels through the space separating the source from the observer. The light travels through the expanding Universe, and this “stretching of space” imprints itself onto the wavelength of the light within that space, causing the wavelength itself to lengthen as well. Because blue light is short-wavelength light and the red light is long-wavelength light, the act of the light lengthening is known as “redshifting” as well, and when we observe light that’s longer in wavelength than it was when it was emitted, we refer to that light as being redshifted.
It’s relatively straightforward to define what redshift is: it’s the factor by which the observed light’s wavelength is longer than the emitted light wavelength. If the light exhibited no redshift at all, then the emitted wavelength (λe) and the observed wavelength (λo) will be equal. In that case, the redshift (z) equals zero, because the ratio of the observed wavelength to the emitted wavelength equals 1.
But if there is a redshift, then the observed wavelength will be longer than the emitted wavelength, and the amount of lengthening is what corresponds to redshift. Mathematically, this means that λo/λe = 1 + z. That’s not just an equality; that’s the very definition of redshift.
Every element in the Universe has its own unique set of atomic transitions that are allowed, corresponding to a particular set of spectral lines. We can observe these lines in galaxies other than our own, but although the pattern is the same, the lines we observe are systematically shifted relative to the lines we create with atoms on Earth. When the distances are large, it’s safe to estimate that ~100% of the redshift is due to cosmic expansion.
Credit: Georg Wiora (Dr. Schorsch)/Wikimedia Commons
When you see a distant object — like a quasar or galaxy, for example — you can’t measure its redshift directly. What you can do, however, is use the technique of spectroscopic observing to measure where its absorption and/or emission lines are. Because we know how atoms, molecules, and ions emit and absorb light, each species that we can identify will leave a unique “fingerprint” in the light signature of any object containing that species. Simply by matching up the lines we observe from a distant galaxy with the lines we observe in the laboratory, multiplied by that key redshift factor of (1 + z), allows us to figure out what the redshift of that object is.
The easy thing that allows you to figure out next is what the temperature of the Universe was when that light was emitted. Light that travels through the expanding Universe — applying to all forms of light, including the light left over from the hot Big Bang itself — will all stretch by the same factor: that factor of (1 + z). Because we can exquisitely measure the temperature of the light left over from the Big Bang in today’s Universe, T = 2.725 K, all we have to do to know the temperature of the Universe at the moment it was emitted from the object we’re observing is to multiply today’s temperature by that same factor: 1 + z.
The observational evidence that probes the temperature of the cosmic microwave background at different epochs in the Universe, including at present (red star), in the relatively nearby Universe (blue points), and in the distant Universe (red points) all shows that the Universe was hotter in the past, and has cooled as it’s expanded exactly as predicted by the Big Bang theory.
Credit: P. Noterdaeme et al., Astronomy & Astrophysics, 2011
This isn’t just something we know “in theory,” as we have techniques to directly measure the cosmic microwave background’s temperature as a function of redshift, and it agrees spectacularly with this prediction.
But what about time?
Time is a little bit more complicated, because the light doesn’t travel a “fixed distance” that’s easy to calculate the way we would calculate the distance between two points on the Earth’s surface. If you wanted to know, for example, the distance between Detroit and Chicago, you could take the curvature of the Earth into account and map out the shortest path one could take between those two cities. The distance between them turns out to be precisely 383.63 kilometers (or 238.38 miles), meaning that if you transmitted a light signal between those two locations, it would take 1.28 milliseconds: the amount of time it takes to traverse that distance at the speed of light, or at 299,792,458 meters-per-second.
In an expanding Universe, however, distances change between any two points as a light signal travels from the emission point to its eventual absorption point at the observer’s destination, and so it becomes a more complicated task to calculate the light-travel time between any two points.

This simplified animation shows how light redshifts and how distances between unbound objects change over time in the expanding Universe. Note that the objects start off closer than the amount of time it takes light to travel between them, the light redshifts due to the expansion of space, and the two galaxies wind up much farther apart than the light-travel path taken by the photon exchanged between them.
Credit: Rob Knop
We have a similar problem with distance, for exactly the same reason. In fact, when we ask the question, “what is the distance between an emitted light signal and the observer who receives (and absorbs) that light signal,” we have to recognize that — unlike the Detroit-to-Chicago distance we just considered earlier — the distance between those two points actually changes over the timespan that the light signal travels from the source to the observer. When you ask about the distance between any two points, you have to specify whether you mean:
the distance between the source and the observer at the moment the light signal was first emitted,
the distance between the source and the observer at the moment that the light signal finally arrives at the observer,
or the distance that the light traveling between the source and the observer traverses along its entire journey.
Because of where and when we, the observers, are located, we consider distance and time a little bit differently from one another. We consider “distance” as the second option: the amount of distance that — if you could somehow transport instantly from where you are to the source that you’re looking at — separates where we are from where we’re looking. But we consider time as the light-travel time from the third option, because that’s the amount of time the light that we’re observing actually spent journeying from the emitting source to us, the observer that now receives it.
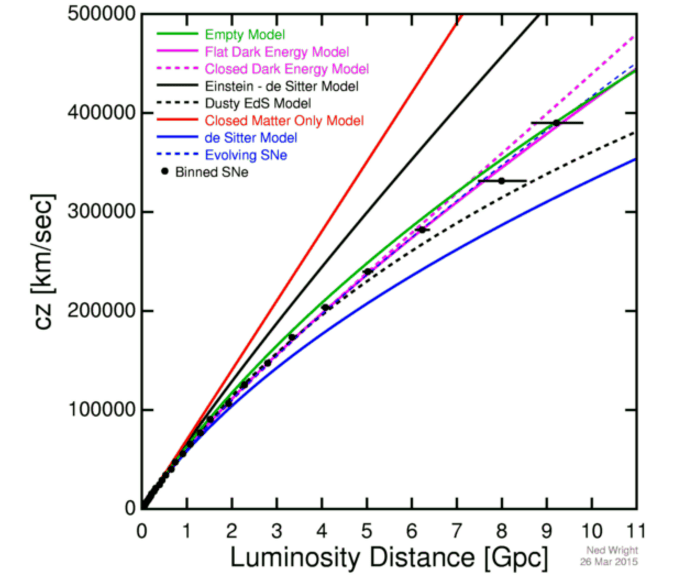
A plot of the apparent expansion rate (y-axis) vs. distance (x-axis) is consistent with a Universe that expanded faster in the past, but where distant galaxies are accelerating in their recession today. This is a modern version of, extending thousands of times farther than, Hubble’s original work. Note the fact that the points do not form a straight line, indicating the expansion rate’s change over time. The fact that the Universe follows the curve it does is indicative of the presence, and late-time dominance, of dark energy.
Credit: Ned Wright/Betoule et al., 2014
In order to perform those calculations, you need to understand precisely how the Universe expands over time, and that requires a knowledge of two things.
First, you need to measure the Hubble parameter today — sometimes called the Hubble constant — by measuring both the distance to and the redshift of a wide variety of objects. Although we’re currently reckoning with the puzzle of the Hubble tension, where groups using an early relic method get a value like 67 km/s/Mpc and groups using the more traditional distance ladder method get a value that’s around 9% greater at 73 km/s/Mpc, the answer from either group can be used to get the right answer.
And second, you need to figure out the fractional energy density of each component that makes up the Universe. This means you need to know what percent (or fraction) of the Universe’s energy density is in all its various forms: dark matter, dark energy, normal matter, neutrinos, photons, etc. You need to know what makes up the Universe, along with how those various components of the Universe evolve throughout cosmic time.
You might worry that the Hubble tension is a big problem for our endeavors to know the distance to a faraway object as well as the time it took the light to travel from the source to the destination (either called the “light-travel time” or the “lookback time”), but it turns out there’s a profound reason why it doesn’t matter very much.
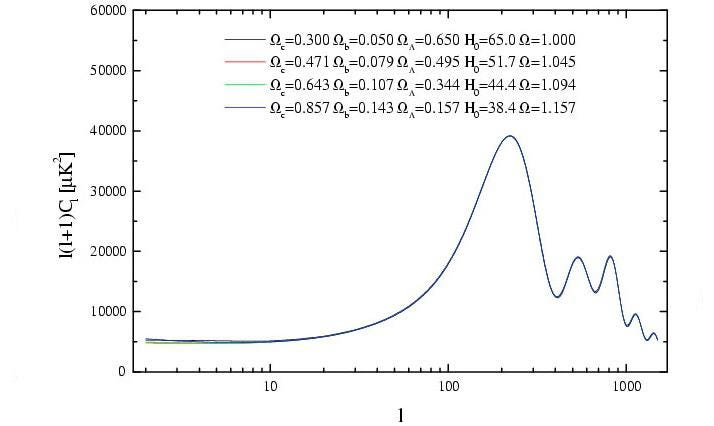
Four different cosmologies lead to the same fluctuation patterns in the CMB, showing how different combinations of an expansion rate and the fractional components of the Universe can lead to identical results. Even though the present expansion rate of the Universe is severely different between all of the models shown here, parameters like the age of the Universe or the cosmic distance between any two points only change very slightly as we vary the allowable models.
Credit: A. Melchiorri & L.M. Griffiths, 2001, NewAR
That reason is this: the best-fit values for the fractional energy components are highly dependent on the value of the Hubble constant that we choose. For example, if we choose a Hubble constant value of 73 km/s/Mpc, which is what we obtain from the distance ladder methods, then that leads to a Universe that is:
76.5% dark energy,
18.5% dark matter,
4.9% normal matter,
0.1% neutrinos,
and about 0.01% photons,
giving us a Universe that is 13.8 billion years old, today, and where the maximum observable distance is approximately 47.8 billion light-years away.
On the other hand, if you choose the alternative value of the Hubble constant that comes from the other plausible class of measurements, the early relic methods, we’re stuck with a smaller value of 67 km/s/Mpc. The best-fit values for that Universe’s composition are instead:
67.9% dark energy,
27.1% dark matter,
4.9% normal matter,
0.1% neutrinos,
and about 0.01% photons,
giving us a Universe that is again 13.8 billion years old, today, and where the maximum observable distance is approximately 46.0 billion light-years away.
The cosmic age and the light-travel/lookback times are virtually identical, and the differences in distance are under 4%, even for the maximum (greatest) distances that we can observe at.
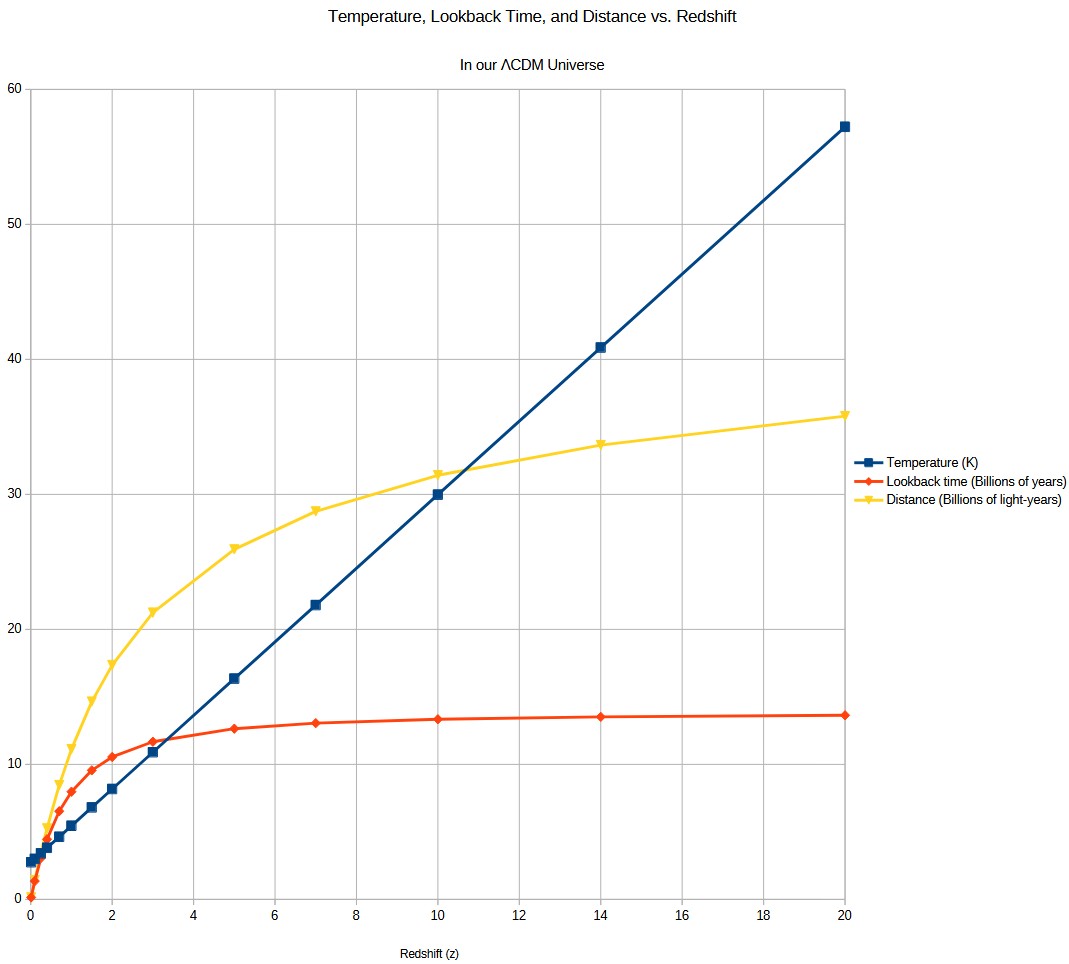
This graph calculates, based on the best established consensus values for our ΛCDM cosmology, the way that the background temperature of the universe (blue), cosmic distances (yellow) and lookback times (red) work for objects found at any redshift (x-axis). Temperatures are in K, distances are in billions of light-years, and lookback times are in billions of years.
Credit: E. Siegel
We also learn that, when we look at object that are nearby, the difference between the lookback times (in years, or to make things easier, billions of years, abbreviated Gyr) and the distances to an object (in light-years, or again, for convenience, billions of light-years, abbreviated Gly) are very small. It’s only for the very faraway objects that the differences become apparent and severe.
Here are a few sample values for redshift (z), lookback time (t), and distance (x) that you might find illustrative.
z = 0, t = 0 Gyr, x = 0 Gly.
z = 0.01, t = 0.145 Gyr, x = 0.146 Gly.
z = 0.1, t = 1.358 Gyr, x = 1.424 Gly.
z = 0.25, t = 3.063 Gyr, x = 3.423 Gly.
z = 0.4, t = 4.45 Gyr, x = 5.257 Gly.
z = 0.7, t = 6.529 Gyr, x = 8.461 Gly.
z = 1.0, t = 7.977 Gyr, x = 11.127 Gly.
z = 1.5, t = 9.558 Gyr, x = 14.651 Gly.
z = 2.0, t = 10.548 Gyr, x = 17.355 Gly.
z = 3.0, t = 11.677 Gyr, x = 21.242 Gly.
z = 5.0, t = 12.646 Gyr, x = 25.927 Gly.
z = 7.0, t = 13.055 Gyr, x = 28.737 Gly.
z = 10, t = 13.342 Gyr, x = 31.415 Gly.
z = 14, t = 13.506 Gyr, x = 33.645 Gly.
z = 20, t = 13.634 Gyr, x = 35.792 Gly.
These values — particularly the value for distance — may shift by a very small amount if we alter our cosmological parameters within the allowable uncertainties, but the differences and relationships between redshift, temperature, lookback time, and distance are very small compared to the overall nature of the established relationships, illustrated (along with the more straightforward temperature) on the graph above.
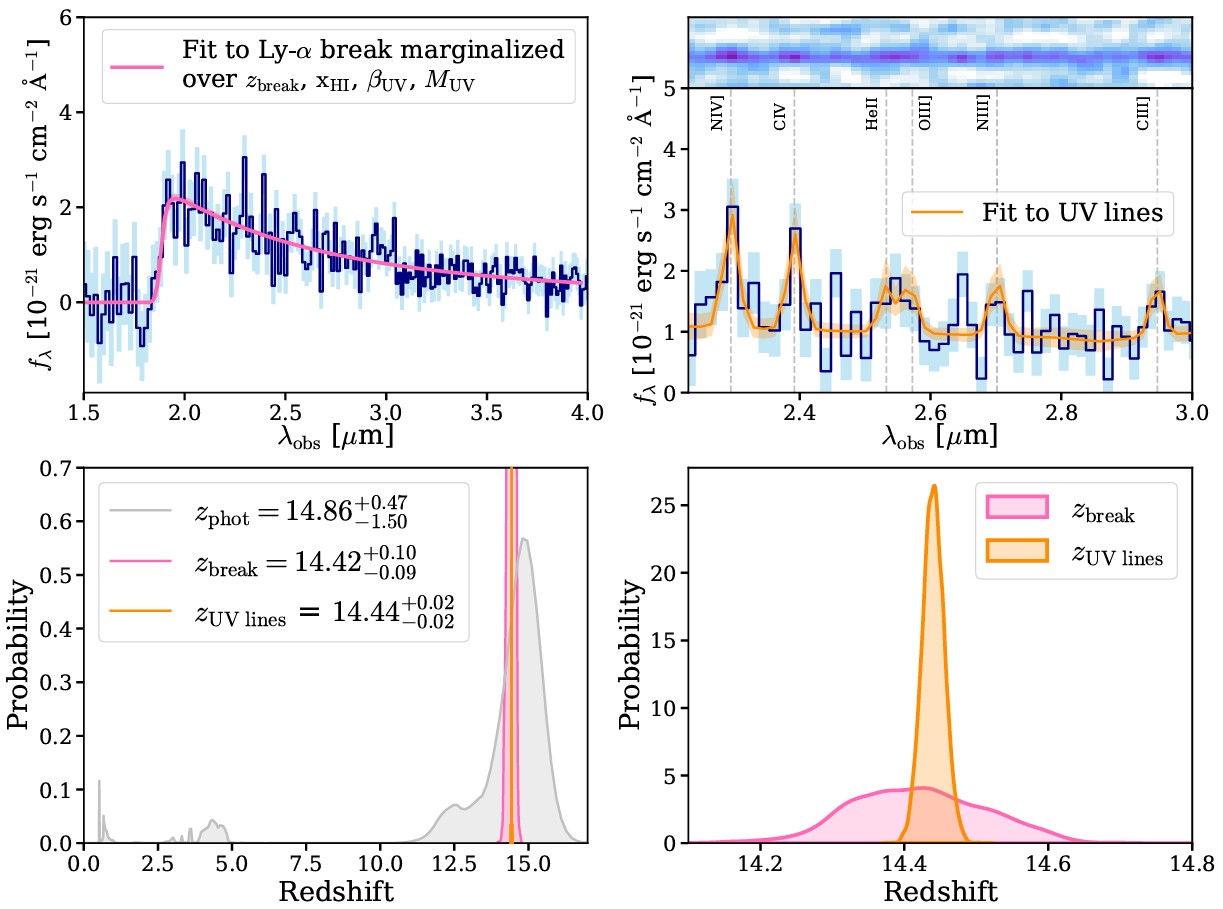
This image shows the best fit to the Lyman break feature (top left), the best fit to the identified ionized emission lines (top right), the redshift inferred from photometry, the Lyman break, and the emission lines (lower left), and the probability density of the galaxy MoM-z14 actually being at those particular redshifts (lower right). The most likely redshift peaks at z = 14.44.
Credit: R.P. Naidu et al., Open Journal of Astrophysics (submitted)/arXiv:2505.11263, 2025
This is why, for example, when we talk about the most distant galaxy discovered to date, MoM-z14, we can say things like:
it’s found to have a redshift of z = 14.4,
during a period when the Universe’s temperature was 41.97 K,
with a lookback time of 13.53 billion years, or from a time when the Universe was just 282 million years old (2% of its current age),
and located at a cosmic distance of 33.84 billion light-years.
In order to figure these things out, you have to properly account for the expanding Universe, and how distances, times, and temperatures evolve as we look at objects at higher and higher redshifts.
We can only do this — we can only determine cosmic distances and lookback times — to any degree of accuracy because of how profoundly well we’ve determined the properties and contents of the Universe. As recently as the mid-to-late 1990s, the uncertainties on such values were profound: by something like 20% at nearby distances and by up to a factor of two at larger distances. Today, however, the uncertainties on distances and lookback times to nearby objects are much less than 1%, and even for the most distant objects we’ve ever seen, barely reach the 2% level. We truly have, at long last, determined the scale of the Universe and the objects present within it. For any galaxy or quasar that we find, all it takes is a bit of spectroscopy, revealing that object’s cosmic redshift, and we truly can know it all!
Sign up for the Starts With a Bang newsletter
Travel the universe with Dr. Ethan Siegel as he answers the biggest questions of all.