
Data source
This study used data from the 2023 AHA Annual Survey9 and the 2023–2024 AHA IT Supplement10. The AHA Annual Survey collects comprehensive information on institutional characteristics and capabilities from hospitals nationwide. The IT Supplement specifically focuses on IT infrastructure, applications and operational capacities. The AHA data previously included basic questions on predictive modelling. The 2023 version expanded to include detailed questions on predictive modelling for the first time, covering use cases, development approaches and evaluation methodologies2. The 2024 version further expanded coverage by adding a few additional predictive model evaluation questions and LLM integration into EHRs. Our analysis included all hospital facilities that responded to either the 2023 or 2024 AHA IT Supplement Survey. To assess potential selection bias, we compared the characteristics of survey respondents with those of nonrespondents (Supplementary Table 1).
VariablesHospital predictive model and AI implementation measures
Hospitals were classified into three categories based on their predictive modelling capabilities using data from the 2023–2024 AHA IT Supplement: no predictive models (0), non-AI predictive models (1) or AI predictive models (2). For hospitals that responded to both the 2023 and 2024 surveys, we used the 2024 responses as they reflect the most recent implementation status. For descriptive statistics, hospitals that were survey respondents but had missing responses to this item were retained as ‘no response’ to provide transparency and to understand data patterns across groups, including nonresponse rates. For subsequent analyses, a small number of hospitals with missing responses were recoded as having no predictive models (assigned a value of 0), based on the assumption that nonresponse from the survey respondent probably indicated lack of implementation. As this imputation can cause potential bias, we conducted sensitivity analyses to test the impact. This level of predictive AI model implementation served as our primary variable of interest: it was used as a dependent variable when examining associations with geographical and institutional factors and as an independent variable when assessing relationships with quality metrics.
We developed three exploratory secondary measures to capture broader aspects of implementation, as validated composite measures for these specific aspects of AI implementation were not available in the existing literature. These secondary measures assessed the breadth of predictive model (AI and non-AI) implementation, development approaches and evaluation practices using structured scoring systems as proxy indicators for these implementation dimensions. All secondary measures incorporated the primary AI model implementation score (0–2) as a foundational component and then added domain-specific points to create composite scores that were subsequently standardized to a 0–1 scale for comparability and to prevent range-driven inflation across different metrics. The breadth score added 0.25 points for each reported model use case. The development score assigned additional points based on model source: 1.5 points for EHR vendor-developed or self-developed models, 1.0 point for third-party solutions and 0.5 points for public domain models, reflecting integration complexity and governance considerations. The evaluation score incorporated reported assessments of model accuracy and bias, with points assigned incrementally based on the comprehensiveness of the evaluation across model portfolios. For hospitals responding to the 2024 survey, an enhanced evaluation score included post-implementation monitoring and governance accountability structures. Additionally, we calculated a separate LLM readiness score for 2024 respondents, measuring the LLM integration status and implementation timeline. Throughout the article, references to the ‘evaluation score’ correspond to the version based on survey items that are consistent across both years (referred to as the 2023 version in Supplementary Table 15) to ensure comparability.
These scoring systems are exploratory and judgement-based rather than empirically validated. They were developed through author consensus and informed by published literature2,23,24,25 and should be interpreted as relative indicators for comparative analysis rather than absolute measures of implementation quality or capability. The flexible framework allows other researchers to adjust weights and scoring criteria based on their specific research priorities and the available data. As the survey questions underlying these secondary measures encompass both AI and non-AI predictive models, we use the term ‘model’ rather than ‘AI model’ when referring to these broader implementation measures (detailed scoring criteria and reasoning behind the scoring system are provided in Supplementary Table 15). In this article, the terms ‘model’ and ‘AI’ refer specifically to predictive models. When referring to generative AI, we specify LLM.
Hospital characteristics
Hospital characteristics were obtained from the 2023 AHA Annual Survey dataset to serve as proxy indicators of institutional resource levels. While the 2024 AHA Annual Survey was not yet available at the time of the analysis, hospital characteristics remain relatively stable over time and should have minimal impact on the results. We included organizational attributes such as children’s hospital designation, teaching hospital status, critical access hospital designation, rural referral centre status, ownership type, bed capacity, health system affiliation, frontline hospital designation, Joint Commission accreditation status, presence of subsidiary hospitals, community hospital designation and delivery system model. Detailed definitions and categorizations of these variables are provided in Supplementary Table 16. We additionally calculated the core index and friction index as developed by Strawley et al.14. The core index measures the adoption of foundational interoperability capabilities, with higher scores indicating greater interoperability. The friction index quantifies barriers to interoperability, with higher scores indicating greater barriers. We included these interoperability indices, calculated from AHA IT Supplement responses, as they efficiently summarize multiple dimensions of IT infrastructure and exchange capabilities that may influence a hospital’s readiness to implement AI systems.
Geographical and community characteristics
Rural–urban classification and hospital geographical coordinates were obtained from the AHA Annual Survey. Hospitals were linked to their service area, county, state, census division and census region using information from the same survey.
ADI26,27 and SVI28,29 were first aggregated to five-digit zip codes and then to the HSA using a zip code–HSA crosswalk from the Dartmouth Atlas30. We used median values for this aggregation because deprivation indices typically include numerous small areas with similar socioeconomic profiles within each service region, making the median more robust to outliers while representing the typical deprivation level.
HPSA and MUA scores were obtained from the Health Resources and Services Administration29. These designations represent geospatial boundaries, with scores reflecting the degree of healthcare shortage and underservice, respectively. We spatially joined these areas to hospital coordinates wherever they overlapped. For hospitals that intersect with multiple HPSAs or MUAs, often with substantially different scores, we calculated mean values to capture the combined influence of all shortage designations. Hospitals without overlapping HPSAs received a score of 0. Hospitals without overlapping MUAs were assigned a score of 100. For consistency with HPSAs, we used the inverted form of the MUA score (MUA inverted). We additionally collected county-level digital infrastructure metrics from 2023 US Census Bureau data31, including internet access percentage (households with any type of internet subscription), broadband percentage (households with high-speed internet subscription) and computing device percentage (households with at least one computing device such as a desktop, laptop, tablet or smartphone). These digital infrastructure variables were linked to hospitals based on their county location (Supplementary Table 16).
Hospital quality metrics
We obtained 70 continuous hospital quality-of-care metrics from the Centers for Medicare & Medicaid Services32. These standardized metrics assess clinical performance, care quality and patient safety across US hospitals. For our longitudinal analyses, we collected quarterly data from 2022 through the first three quarters of 2025, yielding 15 measurement time points.
AnalysisDescriptive statistics
We generated descriptive statistics comparing hospital and community characteristics across regions and AI implementation categories. Continuous variables are presented as means with s.d., while categorical variables are shown as frequencies and percentages. Statistical comparisons across groups were conducted using analysis of variance (ANOVA) for continuous variables and chi-square tests for categorical variables. ANOVA assumes normality within groups, homogeneity of variance and independence of observations; chi-square tests assume independence and adequate expected cell frequencies. We presumed that these assumptions were adequately met given the large sample size and the descriptive nature of the analysis. All statistical tests were two-sided with significance set at P < 0.05. Bonferroni correction was applied for multiple testing corrections. For the state-level analysis, states with fewer than 20 hospitals were excluded to avoid unreliable statistical estimates due to small sample sizes. This included Alaska, the District of Columbia, Delaware, Hawaii, Maine, Rhode Island, Vermont and Wyoming.
Community need and predictive AI implementation pattern analysis
We examined the patterns between predictive AI implementation and community need indicators through cross-tabulation analysis. This analysis was exploratory, examining the relationship between need and implementation based on our initial interest in geographical disparity patterns rather than testing a specific a priori hypothesis about where AI should be implemented. Given that AI implementation scores represented distinct and meaningful categories (no predictive models, non-AI predictive models, AI predictive models), we retained these original classifications to preserve interpretability.
For the need indicators, we evaluated whether each measure’s distribution allowed for interpretable tertile categorization. Need measures that created distinct tertiles with adequate variation across categories were divided into tertiles to enable systematic comparison across need levels. However, for need indicators where many areas had the same values, which prevented adequate differentiation, we instead used binary categorization.
We examined primary HPSA, dental HPSA, mental HPSA, and MUA overall, along with ADI, SVI overall, SVI theme 1, SVI theme 2, SVI theme 3 and SVI theme 4 as need indicators.
We analysed these indicators in two conceptually distinct groups: healthcare access need indicators (HPSA and MUA measures), which represent areas with insufficient healthcare infrastructure and workforce, and socioeconomic need indicators (ADI and SVI), which reflect community-level social and economic challenges. We do not assume that AI adoption will necessarily mitigate structural disparities or that higher AI adoption in high-need areas is inherently beneficial. These different types of needs may require different AI solutions and implementation approaches, and inadequate AI design or implementation could potentially worsen existing disparities rather than reduce them.
It should be noted that AI implementation requires substantial technical, financial and human resources, as well as institutional expertise in data governance, integration and workflow adaptation. These observed patterns may reflect early-stage adoption constraints or differences in institutional capacity rather than indicating areas where AI should necessarily be prioritized.
Spatial clustering and hotspot analysis
Geographical visualization and distribution
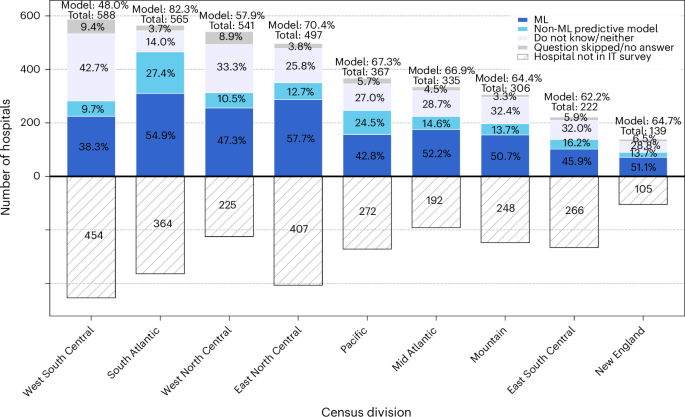
We visualized the geographical distribution of AI implementation through heatmaps across the US and within individual census divisions. It should be noted that areas with higher hospital density may naturally show greater concentrations of AI implementation. Census divisions are categorized into nine regional groups (New England, Middle Atlantic, East North Central, West North Central, South Atlantic, East South Central, West South Central, Mountain and Pacific).
Spatial clustering analysis
We first assessed the spatial clustering of hospitals using a nearest neighbour analysis based on hospital coordinates, calculating the average nearest neighbour distance with a KDTree algorithm. To examine the clustering of AI implementation, we calculated global Moran’s I using projected hospital coordinates and AI implementation scores. We defined spatial relationships using the six nearest neighbours (k = 6), which allowed the detection of localized spatial clustering while maintaining statistically significant Moran’s I and z-score values (Supplementary Fig. 1). The spatial clustering effect size was measured using Moran’s I, ranging from −1 (indicating perfect spatial dispersion or a checkerboard pattern) to +1 (indicating perfect spatial clustering). This test assumes that observations are conditionally independent given the spatial structure, which is a reasonable assumption at the national level. Census division- and state-level analyses were also conducted to account for potential variations in local dependencies and policy environments. Given prior evidence of clustering in hospital technology adoption, we conducted these tests to validate and localize spatial patterns at multiple geographical levels. We report both unadjusted and adjusted P values corrected for multiple comparisons using the BH FDR procedure and Storey’s q-value method. Parallel analyses were also conducted for secondary model implementation measures and the LLM readiness score.
We applied DBSCAN clustering to identify geographically proximate hospitals with similar AI implementation patterns. These clusters serve as practical units for stakeholders to target interventions and develop region-specific approaches to AI implementation. DBSCAN assumes that meaningful clusters can be detected based on local point density and that standardized features (coordinates and AI scores) reflect relevant similarity. To address the uneven geographical distribution of hospitals, we computed local density estimates for each hospital using its k = 6 nearest neighbours. We then upweighted AI implementation scores in higher-density regions to enhance cluster detection while preserving DBSCAN’s density-based logic. All features were standardized before clustering. We selected the eps (ε) parameter (0.35) based on the inflection point where the number of clusters stabilized and the proportion of noise remained acceptably low (Supplementary Fig. 2). As DBSCAN is a nonparametric clustering algorithm that does not produce P values, no multiple testing correction was applied. For the state-level analysis, states with fewer than 20 hospitals were excluded to avoid unreliable statistical estimates due to small sample sizes. We note that DBSCAN may underdetect patterns in low-density rural regions. Parallel analyses were also conducted for secondary model implementation measures and the LLM readiness score.
Hotspot analysis
We complemented the clustering analysis with a Getis–Ord Gi* hotspot analysis to identify statistically significant spatial concentrations of high and low AI implementation. Hotspots can guide policymakers towards successful regional examples, while coldspots highlight areas that need targeted support and resources. Using projected hospital coordinates and AI implementation scores, we computed Gi* z scores based on each hospital’s six nearest neighbours, consistent with our DBSCAN parameter. This analysis assumes that nearby hospitals may influence each other and that any remaining differences are independent once geography is accounted for. It also assumes that the AI scores are reasonably distributed for identifying unusual clusters. Hotspot (high implementation) and coldspot (low implementation) classifications were assigned based on z-score significance thresholds (90%, 95%, 99%). We report both unadjusted and adjusted P values corrected for multiple comparisons using the BH FDR and Storey’s q-value method. For visualization purposes, we aggregated these classifications to the HSA level. For descriptive statistics, we further aggregated counts to the state, census division and national levels. For the state-level analysis, states with fewer than 20 hospitals were excluded to avoid unreliable statistical estimates due to small sample sizes. Parallel analyses were also conducted for secondary model (non-AI and AI) implementation measures and the LLM readiness score.
Predictive modelling and feature importance analysis
We used a random forest regression model to identify the most influential factors predicting hospital predictive AI implementation levels. Missing values were imputed using MICE (multiple imputation by chained equations) to account for systematic missingness patterns and to preserve correlations between variables. The model used 100 trees with fivefold cross-validation and incorporated both hospital-level characteristics and geospatial features as predictors. Model performance was assessed using R2 calculated as the proportion of variance explained through fivefold cross-validation. We calculated SHAP values to determine feature importance and to understand the directional relationships between predictors and AI implementation. SHAP values quantify each feature’s contribution to individual predictions while accounting for feature interactions33.
GWR analysis
We implemented a GWR analysis to visualize how the associations between hospital predictive AI implementation scores and structural, socioeconomic and technological factors vary across geographical space. Hospital coordinates were used to compute spatial weights based on Gaussian kernels. All continuous variables were standardized before analysis to allow for coefficient comparability. We used a bandwidth of two decimal degrees, calculated as approximately a 222-km radius at mid-US latitudes34. This bandwidth encompasses multiple counties or most smaller states, providing a good balance for capturing meaningful regional patterns while ensuring sufficient local observations for stable coefficient estimation. The resulting spatially varying coefficients were mapped to assess regional heterogeneity. These results were interpreted descriptively to illustrate potential geographical variation rather than as formal statistical inference.
Exploratory longitudinal analysis of hospital quality trends by predictive AI implementation status
We conducted exploratory longitudinal analyses to examine the associations between AI adoption status and the trajectories of hospital quality metrics. Given the early stage of adoption and the potential confounding by institutional readiness, these analyses are considered hypothesis generating. Detailed modelling specifications, covariates and sensitivity analyses are provided in the Supplementary Note.
Reporting summary
Further information on research design is available in the Nature Portfolio Reporting Summary linked to this article.