
Comment: Residential construction punches above its weight when it comes to influencing NZ’s economic cycle.
The sector’s direct contribution to economic activity, at 6-7 percent of GDP, may not be massive. But it’s a large employer (8-10 percent of jobs) and has strong cyclical ties to other parts of the economy like manufacturing, forestry, durables consumption, and logistics.
It’s consequently a sector we’re watching closely as NZ’s economic worm starts to turn. If construction struggles to get going it won’t necessarily prevent a broader recovery, but it will slow things down.
Bumping along the bottom
Construction featured as one of the (many) weak spots in Thursday’s -0.9 percent q/q decline in second quarter GDP. That just continues the trend. The 1.9 percent fall in the volume of residential building work was the seventh decline in the past eight quarters.
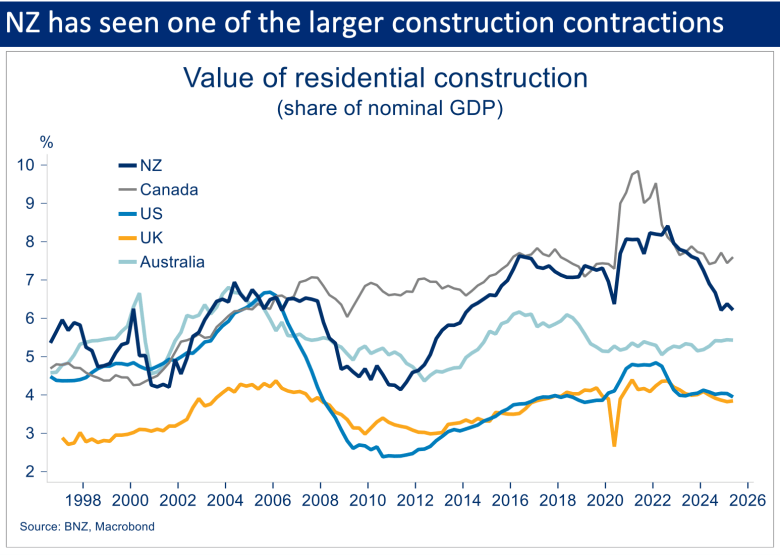
The chart shows that residential construction’s been a declining part of many developed economies in the wake of Covid-era booms. NZ has been no different. However, NZ’s 23 percent correction from 2022 levels stands out as one of the larger ones, even if it started from a relatively high base.
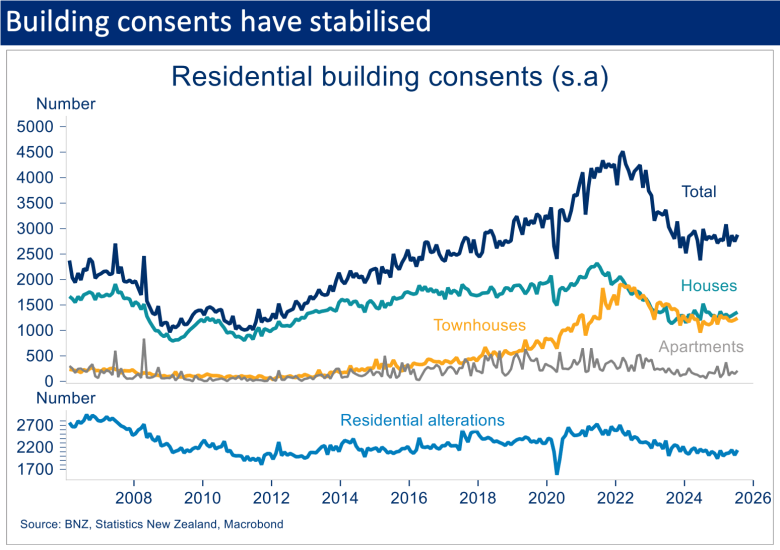
Building consent numbers suggest we’re broadly at the bottom of the cycle. Consenting activity for standalone houses stopped trending lower about 18 months ago. More recently we’ve seen the stabilising trend extend to townhouses and renovations to existing dwellings.
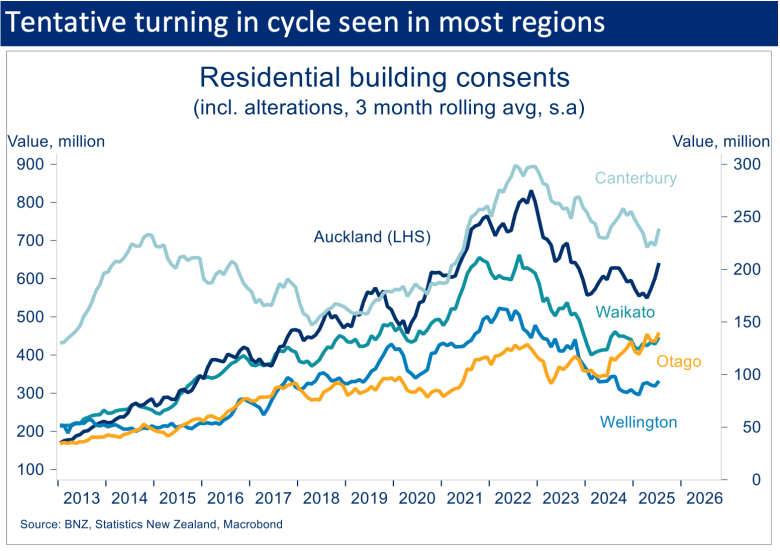
This tentative turning of the trend has also been seen in most regions around the country, boosting the odds it’s sustained. Once again though, Otago (read: Central Otago and Queenstown-Lakes) warrants special mention to the extent construction there never slowed much to begin with. The value of consents in Otago is now 9 percent above the previous peak in 2022.

Start your day informed. Make room for newsroom’s top stories. Direct to your inbox daily.
Some commentators are making the point that, even after the big downturn, building activity is stabilising at a relatively high level compared to history.
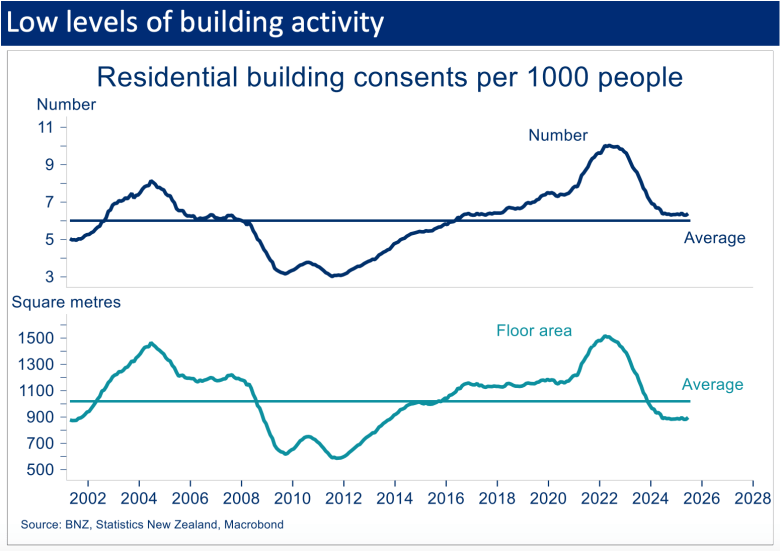
That’s true, but isn’t the whole story. The 34,000 residential consents issued in the past 12 months is a little above the long-run per capita average (chart below). It’s also more in line with 35,000-40,000 industry estimates of the number of dwellings the sector can sustainably deliver in a year (as opposed to the 50,000 issued at the peak in 2022).
But looking at the number of consents may be overstating things a little. That’s because townhouses now account for a much higher share of building consents now (43 percent) compared to just five years ago (20-25 percent). The average town house build is smaller (around 110 square metres) and so generally doesn’t house as many people as the average standalone house (average of 178 square metres).
Looking at total consented floor area (per-capita) provides a different angle on current levels of building activity. The picture is noticeably weaker relative to history with current consenting activity 12 percent below the long-term average.
Whichever measure you look at, the lower levels of activity have clearly taken a harsh toll, with the construction sector overrepresented in job loss and company wind-up statistics through the recession. This loss of capacity in the sector also raises the question of how much activity can lift in future without putting undue pressure on costs.
Checking in on the fundamentals
Construction is highly cyclical. So, with the downturn increasingly in the rear-view, attention has turned to the shape of any recovery.
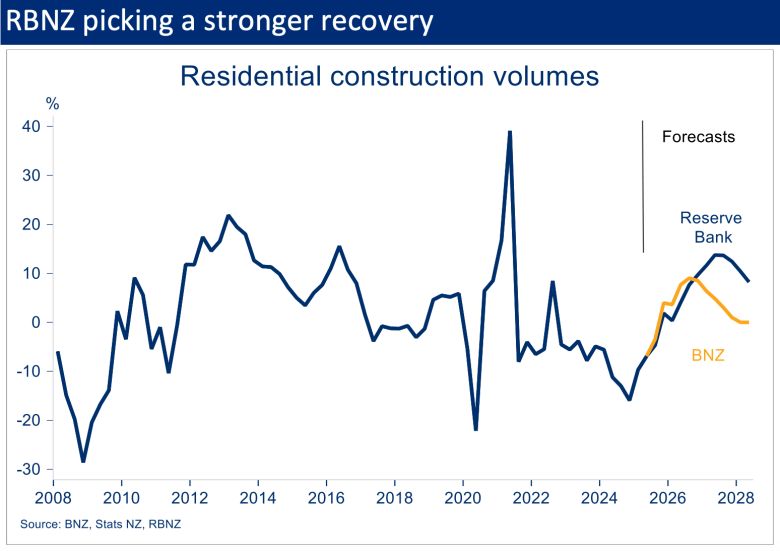
We’ve long assumed residential building activity would start to lift from the final quarter of this year. The Reserve Bank last month pushed back and lowered its own expectations, but still assumes a stronger recovery than us.
Our sense is that even our more cautious view risks being a tad optimistic, at least on the timing. Three key macro fundamentals are currently influencing the sector.
1. Funding cost and availability
Funding considerations for the residential building sector have moved in a favourable direction over the past 12 months. Our expectation is that this trend has further to run.
The Official Cash Rate has been cut 250bps in a year. What’s more, some wholesale and retail borrowing rates, like those for a 12-month term, have fallen by more than this as additional easing is anticipated. We expect two further 25bps cash rate cuts, taking the OCR to a 2.50 percent cycle low.
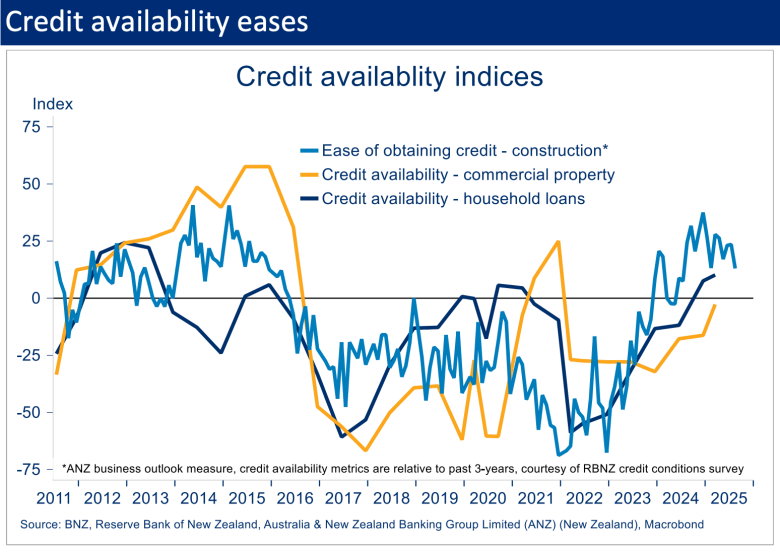
It’s also not just the cost of credit that has moved in a helpful direction. Indicators of credit availability to the sector have also eased up over the past year or so.
2. Relative costs
One of the sector’s largest challenges has been a surge in costs. Not just in an absolute sense, but also relative to the price of existing homes.
Our previous attempts at quantifying the build vs buy cost gap put it at record levels (see here and here). To the extent that’s broadly representative, it suggests acute margin pressure for construction operators. It also helps explain reduced demand for new builds given the macro financial incentives lean more towards buying existing dwellings.
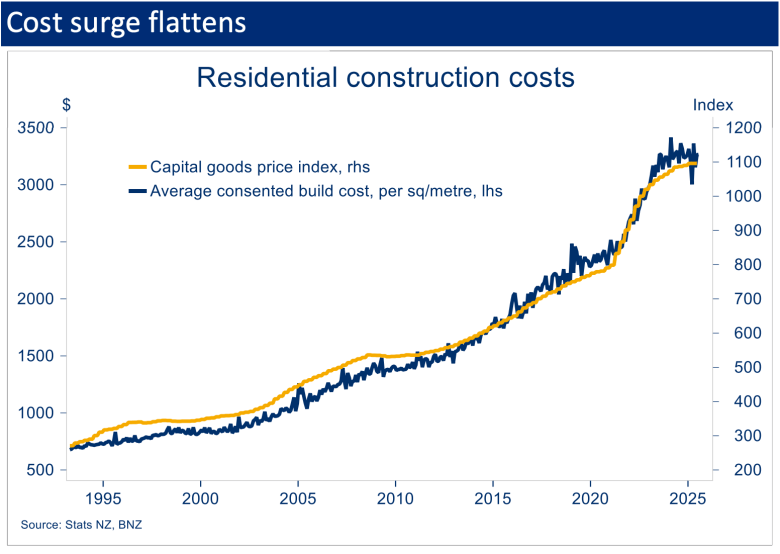
The explosion in construction costs has now flattened off, but they’re still left 35-40 percent higher than 2021 levels. At the same time, median house prices have generally undershot expectations in flat-lining for the past two years. The ratio of the two – a rough ‘incentive to build’ proxy – thus continues to bobble around levels consistent with flattish construction activity (see chart).
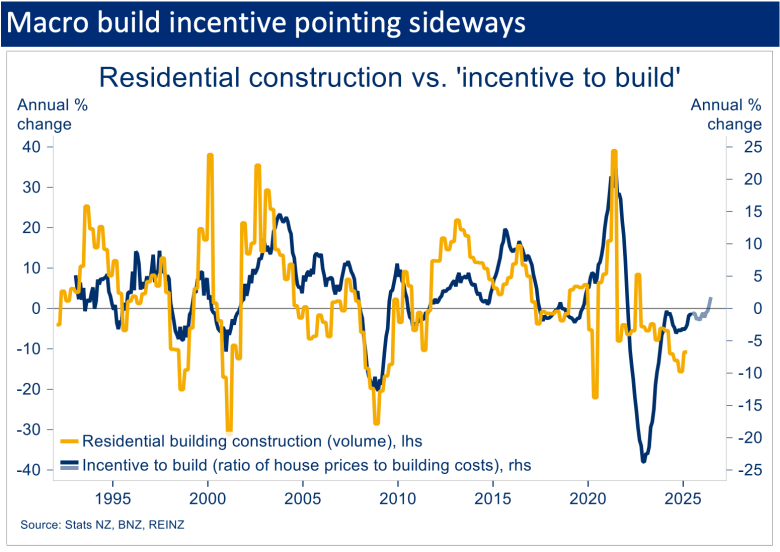
To be consistent with some lift, we’d need to see some combination of house prices rising or building costs declining. Our forecasts are consistent with a little of both but, as shown in the forecast, not enough to move the dial much before mid-2026.
Subdued demand and Government initiatives targeting housing supply and building costs should help suppress construction costs. The bigger swing factor though is house prices, which we see rising about 4 percent through next year after a largely flat 2025 (latest here).
3. Demand vs supply
For about 12 months now, growth in the population has undershot growth in the dwelling stock. The latter is running close to the long-run average, while population growth is not, entirely reflecting the collapse in migration to an annual net inflow of just 13,000 people (year to July).
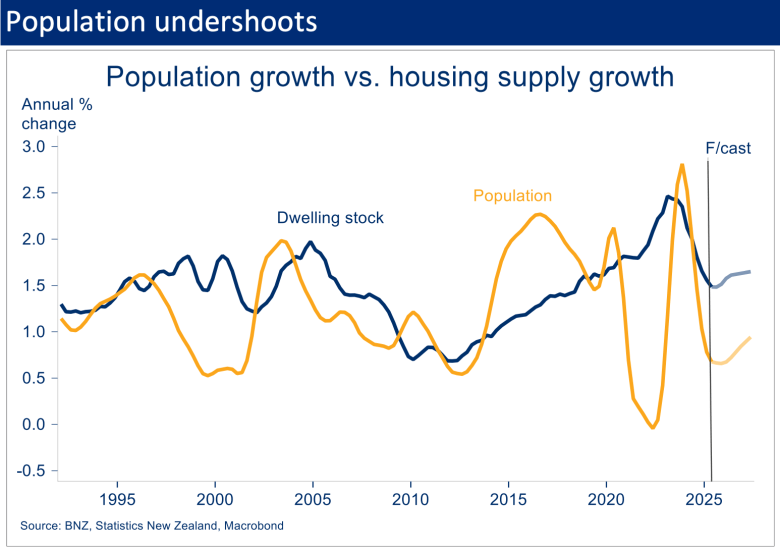
Our forecasts assume a lift towards a 30,000 net migration inflow next year. That would see population growth recover, but a gap to growth in the dwelling stock maintained.
Importantly, this doesn’t mean the market is or will become oversupplied. What it implies is that we’re building strongly relative to the current population expansion. If the starting point is one in which we are short of houses, these run-rates mean pressure on housing resources is being reduced, at the margin. The point is that the macro incentive to build is lower than otherwise.
Note also that the forecasts for dwelling stock growth in the chart may overstate the case because – as noted earlier – growth in dwelling numbers are now more tilted towards townhouses than in the past. You probably need more of those to house a given amount of population growth.
All this said, evidence of marginal supply growth outpacing that of demand is on show currently in the housing and rental markets. New tenancy rents are falling at around a 2 percent annual pace and house prices have resumed small declines over the past three months.
Pulling it together
In sum then, the downturn in residential construction appears to have run its course. But there’s significant uncertainty about the timing of any upturn. That’s thanks to the sector’s strong links to two of the more unpredictable elements of the economy – migration and houses prices. We expect some lift in both over the coming 12 months, but at very modest rates.
Our overall read of the key macro fundamentals doesn’t invalidate our forecasts for a modest recovery in residential construction activity from around the turn of the year. But it does provide a sense of the risks being to the southside of this forecast. In the least, construction looks set to lag the broader recovery. And absent any pick-up in migration or house prices, there’s a risk activity could stay flattish for a good portion of 2026.
Disclaimer: This publication has been produced by Bank of New Zealand (BNZ). This publication accurately reflects the personal views of the author about the subject matters discussed, and is based upon sources reasonably believed to be reliable and accurate. The views of the author do not necessarily reflect the views of BNZ. No part of the compensation of the author was, is, or will be, directly or indirectly, related to any specific recommendations or views expressed. The information in this publication is solely for information purposes and is not intended to be financial advice. If you need help, please contact BNZ or your financial adviser. Any statements as to past performance do not represent future performance, and no statements as to future matters are guaranteed to be accurate or reliable. To the maximum extent permissible by law, neither BNZ nor any person involved in this publication accepts any liability for any loss or damage whatsoever which may directly or indirectly result from any, opinion, information, representation or omission, whether negligent or otherwise, contained in this publication.