
Researchers have found that NASA’s PACE satellite can now detect nitrogen dioxide pollution at a fine enough scale to isolate emissions from individual factories and highway corridors.
That new level of detail turns broad atmospheric haze into traceable sources, reshaping how pollution can be identified, managed, and reduced.
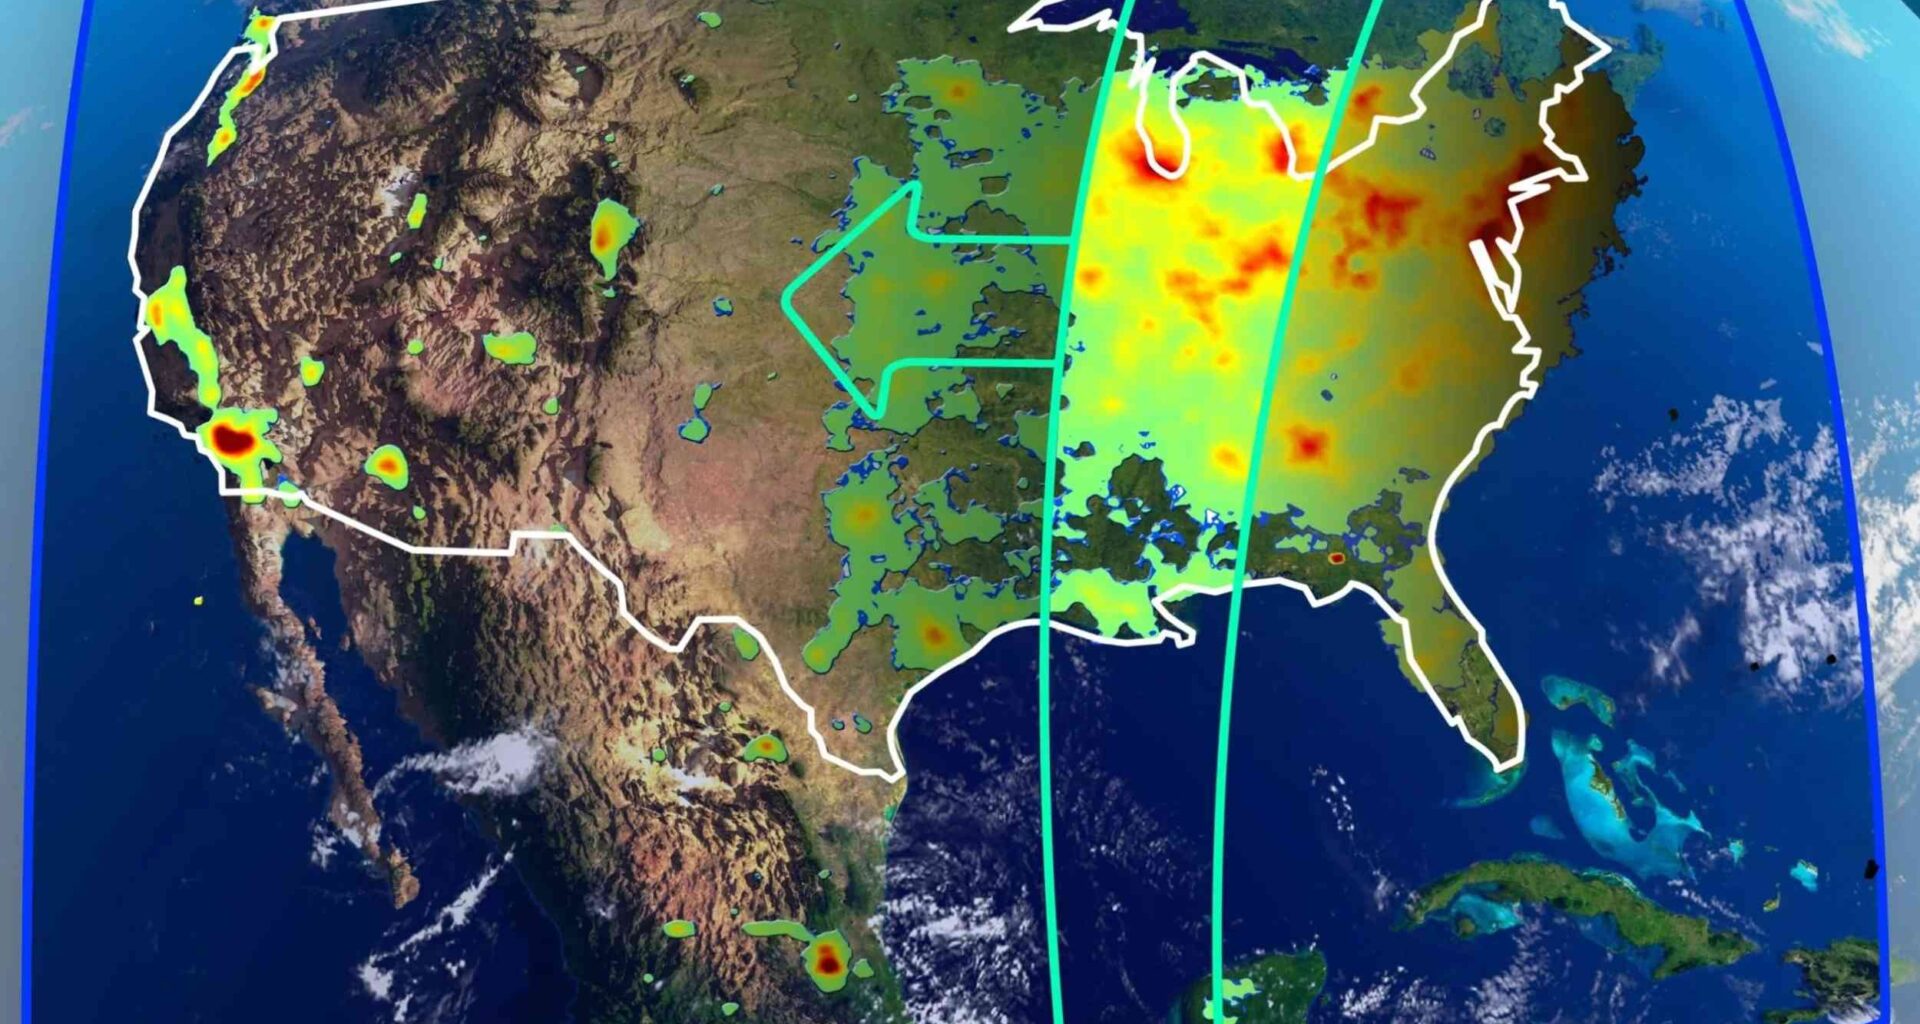
What the maps show

Across Los Angeles and other monitored regions, the satellite’s new maps separate nitrogen dioxide into distinct plumes that were previously blended together.
Working from these observations, Zachary Fasnacht at NASA Goddard Space Flight Center demonstrated that PACE can distinguish nearby emission sources rather than merging them into a single signal.
In those same scenes, each measurement pixel captures a much smaller area, allowing individual pollution streams to stand apart with greater clarity.
Even with that precision, the system still depends on favorable viewing conditions, setting clear limits on where and when the sharpest detail can be achieved.
How PACE learned
PACE’s Ocean Color Instrument (OCI) was built to watch oceans, clouds, and aerosols, not to chase roadside exhaust.
Before launch, one study showed that OCI retained enough light-pattern detail for software to recover nitrogen dioxide.
To turn that possibility into a product, researchers used machine learning – software that learns patterns from examples – trained against TROPOMI, a European satellite instrument that measures air pollutants from space.
Because TROPOMI already provides well-tested nitrogen dioxide readings across large regions, it supplied the reference values that allowed PACE to learn the gas at finer scale.
Why sharper pixels
When maps get sharper, a city block no longer looks like the whole city, and one plant no longer hides another.
Officials can trace highway corridors, ports, and industrial sites more directly because the gas signature stays tied to smaller areas.
This improves health research, since people breathe air near specific roads and smokestacks, not countywide averages.
“These data can potentially enable emissions estimates with reduced uncertainties and higher spatial resolution,” wrote Fasnacht.
What the gas does
Burning fuel and wood releases nitrogen dioxide, a reactive gas made during combustion, so tailpipes, power plants, and fires leave the same mark.
In sunlight, it helps build ground-level ozone, smog near the surface that irritates lungs and stresses crops.
Because that chemistry unfolds downwind, seeing where nitrogen dioxide starts gives forecasters a stronger clue about where ozone may rise.
The new product does not replace ground monitors, but it adds the broad view that street stations cannot supply.
Testing satellite accuracy
To check the maps, the team compared satellite readings with a ground network that measures nitrogen dioxide directly from sunlight.
Those tests showed PACE and TROPOMI behaving similarly, with both tending to read about ten percent to 20 percent low.
At roughly a mile across, PACE could be checked against local conditions more precisely than the broader TROPOMI footprints.
Validation is still continuing, so the strongest claims today concern clear skies and places with stronger signals.
Data now open
NASA has already posted the new trace-gas dataset on Earthdata, with coverage beginning March 5, 2024.
Along with nitrogen dioxide, the release includes ozone columns and quality flags that mark clouds, weak geometry, and poor radiance data.
Those warnings matter because bad viewing angles or leftover cloud can make a sharp-looking map misleading.
Easy public access means cities, health researchers, and air agencies can test uses quickly instead of waiting years.
Limits over water
Water remains harder than land because changing surface reflections can mimic or mask the gas signal in the light.
In the official document, researchers caution that ocean scenes work best when nitrogen dioxide signals are strong.
Near the equator, instrument tilt changes can create odd features, and very slanted views over water raise errors further.
Those caveats do not erase the advance, but they show exactly where the next software releases must improve.
PACE with TEMPO
PACE does not work alone, because NASA’s TEMPO mission watches North America through every daylight hour.
Where PACE sharpens the picture once a day, TEMPO tracks how plumes move, spread, and change direction over time.
Using both together lets agencies see both the source pattern and the hourly drift that carries pollution into neighborhoods.
That combination could make satellite air data more useful for same-day decisions during rush-hour and industrial pollution events.
The second payoff
The pollution product may also help the rest of PACE’s science, even though the mission was not built for this job.
Nitrogen dioxide and ozone both absorb light, so measuring them directly can improve the cleanup applied before ocean color analysis.
That matters near coasts and cities, where polluted air can distort how satellites interpret surface reflections.
A mission launched for plankton and aerosols has therefore gained a second life as an air-quality tool.
What comes next for PACE
PACE has turned from an ocean-and-aerosol mission into a sharper pollution mapper that shows where dirty air begins and moves.
As validation expands and water algorithms improve, the satellite could become far more useful for daily health, planning, and emissions work.
The study is published in NASA Earthdata.
—–
Like what you read? Subscribe to our newsletter for engaging articles, exclusive content, and the latest updates.
Check us out on EarthSnap, a free app brought to you by Eric Ralls and Earth.com.
—–