
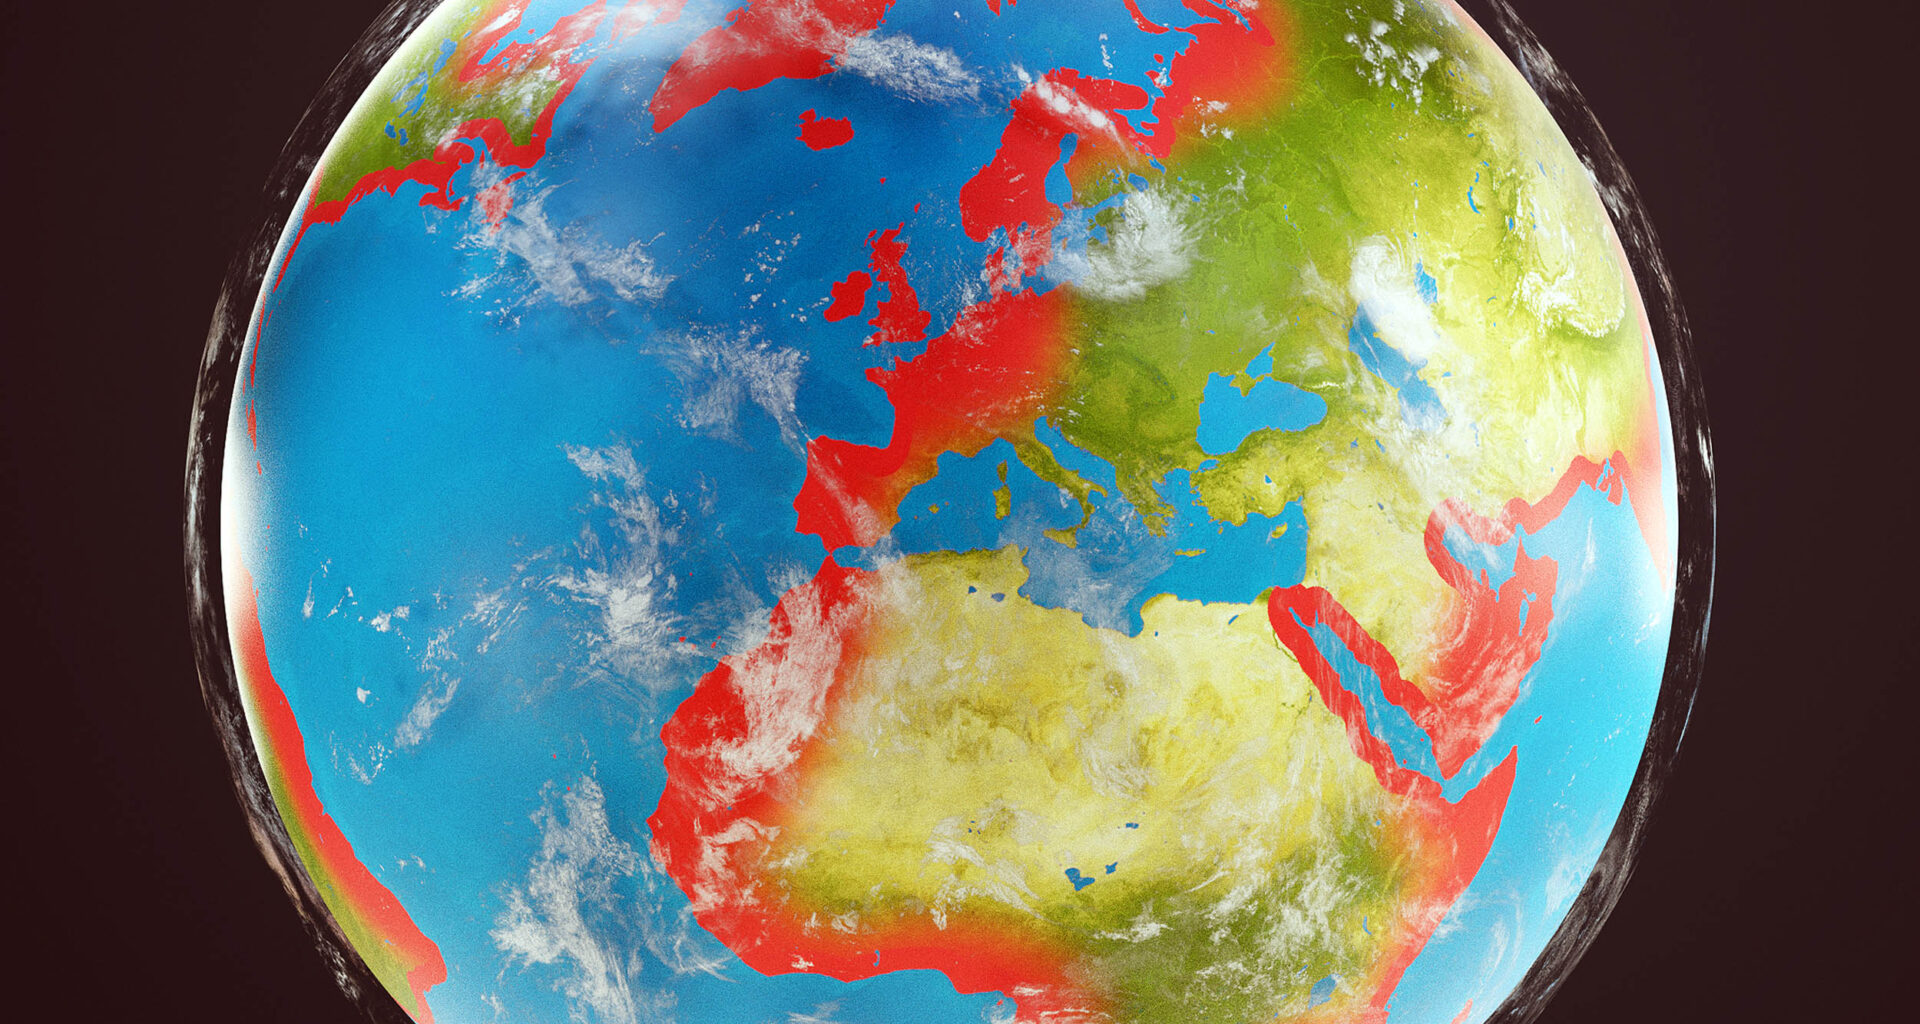
Many of the world’s coastal risk maps begin with a simple assumption: the ocean starts at zero. But new research suggests that this baseline may already be wrong.
Scientists analyzing hundreds of coastal hazard studies discovered that many maps underestimate how high the ocean already sits along shorelines. In many places, the water level used to build those maps was already set too low.

That hidden miscalculation means far more land – and millions more people – may already lie closer to present-day sea level than widely assumed.
Wrong starting point for seas
Across 385 published coastal hazard assessments, the same misplaced baseline quietly shaped maps used to judge risk along vulnerable shorelines.
Examining those papers, researchers at the University of Padova documented that most relied on an assumed global sea-level reference rather than measured local water levels.
Measured coastal waters consistently stood higher than that assumed baseline, leaving many assessments to begin from an ocean level set too low.
Recognizing that starting error changes how scientists estimate which places and populations sit closest to the rising sea.
Mapping gaps across coastlines
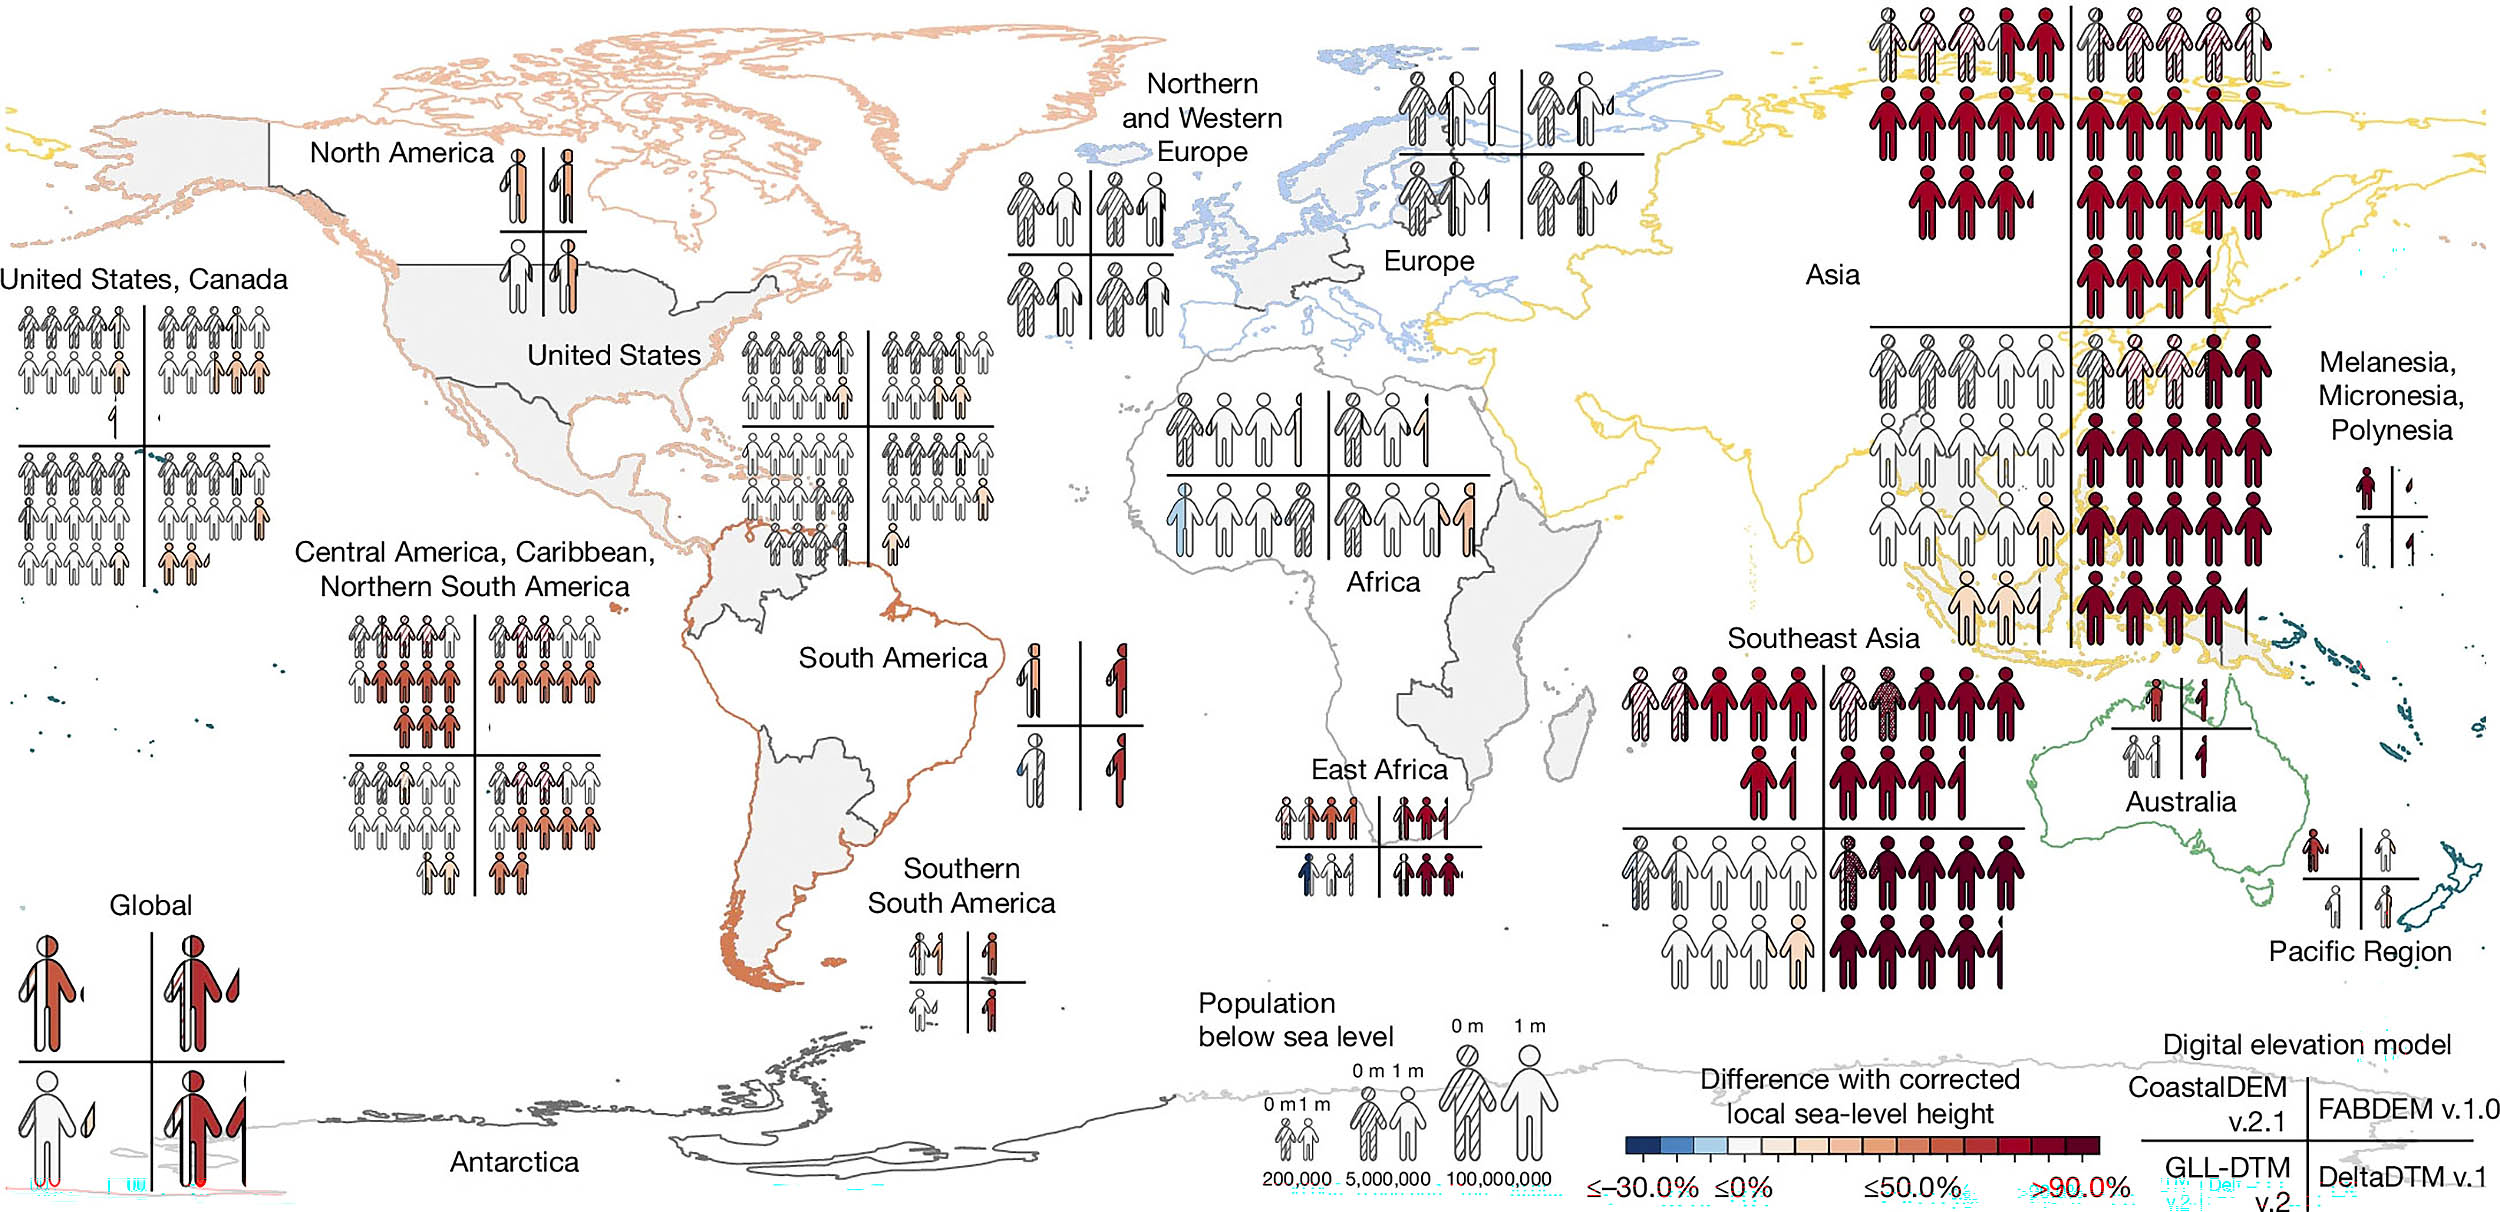
Outside Europe and much of the Atlantic coast, the gap between assumed and measured sea level often widened quickly.
Across Southeast Asia and many Pacific islands, corrected coastal elevations sat more than three feet lower than older maps suggested.
Eastern North America and western Europe showed closer agreement, largely because those regions have denser measurements and longer observational records.
Behind that regional pattern lies a simple data problem. Geoid models perform best where gravity measurements are already dense, and wealthier coastlines in North America and Europe have supplied those measurements for decades.
Large parts of Asia, Africa, Latin America, and the Pacific received rougher baselines, even though many of those regions have large populations living near the water.
The result placed the largest scientific blind spots over crowded coasts that could least afford them.
How map sea-level errors spread
Much of the problem begins with how scientists represent the ocean’s surface. Many coastal studies rely on a smooth global reference surface known as a geoid.
The geoid is a gravity-based estimate of sea level, but real coastlines rarely match that tidy surface. Currents, winds, tides, temperature, and salt content all shift local water levels.
When maps ignore those forces, they adopt a neat global zero point that nature rarely follows.
Once that shortcut entered the literature, later studies often repeated it. Many papers failed to clearly document their sea-level baseline, allowing the assumption to spread through new research.
Among the 385 papers examined, more than 99 percent handled sea level and land elevation inadequately. About 90 percent never used measured sea level at all, while only about one percent aligned coastal elevations correctly.
An error this widespread might have been expected to surface during peer review, yet the study shows it continued propagating through later studies.
Coastal exposure rises sharply
Correcting the starting point changed the global picture of coastal exposure. When researchers aligned land elevation with measured sea level and added about 3.3 feet of projected rise, the amount of land falling below sea level grew by 31 percent to 37 percent instead of increasing only slightly.
Population exposure rose even faster. Between 77 million and 132 million people could live below sea level under those corrected assumptions, an increase of 48 percent to 68 percent.
These figures do not predict which streets will flood first, but they reset the scale of how much land already sits near danger.
Evidence of the mismatch had surfaced earlier in the Mekong Delta. A 2019 study found the delta averaged only about 2.6 feet above sea level rather than the roughly 8.5 feet suggested by earlier maps.
What once looked like a regional anomaly now appears more like a warning for deltas worldwide.
 Difference in population falling below sea level following 1 m RSLR between the commonly assumed and measured sea-level height. Credit: Nature Briefing. Click image to enlarge.What planners miss
For city officials, engineers, and insurers, the findings shift the starting line for coastal planning. Seawalls, evacuation routes, infrastructure, and climate adaptation budgets often rely on hazard maps derived from earlier studies.
If those maps began from water levels set too low, some communities may have less time to prepare than expected.
Several of the screened studies also informed major climate assessments, meaning the baseline error could ripple into policy discussions.
By 2100, global projections suggest average sea-level rise could reach roughly 11 inches to 3.3 feet.
If today’s ocean already sits higher than assumed in many places, those future increases shorten the window available for adaptation.
A new sea-level mapping baseline
Rather than leave research groups juggling mismatched zero points, the authors released corrected coastal elevation datasets.
These files combine land height with measured sea surface, allowing future hazard maps to begin from a consistent baseline instead of simplified assumptions.
Better reporting would allow scientists to spend less time correcting past assumptions and more time focusing on realistic coastal projections.
Clearer standards for sea-level studies
The paper also calls for clearer reporting standards. Many flawed studies barely described their reference level, making comparisons difficult and errors harder to detect.
Stronger requirements from peer reviewers and journals could ensure future research clearly defines its sea-level baseline.
Sea-level risk did not suddenly appear this week, but the analysis shows many maps started from water levels already set too low.
Rechecking older assessments – particularly in densely populated deltas and low-lying island nations – may be essential for understanding the true scale of future coastal risk.
The study is published in the journal Nature.
—–
Like what you read? Subscribe to our newsletter for engaging articles, exclusive content, and the latest updates.
Check us out on EarthSnap, a free app brought to you by Eric Ralls and Earth.com.
—–