
About $200 billion annually since 2007, according to a new Energy Institute working paper.
The war in Iran has pushed up natural gas prices in most of the world. Liquefied natural gas (LNG) prices nearly doubled in the first half of March, and attacks on LNG infrastructure in Qatar and elsewhere squeezed prices even further.
U.S. natural gas prices, meanwhile, have barely budged. U.S. LNG export facilities were already running at near 100% capacity factor, so there is little scope in the short-run to increase exports. Consequently, U.S. natural gas prices have remained at about $3 per Mcf, about 1/6th of the price in Europe and Japan.
This is not the first time this has happened. Market data show that U.S. natural gas prices have been consistently well below natural gas prices elsewhere in the world for the last 20 years. Why? Shale gas.
In a new Energy Institute working paper, I calculate how much shale gas has saved U.S. natural gas consumers since 2007. The paper was heavily influenced by an insightful paper published in 2015 by Catherine Hausman and Ryan Kellogg on the economic benefits of shale gas, but takes a different approach focused on LNG prices.
Shale Gas Revolution
It may seem like a distant memory now, but back in the mid 2000s, U.S. natural gas production had been flat for a decade, and the U.S was importing LNG – not exporting it – and with plans to import much more. As of February 2007, there were four additional U.S. LNG import terminals under construction and another 10 U.S. LNG import terminals had received approval from FERC.
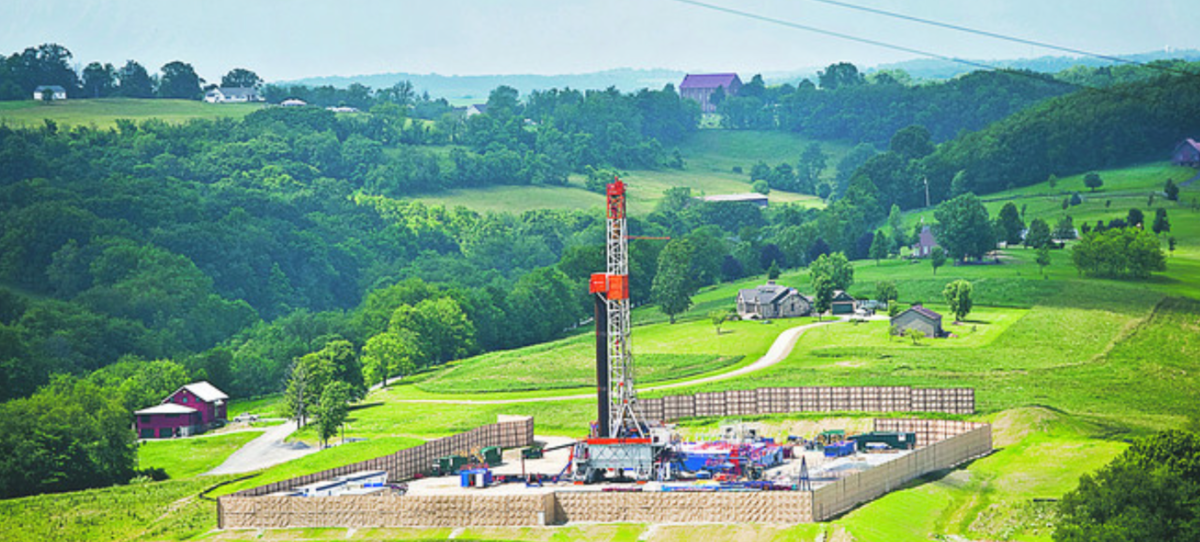
Then shale gas happened. Advances in hydraulic fracturing and horizontal drilling opened up vast new areas to development and super-sized U.S. natural gas production. Since Daniel Yergin and Robert Ineson wrote about “America’s Natural Gas Revolution” in the Wall Street Journal in 2009, U.S. natural gas production has approximately doubled, driven overwhelmingly by shale gas.

Along the way, the United States went from being a net importer of natural gas to the world’s largest exporter, with 9 billion Mcf of exports last year.
Price Divergence
Shale gas has dramatically reduced U.S. natural gas prices relative to what they would have been without this innovation. The figure below plots natural gas prices for the U.S., Europe, and Japan.

Before shale gas, prices followed each other reasonably closely. Between 1995 and 2006, prices for Europe and Japan were both within $1 per Mcf of the U.S. price, on average.
Then prices diverged sharply. Every single month between 2007 and 2025, the U.S. price was below or equal to the price in Europe and Japan. Relative to Europe, U.S. prices have been $9 lower per Mcf on average. Relative to Japan, U.S. prices have been $11 lower.

Shale gas is the single best explanation for the persistent price differences since 2007. The timing of the divergence closely corresponds with the growth of shale gas, with price differences appearing right at the inflection point for U.S. oil production. The prices also reflect other demand and supply shocks. For example, the large spike in European natural gas prices in 2022 reflects the Russian invasion of Ukraine.
Why Don’t Prices Equalize?
Prices do not equalize across continents due to transportation constraints. Natural gas takes up a lot of space, so must be transported by pipeline or cooled to -162°C to liquefy it for ship transport. Several U.S. LNG export facilities came online starting in 2016, but that was not enough to equate natural gas prices between the U.S. and the rest of the world, despite operating continuously at near 100% utilization.
More U.S. LNG export facilities are coming. U.S. exporters have announced 13.9 billion cubic feet per day of additional capacity that would be added by 2029, nearly doubling U.S. LNG export capacity. Increased U.S. LNG exports will put downward pressure on prices in Europe and Japan, and upward pressure on U.S. prices.

Large Savings
In the meantime, U.S. natural gas consumers have benefited mightily from cheap U.S. shale gas. According to the calculations in the paper, shale gas has saved U.S. natural gas consumers $4.5-$5.3 trillion since 2007, equivalent to savings of $237-$276 billion annually.

These savings were calculated by multiplying the observed price difference (in $ per Mcf) by U.S. natural gas consumption (in Mcf). For example, in 2025 the price difference between the U.S. and Europe was $9 per Mcf and total gas consumption was 30 billion Mcf, so the implied savings are $270 billion. This assumes that demand for natural gas is perfectly inelastic, i.e., that U.S consumers would have used the same amount of natural gas at higher prices. Incorporating a -0.5 demand elasticity (following previous research), the calculated savings are 31% smaller, $164-$189 billion annually.
The underlying assumption in these calculations is that without shale gas, the U.S. would have been importing LNG and thus paying the prices observed in Europe or Japan, respectively. This does not require any specific assumption about the counterfactual path for U.S. gas production, but it does assume sufficient scarcity of natural gas that the marginal unit would have been supplied by LNG in all years.
This is a strong assumption. U.S. LNG imports were growing prior to shale gas but still a tiny share of the market. It is certainly possible that, without shale gas, weak U.S. supply and strong U.S. demand would have led to sharply increasing U.S. LNG imports. But the opposite is also possible. Conventional U.S. natural gas production could have increased or U.S. demand could have decreased, making LNG imports unnecessary, in which case the estimates from previous papers (here and here) are more appropriate.
Who Benefited?
The paper finds that 39% of savings went to electric power customers, with the other 61% going to end-use gas consumption by industrial, residential, and commercial customers. In terms of geography, Texas has saved more than any other state and Louisiana has saved the most per capita.

The calculations in the paper completely ignore environmental costs and benefits. A comprehensive analysis of the broader welfare impacts of shale gas would incorporate the direct effects of increased U.S. natural gas production (e.g. groundwater contamination and methane leaks), indirect effects from gas displacing other forms of energy, as well as longer-run impacts on clean energy innovation and the “fossil-fuel trap”. A recent paper looks at the environmental effect of increased U.S. LNG exports, but more research is needed.
Conclusion
Shale gas was initially hailed as a “revolution”, yet by 2026, we almost take for granted the vast amounts of natural gas production made possible by advances in hydraulic fracturing and related technologies. As with many innovations, nobody was talking about it, then everyone was talking about it, and then it became commonplace.
These savings have been widely enjoyed. If you heat your home with natural gas and use a lot of electricity, plastic and fertilizer then you have benefited more than average. However, because natural gas is an important input into so many production processes, it is not an exaggeration to say that every single person in the U.S. has enjoyed lower prices because of shale gas.
Follow us on Bluesky, LinkedIn, and our new Instagram. Also subscribe to our email list to keep up with future content and announcements.
Suggested citation: Davis, Lucas. “How Much Has Shale Gas Saved U.S. Consumers?” Energy Institute Blog, May 11, 2026. https://energyathaas.wordpress.com/2026/05/11/how-much-has-shale-gas-saved-u-s-consumers/