
I know it’s not technically the halfway point of the season, which exists mid round for a 27 round schedule. Two teams have played half of their season (12 games) some 11 and some 10.
Somehow the Cowboys and Storm have not had a bye while the Roosters, Tigers and Sharks have had two. How good is that AI draw?The sixth place Cowboys have more wins than the teams in 3rd, 4th or 5th. An 18th team will fix things in 2027 but we’re likely back to this situation again in 2028.
We are at 45% of games played though , so it is somewhat mid-season, and a perfectly fine time to look at the mid season advanced stat leaders as I do every season.
Before that, with the resignation of NRL CEO Andrew Abdo this morning, as Liam did when Ben Ikin resigned as QRL CEO, I’d like to put forward my application as the perfect candidate to replace him.
I don’t have experience at a CEO level, but I do have two decades in data analytics and six years running the Eye Test. However, my platform of “no more set restarts” should garner significant support among the games wider audience. Please email me at leagueeyetest@gmail.com to set up an interview time.
Anyway, let’s move on to what you’re all here for – the numbers and charts. Everything here is rate base and/or possession adjusted, which is a necessity this season given the wild swings in momentum and possession.
It’s another season where the Cleary coaching style has affected these numbers – the Panthers have the most play the balls per game in 2026 and are averaging nearly 25 play the balls more than team with the worst volume of possession (Brisbane). Adjusting these numbers by the volume of possession or normalising them to a rate based metric is vital.
Here’s the best performers from the (almost) first half of the 2026 season.
Eye Test Player Contribution Rating (ETPCR)
The Eye Test Player Contribution Rating (ETPCR) is a player impact metric, that weights a players’ statistics by how well (or how poorly) they correlate with winning games. It also adjusts for minutes played and possession to normalise these number across teams. A score of 0.0 would represent an average NRL player, who isn’t necessarily a positive contributor but also doesn’t contribute negatively either. Replacement level is somewhere around the -0.7 to -1.2 range depending on position.
If you want to read more about ETPCR, the explainer is here. I again strongly emphasise that this is a player impact metric, not a player talent metric. It’s measuring which players had the biggest impact statistically on their games, not who has been the best player, although there is historically some overlap.
Here’s the top 20 players up to the end of Round 12, with a minimum of five games played.
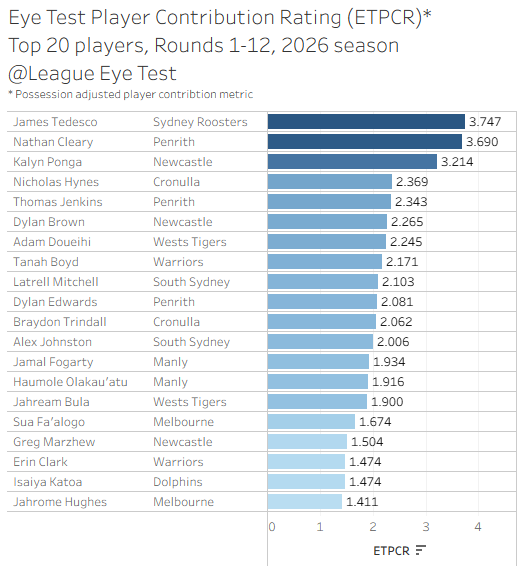
James Tedesco is flying again, and fully deserved his origin spot this year, leading the NRL with an ETPCR of +3.747 this year, indicating he was worth+3.747 points every time he took the field for the Roosters. The remainder of the top three were Nathan Cleary at +3.690 and Kayln Ponga at +3.214.
Dylan Brown’s appearance in this list shows he’s been a fantastic pickup for Newcastle. I am more than happy to admit when I’m wrong and this is one case. I wasn’t sureBrown would be a fit in the #7 but he’s turned out to be the perfect foil for Ponga and Fletcher Sharpe. As noted on the site two weeks ago, Justin Holbrook is doing wonders for the Knights in attack.
To put in perspective how the change in pace of the game and the increase of low calorie rugby league has juiced these numbers, the top three from 2026 would be ranked 2nd, 4th and 8th by historic ETPCR, going back to 2014. Statistical inflation is back.
It’s also Tedesco’s best season at the ripe old age of 33, and he’s shown little sign of slowing down.
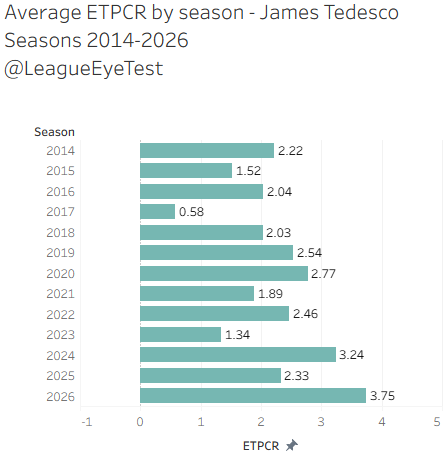
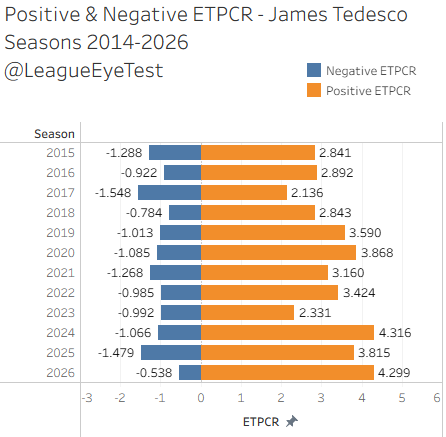
Not only is it his best season by ETPCR, but the negative component of his ETPCR score is the lowest in his career as well.
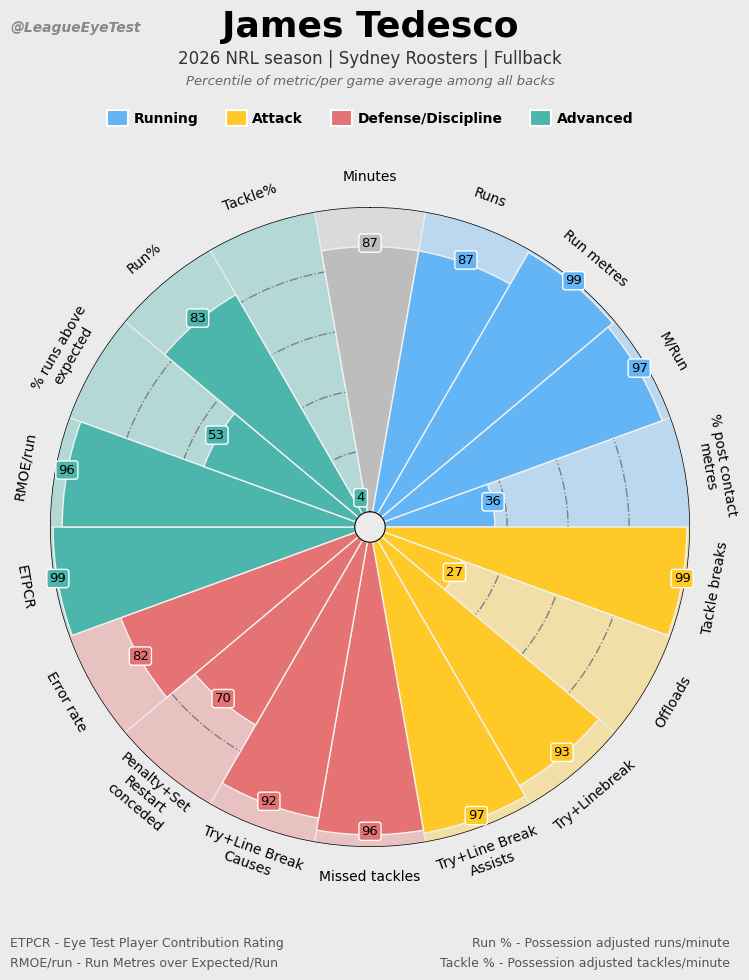
I’ve also finally had some time to create a football style pizza chart for percentile ranks, and Tedesco is absolutely smashing it this season. Big thanks to friend of the site doug_deep who was doing these well before me for providing the inspiration. Each slice represents a statistic, and the number shows the players’ percentile for that metric. Closer to the edge of the chart is better, even for the negative stats.
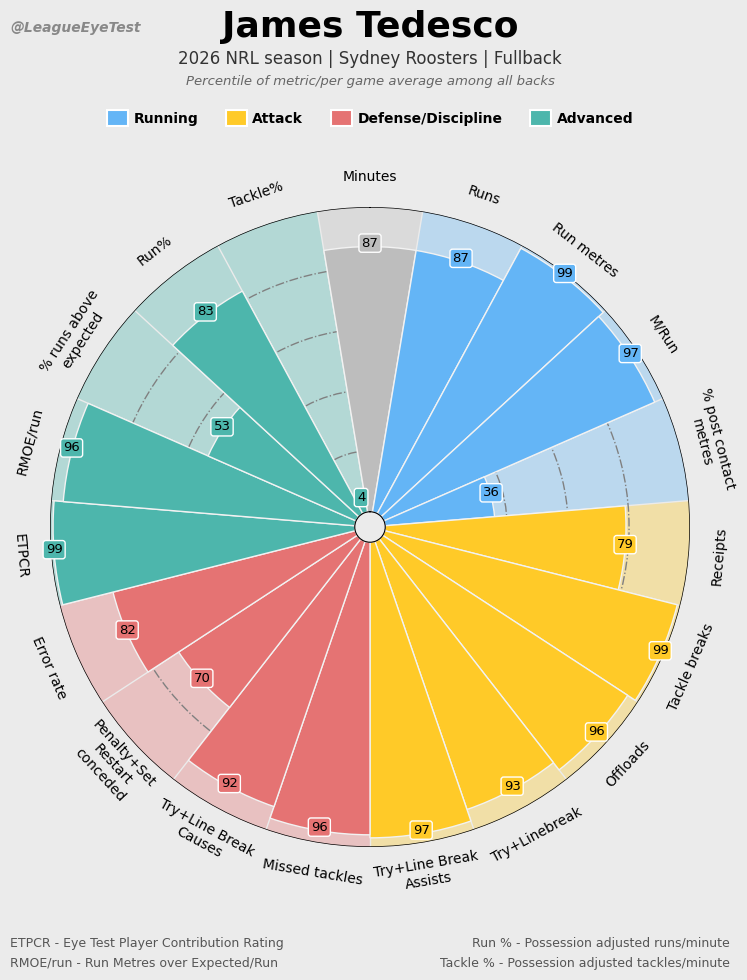
Tedesco is 87th percentile for runs per game, 99th for run metres, 97th for metres per run, 99ths for tackle breaks, 96th for missed tackles (higher is better here), 92nd for line break or try causes, 82nd for error rate, 99th for ETPCR and 96th for Run Metres Over Expected per run. This sort of thing doesn’t usually happen for fullbacks north of their 30th birthday.
Thank you for reading The Rugby League Eye Test. Subscribe below to receive new posts in your inbox and support independent rugby league content.
Next we’ll look at the bottom 25 players by average ETPCR with a minimum of five games played. One thing about this list is that the minimum threshold of games played usually eliminates some of the worst performing players, as they’ve not shown enough to warrant a regular first grade spot and end up out of first grade after 2-3 games.
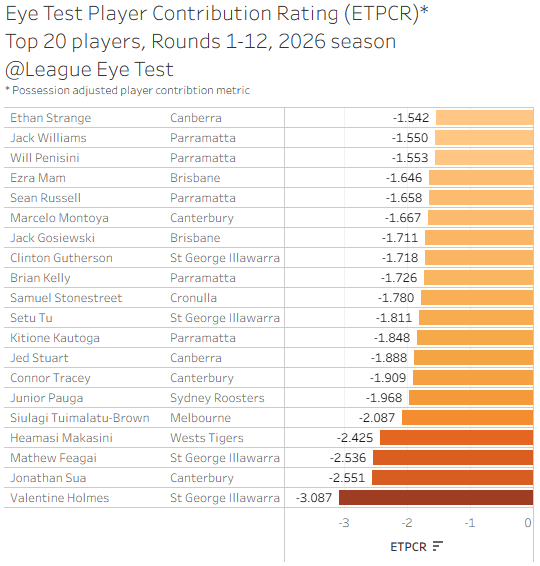
I will also note that try or line break causes weigh heavily on these numbers. Which may not be these players’ fault, but someone will get tagged with the try/line break cause, even if a defensive breakdown happened much further infield. It says more about where the break or try was scored than who was involved.
Usually when you see a good player in the bottom end of this list, it’s due to them having to compensate for defensive issues around them, but I think even Dragons fans would admit that Valentine Holmes is not having one of his best seasons.
Run Metres Over Expected per run (RMOE/run)
Run Metres Over Expected per run (RMOE/run) measures how many metres a player gained (or lost) on their carried compared to an average player given the same starting point, tackle number and position. I’d updated this model last season to include run type as well as position to make for fairer comparisons across positions.
It’s extremely useful in identifying which players are over or under producing in yardage situations, and now that I’ve modeled it on playing position as well, there’s fewer role based outliers. Here’s the top 25 up to Round 12 by average RMOE/run.
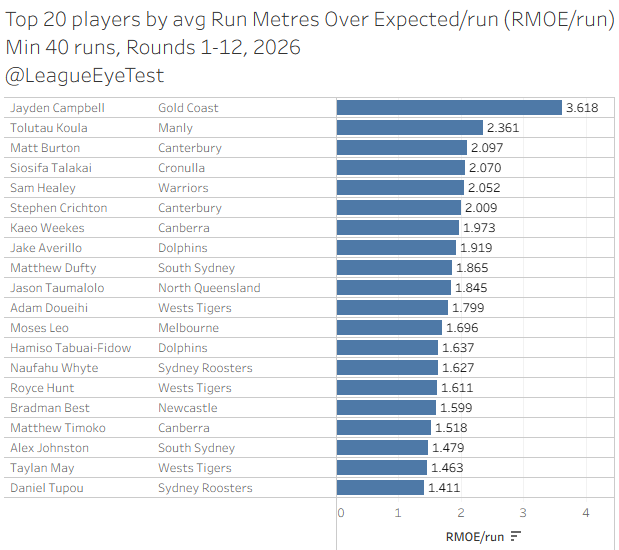
Titans half Jayden Campbell ranks first with a huge +3.618 RMOE/run, basically gaining 3.6 extra metres per run this season. That’s a full metre ahead of last year’s number one Luke Metcalf (+2.599). Second place this season goes to Manly centre Tolutau Koula at +2.361 with Matt Burton in third at 2.097 RMOE/run.
What this does show you is that the longest runs are made by faster outside players, as Campbell has had multiple 80+ metre carries this season. Koula has also had a number of long rage efforts of 50+ metres. Burton has an advantage of running the ball far more often than the rest of the halves his attempts are compared to.
Given this, I also look at the median RMOE/run, or the number where half of a players runs are above. It gives a more consistent picture of damaging runners, rather than someone who can put an 80 metre effort intertwined with a small number of carries that hit expected metres.
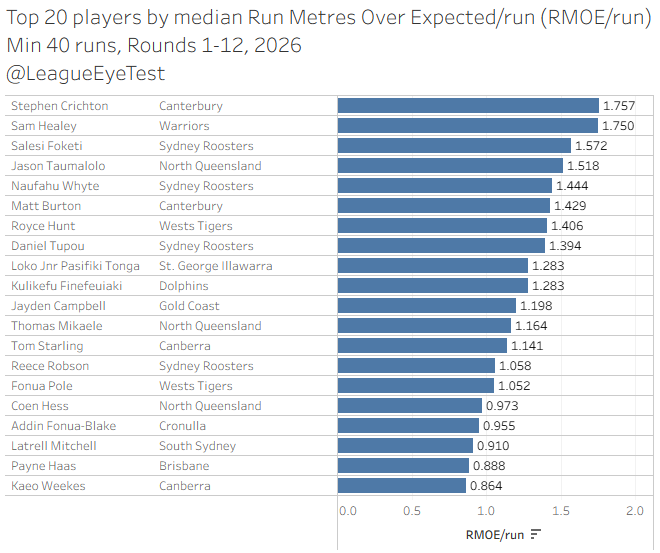
Here we can see why the median is probably a better number, as there’s a more even spread of player types. Stephen Crichton comes in at number one with a median RMOE/run of +1.757, or 1.7 metres more than an average player. This number would indicate that he’s probably not seeing enough ball for the Bulldogs this season.
Warriors dummy half Sam Healy comes in second under median rather than average, at +1.750 with Roosters interchange forward Salesi Foketi third at +1.572. The evergreen Jason Taumalolo is fourth at +1.518, showing even at 32 after nearly 300 games and with no functioning knees he is still one of the most explosive ball carries in the competition.
We can also look at these runs by the percentage of them that hit their expected target or not, which can show who are the most consistently threatening ball runners.
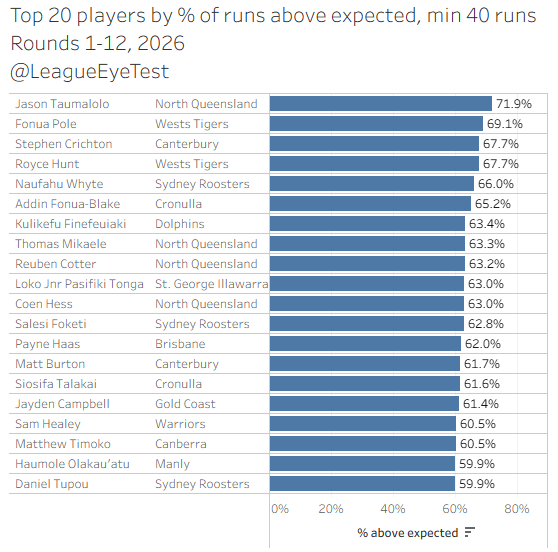
There’s that Taumalolo bloke again, at 71.9% of runs above expected. Wests Tigers middle Fonua Pole is the next most consistent player at 69.1%, with Crichton again showing he’s consistently beating expected metres at 67.7%. He’s also the only back inside the top 13 players.
As noted earlier in the season the Cowboys success this year is on the back of the likes of Taumalolo, Thomas Mikaele, Reuben Cotter and Coen Hess who all make this top 20, with Kai O’Donnell ranked 25th at 58.5%. With eight wins already and a full slate of byes in their hand, the Cowboys should comfortably pick up a top eight spot this season.
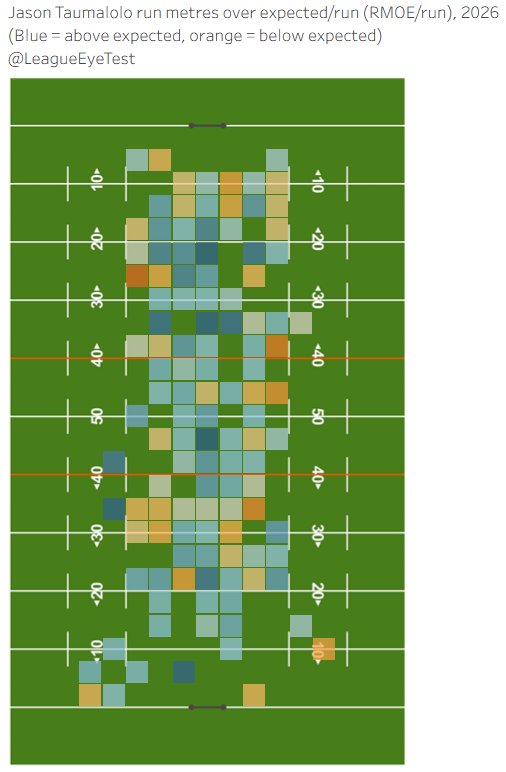
Taumalolo has been beating his expected run metres all over the park as well. Each box marks a 2×2 square where a run originated in, with blue indicating the run that started from that position was above expected, and orange was below, with the intensity of colour indicating by how much.
Error rate
Error rate is the average number of touches by a player per error. It is one of my personal favourite stats, not just because cutting down on errors is the easiest trick to win more rugby league games.
Errors in your opponents’ 20 metre zone are less of a problem than those coming out of your own red zone. Last year the Bulldogs were in first place after 12 rounds (what a difference a year makes) but made half of their errors in the final 20 metres of the field. Playing conservative football only gets you so far, you can’t score points without taking some risk, and that risk will occasionally result in an error.
It’s also useful because it usually matches the eye test (the real one) as to who has the worst set of hands. It also shows who is taking risks – Reece Walsh was near the top of this list a few years back despite having a tremendous season.
I also like it because it normalises touches – a halfback who receives the ball 60 times a game but commits two errors isn’t as troubling as a fullback who makes the same number from 15 touches.
Here’s the top 20 players this season by error rate.
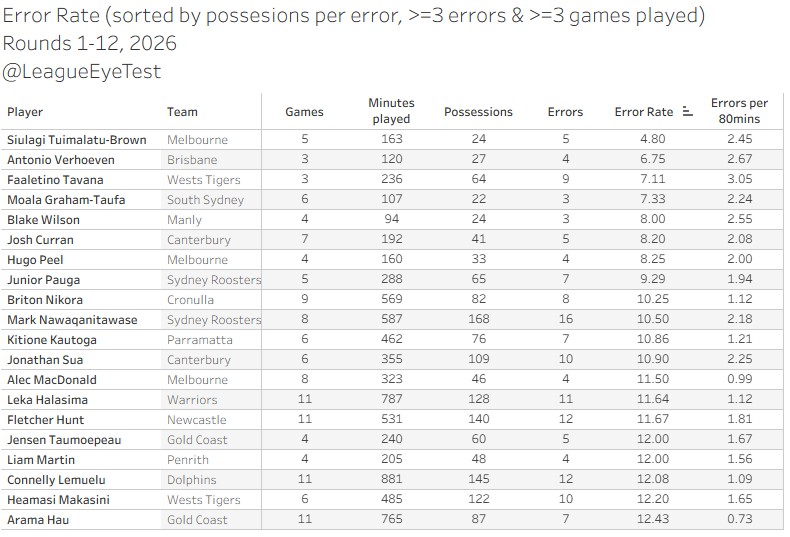
Melbourne’s Siulagi Tuimalatu-Brown has the worst error rate in the NRL this season, with five errors in 24 touches of the ball according to Fox Sports Stats, or one error every 4.8 touches. The next worst is Broncos rookie Antonio Verhoeven at 6.75, with the Tigers Faaletino Tavana third at 7.11.
Generally anything under an error rate of 10.0 is bad, unless you’re a Mark Nawaqanitawase or Alofiana Khan-Pereira type where the volume of points you generate outweighs the ones you throw away. Again you’ll note that this list doesn’t contain a lot of players who have played most of the season.
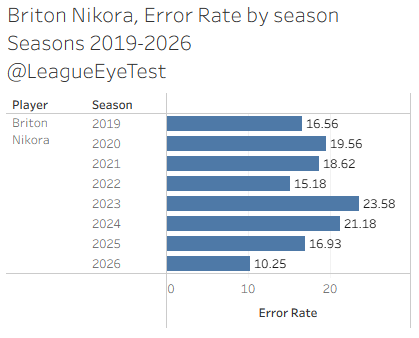
New Origin selection Briton Nikora appearing on this list was surprising to me with eight errors in nine appearances. His error rate of 10.25 would be by far the lowest of his career, with an error every 16.93 touches last season being his previous worst outside of his debut season in 2019.
Non yardage usage rate
Non yardage usage rate was a new metric I looked at in 2025, to identify how often a player completed a set ending action (e.g. kick, try, error). The most useful application of this one is to see which players are dominating the ball at their club and who is playing a more complimentary role. Again, it usually passes the eye test.
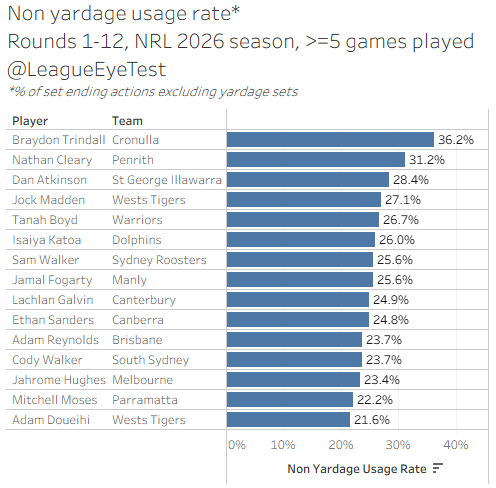
Braydon Trindall leads the way here with 36% of all Sharks non yardage sets completed, with Nathan Cleary the only other player above 30%. Dan Atkinson from St George Illawarra ranked third at 28.4%.
Tackle Rate
Tackle Rate shows which players are making the most tackles per minute adjusted for possession. After all you can’t make tackle if you have the ball. With these rate based metrics, the numbers generally go down when minutes go up, so seeing high volume minute players here is a sign of high work rate. These minute based work rate metrics also translate well from lower grades to first grade.
Here’s the top 20 players for 2026 from a minimum of 160 minutes played.
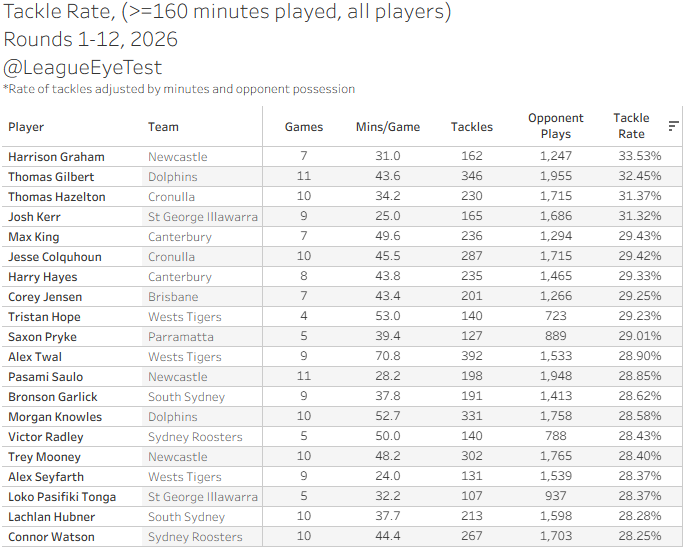
Knights forward Harrison Graham takes top spot for Tackle % at 33.53%, completing a tackle on one third of Newcastle defensive possessions. Thomas Gilbert, Tom Hazelton and Josh Kerr were the only other players above 30% this season.
Victor Radley’s work rate here is probably part of the reason he has been picked for the New South Wales Origin bench, sitting at the 90th percentile for Tackle Rate. He might be 90th percentile in Tackle %, but he’s also 1st percentile in Set Restarts + Penalties conceded.
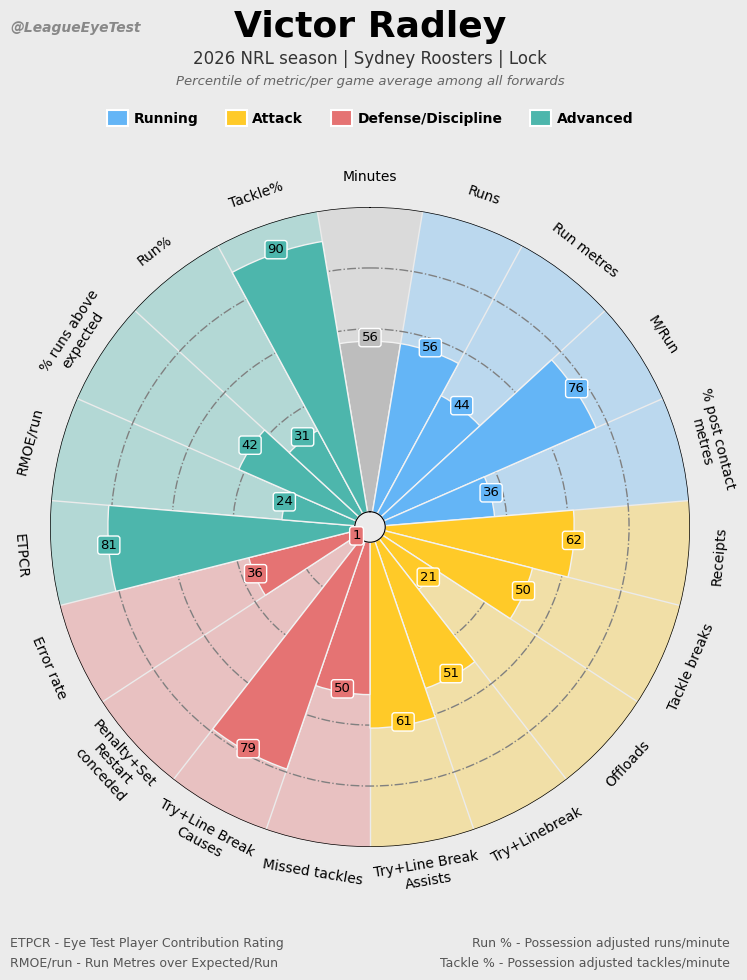
That’s not a typo, 99% of NRL forwards have conceded fewer penalties and set restarts combined per game. The NRL is claiming that Origin wont be officiated differently than club matches, but if they are then Radley’s strong contact may not be as much of a liability.
Ball Runner Rate
Ball Runner Rate metric indicates how often a player runs the ball, adjusted for minutes and possession as well. It’s has no factor for quality of run, just how often they’re completing one. I see this as a complimentary statistic to RMOE/run.
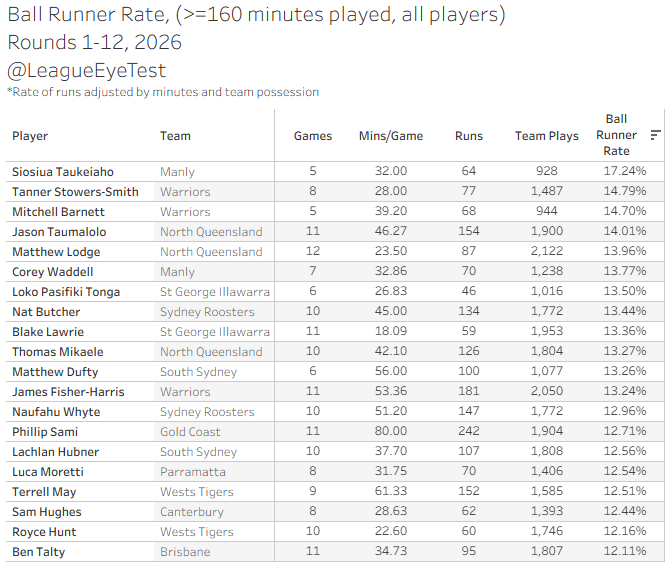
Manly forward Sio Siua Taukeiaho takes first place here at 17.24%, who was turning back the clock and having a massive impact running the ball before a serious leg injury. That’s the only time a player has broken 17% in the first half of the season since Daniel Suluka-Fifita did it for South Sydney in 2023.
This season has shown an interesting change, as this stat is usually the domain of the younger middles getting a run off the bench and letting everything out in 15 minutes of fury. However in 2026 there’s a lot of old heads on this like, with Taukeiaho in first, and Mitch Barnett, Jason Taumalolo and Matt Lodge also in the top five.
Note Matt Dufty and Phillip Sami sitting inside the top 20 as well, showing more effort with the ball than most forwards.
Option Run %
Option run % is the percentage of team plays where a player runs a decoy or support run.
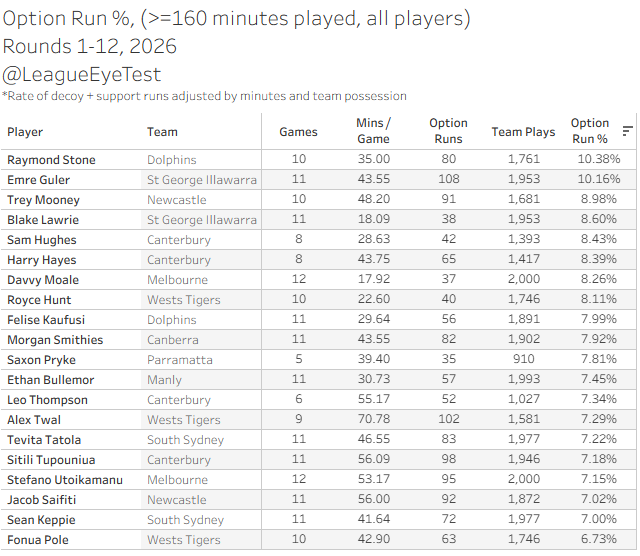
Dolphins hard man Ray Stone nabs first for Option Run, completing a support or decoy run on over 10% of his teams’ plays this season. Dragons prop Emre Guler also broke the 10% mark this year at 10.16%.
The fact the Dragons have two of the top four players on here, as well as both Couchman brothers in the top 30, yet have scored only 142 points this season shows you it’s not the volume of support or decoy runs that matter, it’s when and where they’re used.
Like the prior stats, Option Run % tracks the rate of option runs (decoy or support) that a player makes adjusted for time on field and possession. Here are the top 20 for the first thirteen rounds of the season.
Involvement Rate
Involvement Rate combines all three of the above numbers to create a catch all work rate number. As noted for Ball Runner Rate it does not necessarily imply quality of involvement, only how often a player is making a run or completing a tackle. Below is the top 20 for Rounds 1-12 this year.
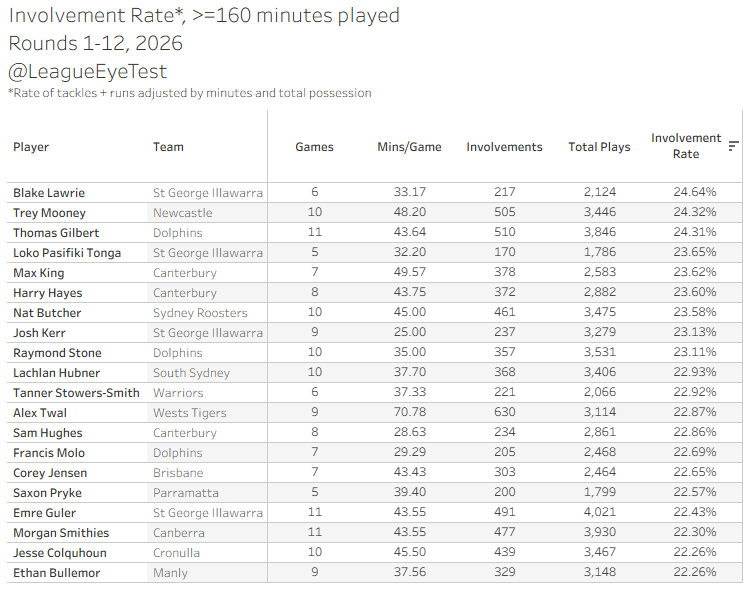
Dragons middle Blake Lawrie finally takes top spot after sitting second in 2025 behind Sam Tuaviti from the Eels at the seasons halfway point. His 24.64% Involvement Rate indicates he’ completed a run or tackle on nearly a quarter of Dragons plays this season whilst on field. Knights prop and $550 designer boot wearer Trey Mooney was slightly behind Lawrie at 24.64% with Fins prop Tom Gilbert ranking third at 24.31%.
There’s some impressive numbers form Loko Pasifiki Tonga showing a huge motor at 23.65% in fourth spot, one of the few bright spots this season for St George Illawarra fans.
Run angles
Lastly we’re going to finish up with my favourite useless stat (not counting anything boot or sock related) – run angles. Here we take the starting point and end point of a run, and using the Pythagorean theorem we can work out the angle of the run. Then we can determine how wide or narrow players are running at.
What use does it have? Not much, given that we’re assuming every run starts from the same point, and it doesn’t take into account the angle or velocity of the player before they touch the ball.
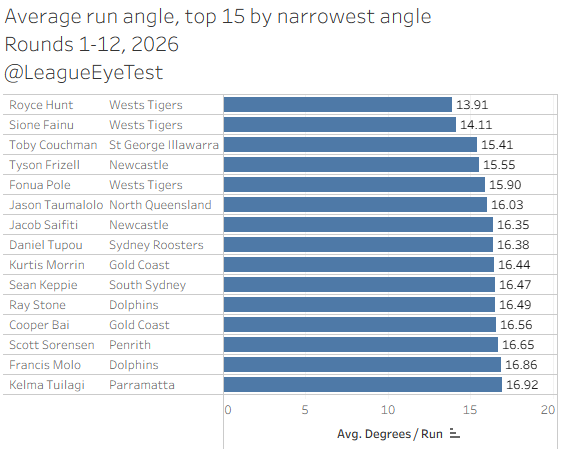
The straightest runner in the NRL this season has been Wests Tigers forward Royce Hunt at 13.91 degrees, slightly ahead of team mate Sione Fainu at 14.11%.
Another Taumalolo note – that 16.03 degrees is the straightest running angle he’s had since 2020, the previous best was 16.53 in 2023 and down from the 19.0 degrees he was running at in 2025.
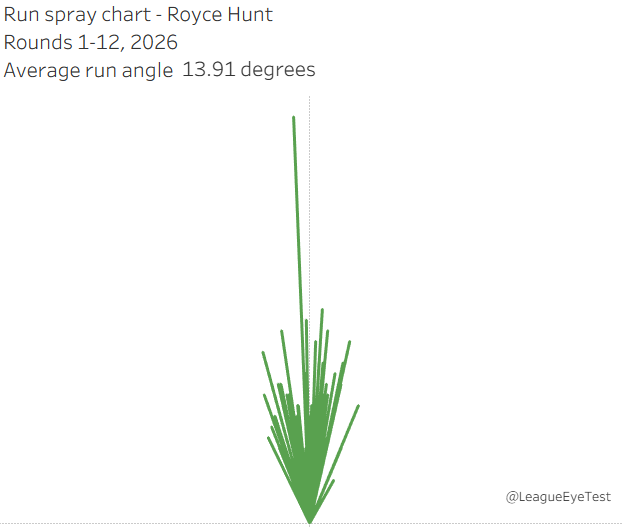
Here’s a run spray chart of Hunt’s carries this season, straight as an arrow, including a 38 metre barnstorming run that resulted in a try during the closing stages of their Round 8 victory over Canberra.
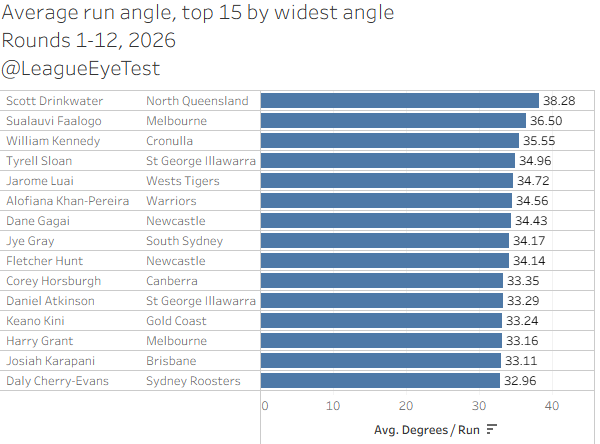
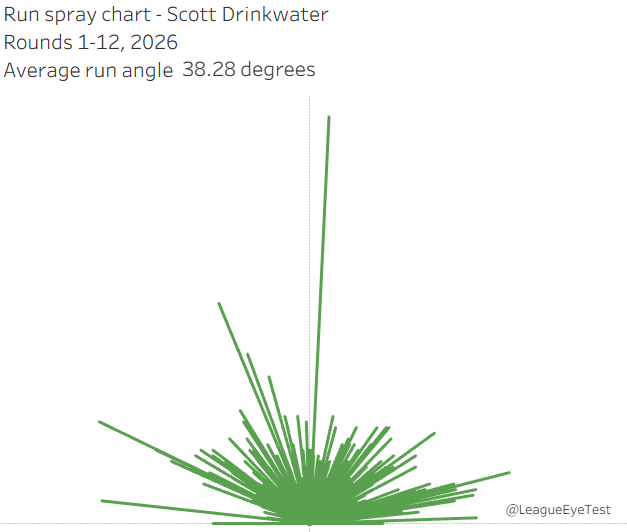
And crab of the year for the player with the widest run angle in the NRL goes to Scott Drinkwater at 38.3 degrees. This number is somewhat skewed by fullbacks and wingers taking kick returns in the corner and running them back closer to midfield. Spine players are the other archetype who show up here as they engage the line in attack with sideways movement in an attempt to open up a hole for someone running an angled line.
Drinkwater’s run spray chart shows some of that width isn’t just from kick returns, there’s plenty of lateral runs at the line most likely from attacking phases.
—
The Rugby League Eye Test produces artisan small batch rugby league analysis that you can’t get anywhere else. In an era of low effort AI slop, the Eye Test offers hand crafted data and independent analysis that you can trust came from a human brain.
This sort of quality workmanship takes time and effort. Quality independent, ad-free rugby league content doesn’t exist without support from readers and the community. The Rugby League Eye Test operates under a value for value model.
If you’ve enjoyed this post, and are in a position to do so, then you can donate an amount of your choice through the PayPal link below, the Kofi page, or through the support page on the site’s menu. You can decide the level of contribution based on the value you believe the Eye Test provides to you.
Support The Rugby League Eye Test
For those of you in areas (such as New Zealand) where there’s issues with PayPal donations for some reason, I’ve set up a Kofi page as well for donations.
If you’re not in a position to donate financially, you can still support the site by sharing this post with others who might enjoy it. Support and promote independent rugby league content