
HomeCO2 & Greenhouse Gas EmissionsAround 30% of the world’s emissions have some carbon price, but how much extra are people paying?
Recently, I was in a meeting with a group of people who do not normally spend much time in the same room: environmentalists, climate scientists, and economists.
Over several days, we debated and tried to untangle some of the most contested issues around climate change: how drastic the impacts would be, what solutions would look like, and what this would mean for global development. The discussions were intense. There were disagreements left, right, and center.
Despite all of the differences in the room, it struck me that there was one thing everyone agreed on: those who emit greenhouse gases should pay for the damage they cause — there should be a price on carbon.1
How, then, is the world acting on this rare consensus between environmentalists and economists?
We’ve made some progress. In 2010, just 7% of the world’s carbon dioxide (CO2) emissions were covered by a carbon price, either through a tax or a carbon trading scheme. Last year, 30% were.
We wrote about the coverage of carbon markets and how this has changed over time in a previous article.
But to be effective, carbon prices need to be high enough to make a meaningful difference to the price of goods and services — enough to incentivize innovation and to make cleaner alternatives meaningfully cheaper.
What is the price of carbon across these markets?
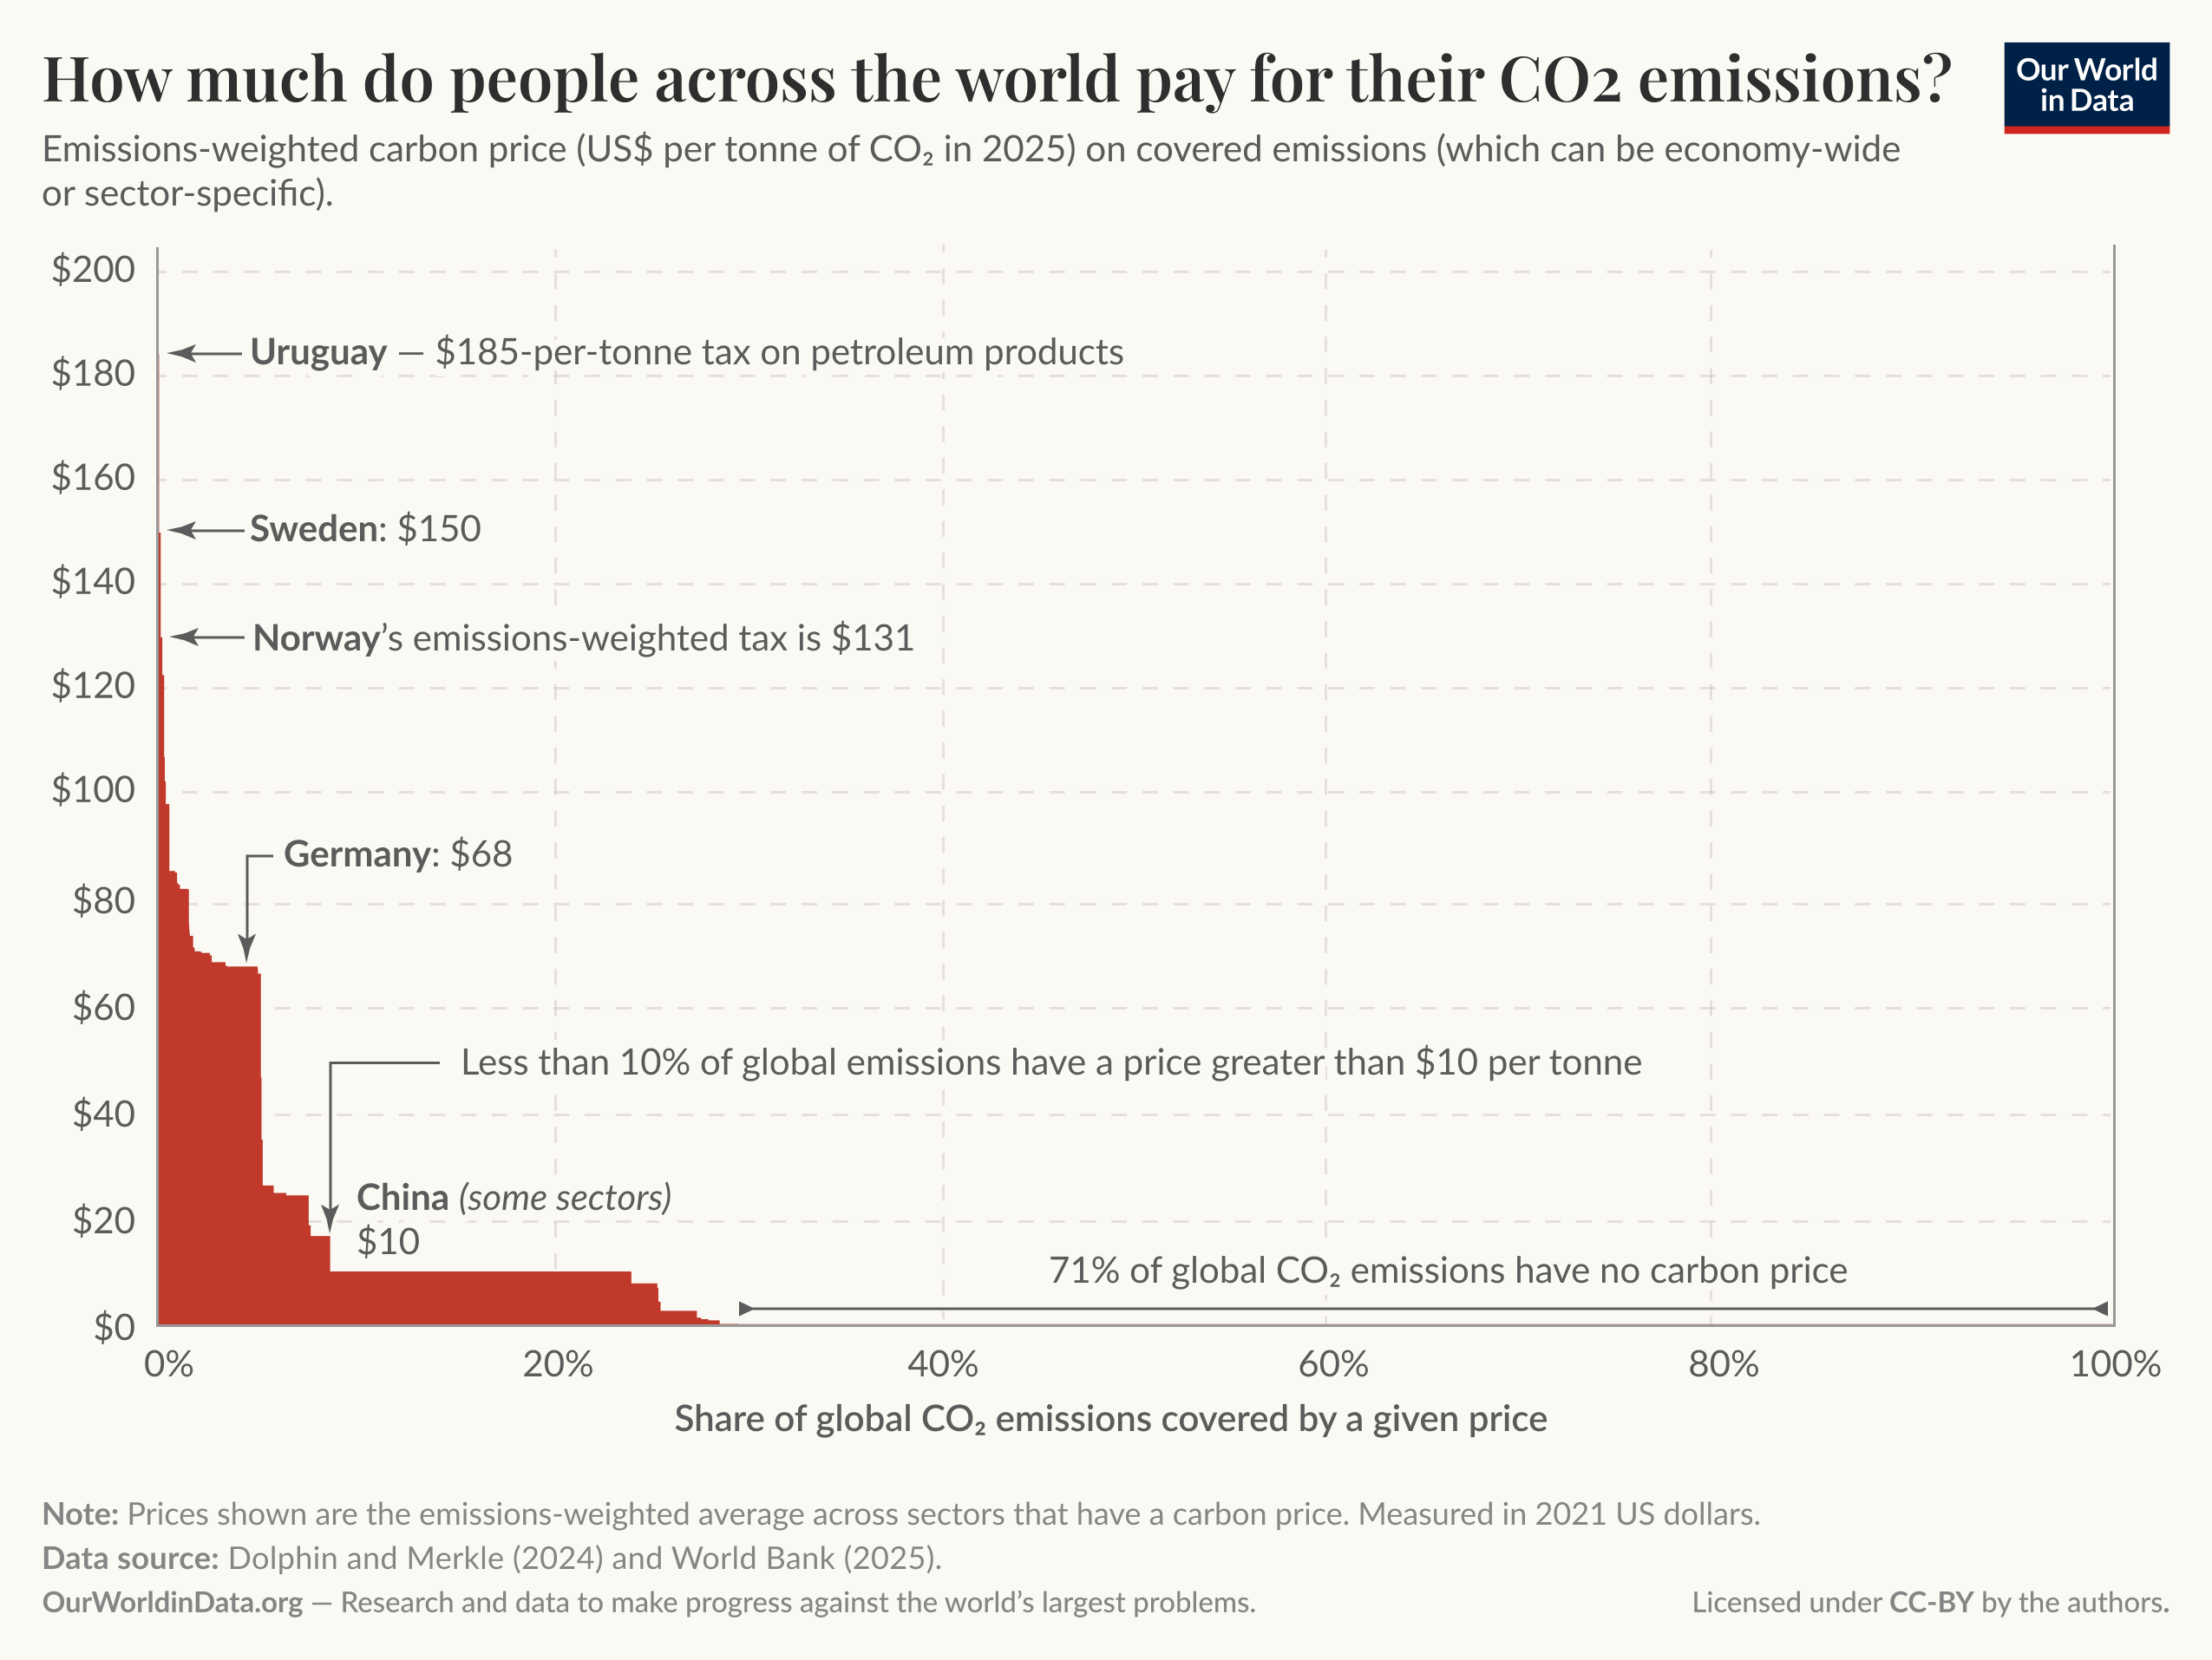
The chart below shows the global picture.2
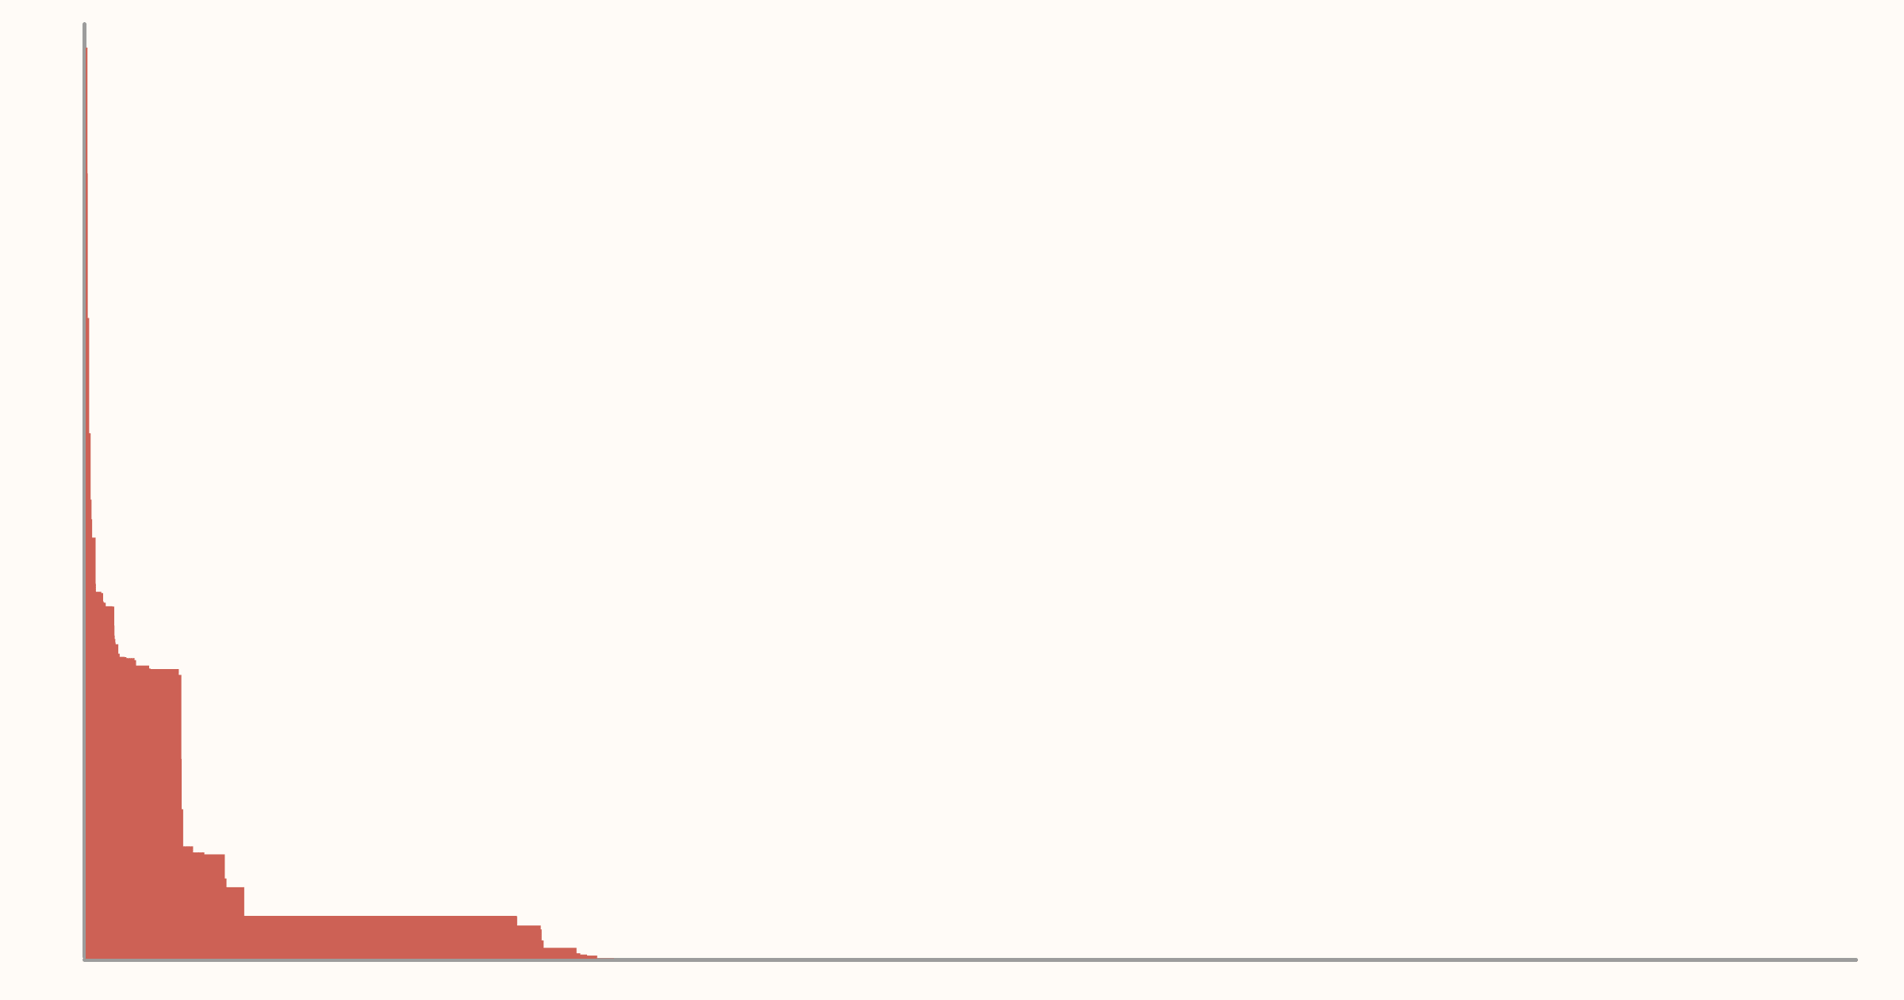
Carbon pricing schemes are lined up from the most expensive on the left to the cheapest on the right. The width of each step shows the share of the world’s CO2 emissions it covers. This not only reflects differences across countries, but is also specific to the sectors or fuels within countries that are priced.3
On the very left-hand side of the chart, you can see that a small share of emissions — less than 0.5% of the total — are taxed at more than $100 per tonne. This is the emissions-weighted price in Uruguay, Sweden, Norway, Finland, Switzerland, and Hungary.
Many countries in Western Europe charge prices in the $65–90 range, mostly due to the European Union’s Emissions Trading Scheme. These emissions account for around 5% of the total.
The majority of carbon markets charge very little: most charge less than $10 per tonne, and some barely a dollar.
At 29%, the red line drops to zero: that’s because the remaining 71% of emissions have no carbon price at all.
Why does this matter?
The rationale for a carbon price is simple: the true cost of burning fossil fuels is not reflected in their market price. The greenhouse gas emissions they generate cause damage, but those costs are not necessarily felt by those who caused them. The point of a carbon tax is to reflect those damages in the price of products and fuels, so that those responsible for the emissions pay a fair price.
My colleague Max Roser wrote a more in-depth explainer about the argument for a carbon price.
There is no consensus on what that fair price should be. Hundreds of academic papers have tried to estimate the “social cost of carbon” — the cost in damages of emitting one tonne of CO₂ today. They span a wide range, but median estimates tend to be greater than $100 per tonne of CO2.4
71% of emissions have no carbon price at all.
This is far higher than the price in almost every carbon market across the world, as we just saw in the chart above.
How do carbon prices actually change how much we pay for energy?
At $5 per tonne, the cost of filling your car with petrol would increase by less than 1%.5 That’s a small increase compared to the typical fluctuations a driver would see at the petrol pump from month to month. In unremarkable years, price swings of 10% to 15% are common in oil markets. And during fuel crises, price increases are even more extreme: the recent war in Iran has led to a 50% price hike.
At a carbon price of $10 per tonne, the increase would still be only 2%.6 Again, barely anything.
It’s only when carbon prices get into the $100 per tonne range — which is broadly in line with estimates of climate damages — that price changes start to register: petrol prices increase by around 15%. That’s about the same magnitude as regular swings in oil markets.7 Yet almost no carbon market charges this much.
The unexpected allies at that climate meeting didn’t just agree that there should be a price on carbon, but that it should be far higher than most people are paying today.
Acknowledgments
Many thanks to Carl Edward Rasmussen for the suggestion of this visualization.
Thanks also to Max Roser and Edouard Mathieu for editorial feedback and comments, and to Geoffroy Dolphin for help with the data.
Continue reading on Our World in DataCite this work
Our articles and data visualizations rely on work from many different people and organizations. When citing this article, please also cite the underlying data sources. This article can be cited as:
Hannah Ritchie and Pablo Rosado (2026) – “How much are people across the world paying for their carbon emissions?” Published online at OurWorldinData.org. Retrieved from: ‘https://archive.ourworldindata.org/20260622-061340/how-much-are-people-across-the-world-paying-for-their-carbon-emissions.html’ [Online Resource] (archived on June 22, 2026).
BibTeX citation
@article{owid-how-much-are-people-across-the-world-paying-for-their-carbon-emissions,
author = {Hannah Ritchie and Pablo Rosado},
title = {How much are people across the world paying for their carbon emissions?},
journal = {Our World in Data},
year = {2026},
note = {https://archive.ourworldindata.org/20260622-061340/how-much-are-people-across-the-world-paying-for-their-carbon-emissions.html}
} Reuse this work freely
All visualizations, data, and articles produced by Our World in Data are completely open access under the Creative Commons BY license. You have the permission to use, distribute, and reproduce these in any medium, provided the source and authors are credited.
The data produced by third parties and made available by Our World in Data is subject to the license terms from the original third-party authors. We will always indicate the original source of the data in our documentation, so you should always check the license of any such third-party data before use and redistribution.
All of our charts can be embedded in any site.