
Quantification and ranking for selected indicators
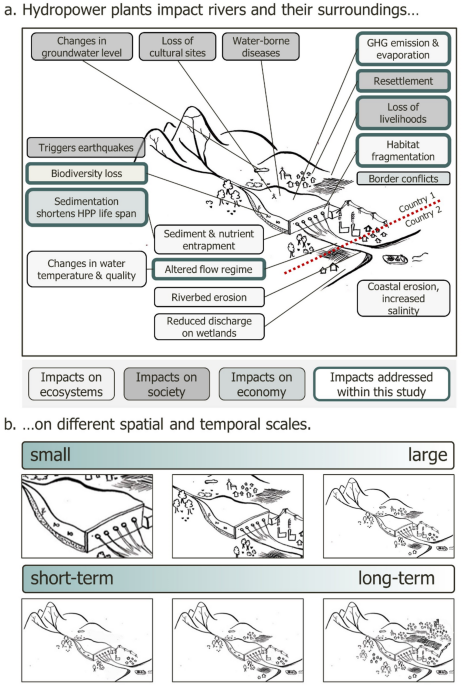
If all proposed HPPs were constructed, the degree of regulation, expressed as the River Regulation Index (RRI), would range across African sub-catchments from 0 to 1265% for dataset 1 and from 0.8% to 1226% for dataset 2. The wide range corresponds with the results of Grill et al. (2015), who introduced the RRI as a method to quantify full-basin impacts in a single index. The index is calculated by weighting the degree of regulation of each river reach by its corresponding river volume and subsequently averaging these values across the entire basin. The degree of fragmentation, expressed as the River Fragmentation Index (RFI), of sub-catchments would range from 0.04% to 92% for dataset 1 and from 0.04% to 81% for dataset 2. RRI and RFI values peaked in the upper Niger, Nile, and Zambezi basins (Fig. S1, S2; Tab. S2, S4). A total of 2,191 million tons of sediment per year was calculated to be trapped by reservoirs (dataset 2: 1,490 million tons per year, Fig. S3). Under these conditions, the estimated lifetime of the HPPs, defined as the time required until the reservoir would be filled with sediments, could be as short as one year. These estimates neglect sediment-management measures such as sediment flushing. Seventeen proposed HPPs (> 10 MW) with a calculated reservoir lifespan of less than one year were excluded from subsequent analyses, as complete sedimentation of a reservoir of a > 10-MW HPP within such a short period is unlikely and most likely reflects imprecise dam-location coordinates. The combined area flooded by all projected reservoirs was estimated at 46,389 km2 (dataset 2: 34,721 km2), with a total reservoir volume of 969 km3 (dataset 2: 826 km3). For both datasets, dam construction and reservoir inundation would impact between one and 11 freshwater megafauna species at individual dam locations (Fig. S4) and overlap with between one and eight protected areas (Fig. S5). In total, 168 projected reservoirs (dataset 2: 84) would overlap with 297 protected areas (dataset 2: 167) and potentially inundate 24,092 km2 (dataset 2: 22,310 km2), equivalent to 0.4% of Africa´s protected area network. Projected reservoirs would also flood 13,039 km2 of cropland (dataset 2: 8,186 km2, Fig. S6), and 4.9 million people currently living in potentially flooded areas would need to be resettled (dataset 2: 2.7 million people, Fig. S7). In addition, the projected reservoir surface would increase evaporation by 6 km3 per year, which corresponds to a 12% increase relative to evaporation from existing reservoirs and natural lakes combined (Fig. S6).
The calculated impacts of proposed HPPs and the impact rankings of proposed HPPs (both datasets) for each indicator and for all indicators integrated are listed in the Supplementary Information (Fig. S1–S8; Tab. S2, S4).
Ranking considering all indicators for the entire continent and for major basins
Each HPP with a calculated impact for all eight indicators was included in the integrated impact quantification and the subsequent ranking (Table 1). In total, 448 proposed HPPs of type reservoir and type unknown were included (dataset 1; dataset 2: 211 HPPs).
Table 1 Summary on different rankings for the lowest ranked and top ranked hydropower plants (HPPs) for dataset 1. Quarter values are indicated following the ranking of each selected indicator. A quarter value of one was given for HPPs ranked in the lowest quartile (Q3, severe, plum). These quarters are summed up for each HPP (sum continent). Again, quarter values are assigned, considering all HPPs across Africa. For the ranking considering indicator compositions, only a selection of indicators was included to derive quartiles (Scenario A: Protected Area, Resettlement, Land Use Change, Megafauna, Potential Evaporation; Scenario B: River Regulation, River Fragmentation, Sediment Entrapment). Detailed information for all HPPs including dataset 2 is listed in SI1-5).
Based on the eight indicators selected, the aggregated impact value could range from eight (i.e., each of the eight indicators has an impact value of 1) to 32 (i.e., each of the eight indicators has an impact value of 4). For individual HPPs (at the continental scale), the calculated total value of all eight indicators combined varied from 9 to 29 for dataset 1 (mean: 19.2 ± 4.1) and from 9 to 27 for dataset 2 (mean: 19.0 ± 3.9) (Fig. 3, S9, S12).
Fig. 3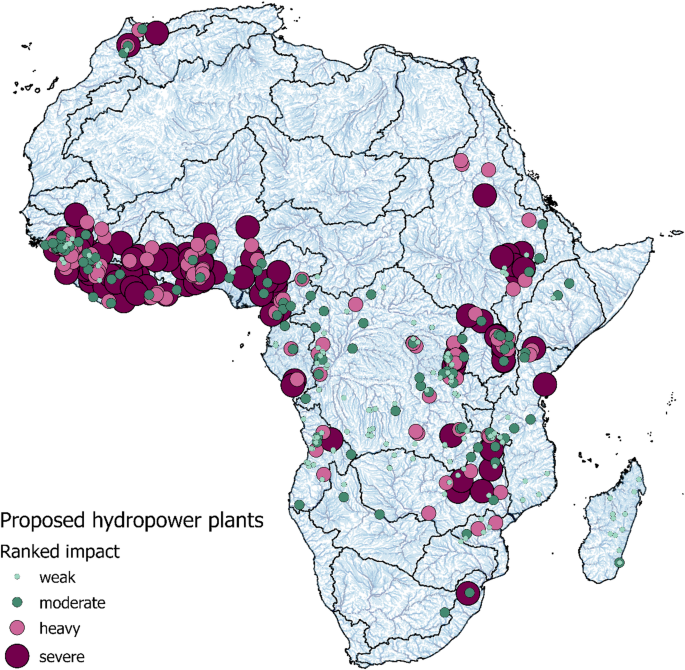
Results of the ranking at continental scale (all indicators) for hydropower plants of type reservoir and type unknown (dataset 1): Circles indicate proposed hydropower plants and size increases with indicated quarter value from weak (< Quartile(Q) 1), moderate (Q1–Q2), heavy (Q2–Q3), to severe (> Q3). Boundaries of major river basins are indicated (HydroBASIN Level 3). Created with ArcGIS Pro 2.9.4, ESRI (https://arcgis.esri.de/arcgis-pro/).
In total, 102 HPPs in dataset 1 and 43 HPPs in dataset 2 were assessed causing severe impacts across the African continent, while 127 (dataset 1) and 61 (dataset 2) HPPs were classified as having low impact (Fig. 3). Overall, 23 countries in dataset 1 and 19 countries in dataset 2 contain proposed HPPs that were assessed as causing severe impacts.
The mean capacity of the twelve highest-ranked HPPs in dataset 1 (total impact values of 27 to 29) was 76 MW, whereas the mean capacity of the ten lowest-ranked HPPs (total impact values of 9 to 11) was 47 MW. Compared with the mean capacity of the complete dataset (152 MW), these values suggest that installed capacity size alone is not an adequate factor to assess an HPP’s impact (Table 1).
Dataset 2 excludes HPPs of unknown type, which are mainly small- and medium-size projects. As a result, the mean capacity in dataset 2 (214 MW) is larger than in dataset 1. Moreover, the difference between the highest- and lowest-ranked HPPs in dataset 2 was less pronounced than in dataset 1. Nevertheless, a remarkable contrast remained, with a mean capacity of 122 MW for the eleven highest-ranked HPPs (total value of 26 to 27) and 198 MW for the nine lowest-ranked HPPs (total value of 9 to 12). These results confirm that HPPs impact and installed capacity are not generally correlated.
The overall rankings of all proposed HPPs (i.e., sum of the assigned quarter value per indicator) are listed in the Supplementary Information (Tab. S3, S5). Spearman’s correlation coefficients revealed no strong or very strong relationships among individual indicators (rs > 0.6, rs < − 0.6), with few exceptions (Tab. S6). We conducted an integrated impact quantification for the Congo, Niger, Nile, Volta, and Zambezi basins (Fig. 4). In the continental-scale assessment, 83% (dataset 2: 83%) of proposed HPPs in the Congo Basin were classified as having low to medium impact. However, the basin-scale assessment revealed that 35 of 84 HPPs in dataset 1 and 5 of 12 HPPs in dataset 2 may cause heavy and severe impacts relative to all proposed HPPs within the basin.
Fig. 4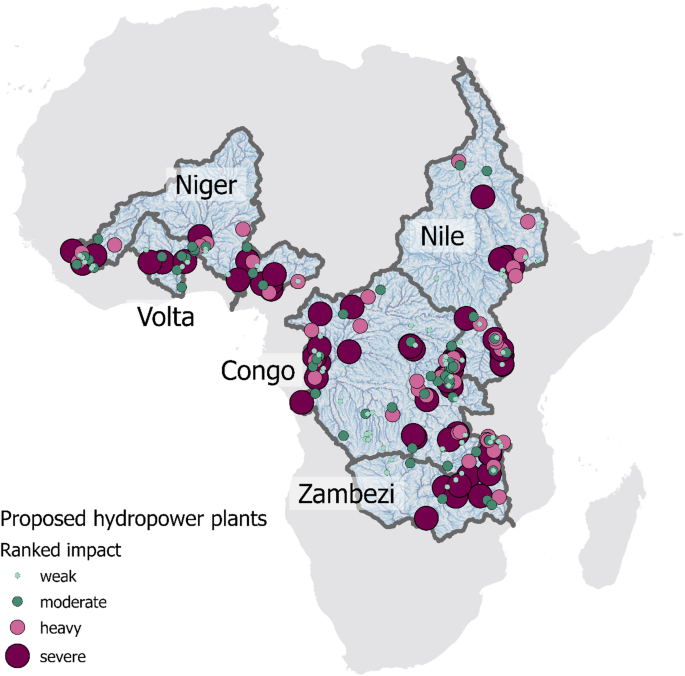
Results of the ranking at basin scale, including all indicators for hydropower plants of type reservoir and type unknown (dataset 1). Basin-scale rankings were conducted for the Congo, Niger, Nile, Volta, and Zambezi river basins (HydroBASIN Level 3). Circles indicate proposed hydropower plants, and circle size increases from weak (< Quartile(Q) 1), moderate (Q1–Q2), heavy (Q2–Q3), to severe (> Q3) cumulative impact. Created with ArcGIS Pro 2.9.4, ESRI (https://arcgis.esri.de/arcgis-pro/).
This difference is mainly due to the spatial scale at which indicators are aggregated: At the continental scale, quantified impacts are distributed over a wide range of values, with the highest values assigned mainly to HPPs located in the Nile basin and eastern Africa. Simultaneously, most HPPs proposed for the Congo Basin are classified as having low to moderate impacts in the continental comparison. Applying the same ranking method at basin scale changes both HPP rankings and quartile assignments because the assessment is based on a smaller set of HPPs. Consequently, several HPPs located in the Congo Basin are reclassified as having heavy or severe impacts. Basin-scale results for dataset 2 are presented in the Supplementary Information (Fig. S10).
The basin-scale assessment shows that several proposed high-impact HPPs in the Congo Basin received comparatively lower rankings in the continental assessment. According to the continental ranking, only one proposed HPP in the Congo Basin was classified as having severe impact (N = 448). In contrast, the ranking of scenario A assigned a total of 11 proposed HPPs to the highest impact category (N = 448). Considering only HPPs within the Congo Basin, 20 of the 84 proposed HPPs were classified as causing severe impacts (N = 84). The Congo Basin contains large regions that are sparsely populated, leading to lower impacts related to human resettlement and cropland loss than in the Nile, Niger, Volta, and Zambezi basins. At the same time, the Congo represents one of the last very large free-flowing rivers in the world27 and harbours a very high and unique biodiversity57. Consequently, an implementation of the 84 proposed HPPs along the Congo River and its tributaries must be carefully evaluated within the broader water-energy-food-biodiversity nexus. If alternative energy options were exploited and electricity shared across borders, the Congo River system could be maintained in a largely free-flowing state.
Ranking considering different indicator compositions
Not all proposed HPPs classified as causing severe impacts in the integrated assessment received the same outcome for the single indicator ranking. Omitting one indicator at a time caused 83 to 107 HPPs in dataset 1 (50 to 77) to be reassigned to a different quarter (Tab. S3, S5). The ranking proved most sensitive to the removal of the indicators Protected Area and River Regulation, which led to the largest number of quartile reassignments. In contrast, excluding Land Use Change had the smallest effect on the overall ranking.
Two scenarios were developed to assess how different indicator compositions influence the total ranking of proposed HPPs (Fig. 5). Scenario A includes the indicators Protected Area, Resettlement, Land Use Change, Megafauna, and Potential Evaporation, which serve as proxies for the direct impacts of reservoir inundation and dam construction (Fig. 1). Applying this scenario, HPPs proposed within the Nile Basin were assessed as causing severe impact (i.e., located in the top quarter). Scenario B includes the indicators River Regulation, River Fragmentation, and Sediment Entrapment. These indicators are proxies for impacts measurable at larger spatial scales and capture the effects of dam construction on entire river networks at the basin level. HPPs classified as causing severe impacts under Scenario B were mainly located in West Africa and in the Zambezi and Congo basins (Fig. 5).
Fig. 5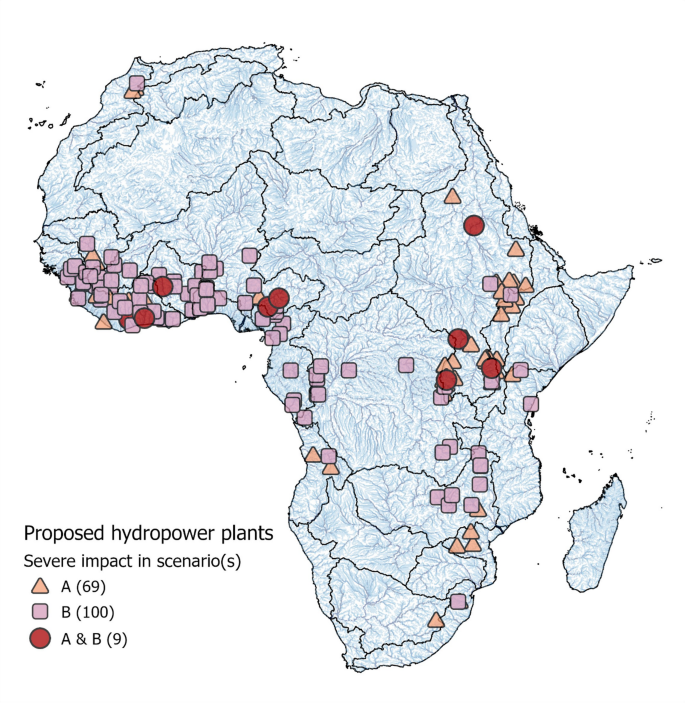
Results of the scenario ranking at continental scale by applying two different scenarios of indicator composition for hydropower plants of type reservoir and type unknown (dataset 1) Scenario A: Protected Area, Resettlement, Land Use Change, Megafauna, Potential Evaporation; Scenario B: River Regulation, River Fragmentation, Sediment Entrapment: Symbols indicate proposed hydropower plants (HPPs) in the top quarter (> Quartile 3; severe impact) of one (A: orange triangle, B: pink), or both scenarios (red circle). Total number of HPPs in each category given in brackets. Created with ArcGIS Pro 2.9.4, ESRI (https://arcgis.esri.de/arcgis-pro/).
A total of nine proposed HPPs were assessed as causing severe impacts under both indicator-composition scenarios: These included the HPPs Sabaloka (205 MW, Sudan), Nandi Forest (50 MW, Kenya), Agbinika (20 MW, Uganda), and Haiserero (1 MW, Uganda) proposed in the Nile Basin; the HPPs Katsina-Ala (109 MW, Nigeria), and Garin Dalli (92 MW, Nigeria) proposed in the Niger Basin; the HPPs Boutoubre (156 MW) and Aderci Tiassalé (15 MW) proposed for Ivory Coast; and the HPP Noumbiel (60 MW, Burkina Faso) proposed for the Volta Basin. Results for dataset 2 are provided in the Supplementary Information (Fig. S11). The comparison confirms that HPPs rankings are influenced not only by the selection of indicators, but also by the number of HPPs projects considered in the analysis.
The nine proposed HPPs identified as causing severe impacts under both indicator-composition scenarios mark locations where local-scale impacts (Scenario A) and catchment-scale impacts (Scenario B) coincide. The spatial distribution of the remaining severe-impact HPPs differ markedly between the two scenarios: Scenario A identifies severe-impact projects predominantly within the Nile Basin, whereas Scenario B highlights projects mainly in Western Africa and the Zambezi Basin. This spatial divergence shows that the dominant type of hydropower impact is not uniformly distributed across the African continent. Local-scale pressures, such as resettlement, land-use change, and impacts on protected areas, tend to concentrate in different regions than catchment-scale pressures, such as river regulation, fragmentation, and sediment entrapment. Consequently, areas experiencing the highest local impacts do not necessarily coincide with those facing the greatest basin-wide ecological alterations.