It’s dangerous to draw conclusions too quickly – but the worst may now be over in terms of mortgage distress.
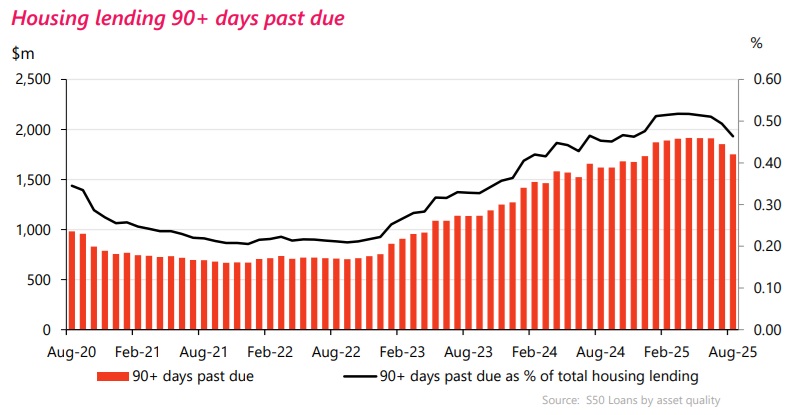
Latest monthly loans by asset quality figures from the Reserve Bank (RBNZ) show that the amount of mortgage money classified by the banks as non-performing fell by $88 million in August to $2.314 billion.
This is the biggest fall in non-performing mortgage debt since October 2020 during a period in which a brief pandemic spike was unwinding.
Significantly though, the drop in August follows a $55 million fall in July (which had earlier been the biggest fall in nearly five years) and means that the amount of non-performing mortgage loans has reduced by 5.8% in just two months from the peak level of $2.457 billion seen in June.
The $2.314 billion non-performing total is now the lowest such total since December 2024.
Breaking the figures down, as of August $1.751 billion worth of mortgages were classified as being 90 days past due but not impaired. That total has dropped $104 million in the last month. However, the total of loans that are impaired has actually risen, by $15 million to $563 million.
The non-performing mortgage figures began rising after interest rates started increasing around the middle of 2021 (this was even before the RBNZ began raising the Official Cash Rate in October 2021).
If we look at the RBNZ monthly averages of advertised ‘special’ rates, the average one-year rate as of June 2021 bottomed out at just 2.21%. By the end of 2021 it was 3.59%. As of December 2022 it was 6.40% and the peak, of 7.30% was seen in November and December 2023.
By the end of last year the average one-year rate was down to 5.78% and by August 2025 it was down to 4.74%. More falls can be expected and, indeed this week we’ve seen the BNZ put out a 4.49% one-year offer.
Of course, what’s being offered as rates for new mortgages is a very incomplete picture. What people are actually paying on existing mortgages can be seen from the figures supplied to the RBNZ by the banks for the yields on their mortgages. These figures tell us that the average yield continued to increase some time after advertised new mortgage rates started declining last year, peaking at 6.39% as of October 2024. But the average yield is now falling quite swiftly, down to 5.55% as of July 2025.
And this is all clearly now starting to have an impact on non-performing mortgage loans.
In June 2021 the non-performing mortgage loans total stood at just $838 million and that figure didn’t actually change much over the next year and a half. The non-performing total was $850 million at the end of 2022 – but then really started kicking up in 2023, reaching $1.517 billion by the end of that year and then $2.163 billion by December 2024.
While the non-performing mortgage loan ratio did rise very strongly, up from just 0.2% in late 2022, the rise has been less marked than that seen after the Global Financial Crisis. Between 2009 and 2011 the ratio frequently hit 1.2%.
At the peak of the non-performing figures, the total of $2.457 billion represented a little under 0.7% of the then total of over $374 billion worth of outstanding bank mortgage loans.
In forecast information provided to the RBNZ, the country’s big five banks had expected non-performing loan ratios to peak at about about 0.7% by the middle of this year – which effectively is what we’ve seen – and then start to reduce in the final quarter of the year. This now appears to be what’s happening.
And the improving trend in the non-performing loans is not the only sign of ‘spring’ in the latest monthly figures.
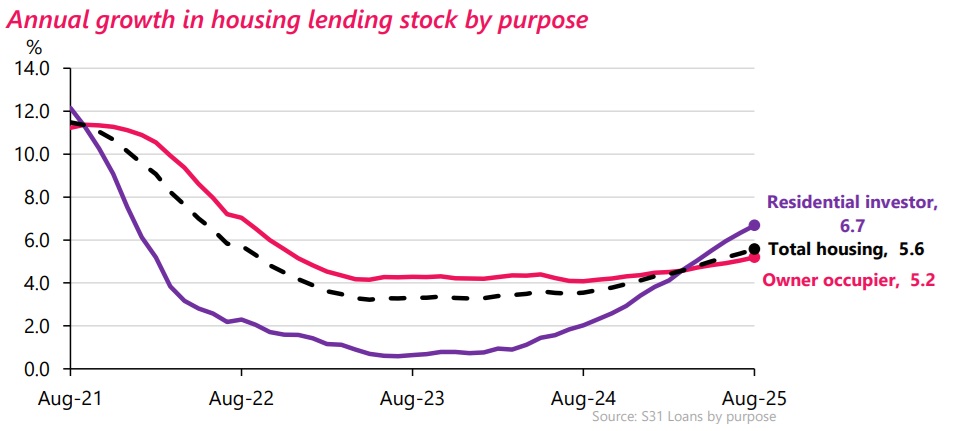
According to the RBNZ’s monthly sector lending for banks summary for August, housing lending stock increased by $2 billion (0.5%) in August 2025 to a grand total of $377.484 billion, with the annual growth rate increasing from 5.4% to 5.6%.
Owner occupier lending increased by $1.3 billion (0.5%), while residential investor lending increased by $680 million (0.7%).
Investor lending mortgage stock increased by $6.136 billion (6.7%) to $97.973 billion, with the 6.7% rate of increase being the most in around four years since the tail end of the big investor pandemic boom.