
By Glen Hallick, Reporter
Production estimates for most crops in 2026-27 will be larger than earlier forecasts, according to updated supply-demand estimates from Agriculture and Agri-Food Canada released July 20.
Those changes followed the planted area report issued by Statistics Canada on June 30 as well as the first Canadian Crop Yield Forecast for 2026.
Why it matters: Changes to AAFC’s monthly supply and demand estimates can have an effect on futures and cash prices.
Aside from significant increases for canola, dry peas and lentils 2026-27 ending stocks were adjusted either way depending on the crop.
Canola
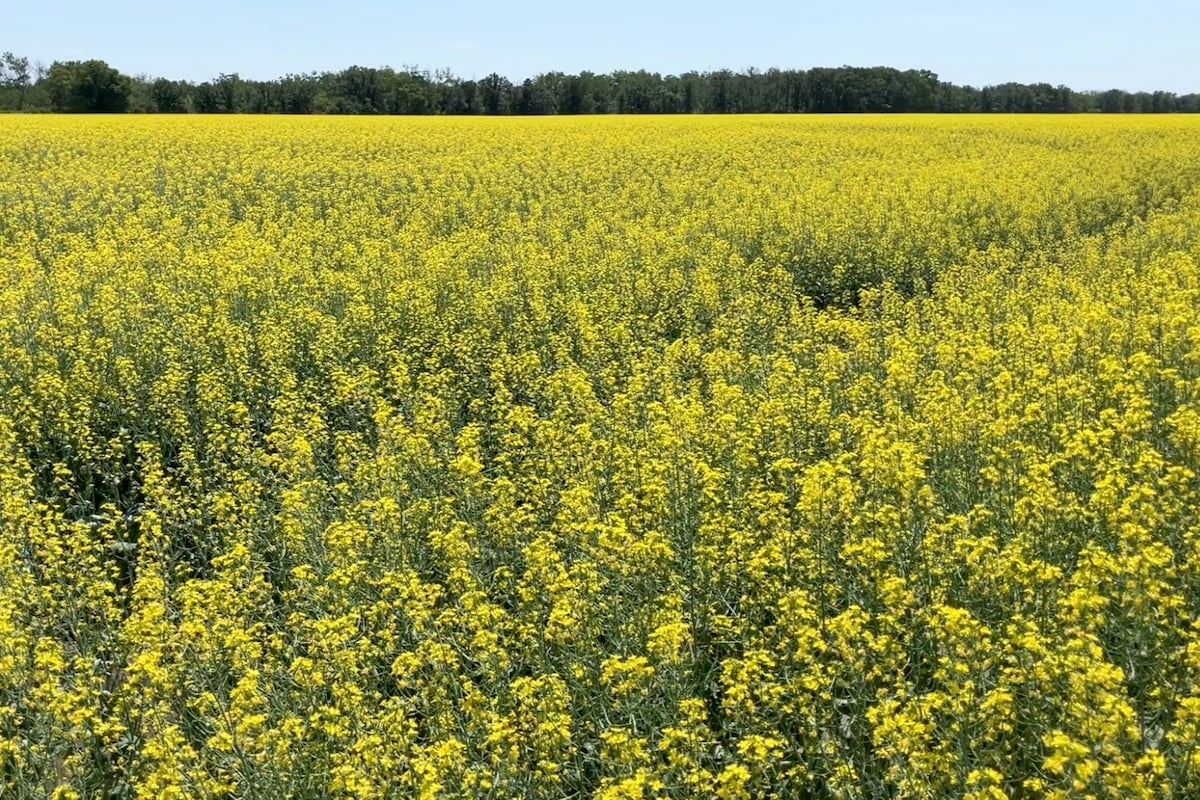
With a record amount of planted canola acres and expectations of above average yields, canola output for 2026-27 was raised to 21 million tonnes from 19.2 million in June’s report.
Exports for 2026-27 were bumped up 500,000 tonnes at eight million tonnes. Those for 2025-26 tacked on 100,000 tonnes at 8.5 million tonnes.
Projected canola ending stocks for 2026-27 climbed to 2.07 million tonnes from 1.31 million in AAFC’s June report. The 2025-26 canola carryout forecast was relatively steady at 2.7 million tonnes.
Domestic usage for 2026-27 rose to 13.75 million tonnes from 13.2 million, while that for 2025-26 was held at 12.3 million.
All Wheat & Durum
All Wheat production was upped to 35.26 million tonnes from 34.6 million in June.
All Wheat ending stocks for 2026-27 were trimmed by 100,000 tonnes at 5.5 million, and those for 2025-26 were cut by 300,000 tonnes at 6.5 million.
AAFC sliced 150,000 tonnes from its 2026-27 all wheat exports of 28.35 million tonnes and those for 2025-26 were kept at 29 million.
Durum production for 2026-27 was increased by more than 245,000 tonnes at 6.04 million and the carryover was eased back 100,000 tonnes at 1.2 million.
July estimates for Canadian major crops supply and demand in million tonnes. Source: AAFC.
Grains and oilseeds
Production
Exports
2026/27
2026/27
2025/26
2026/27
2026/27
2025/26
July
June
July
June
All wheat
35.260
34.598
39.955
28.350
28.500
29.000
Durum
6.042
5.796
7.135
5.150
5.300
5.600
Barley
9.200
8.339
9.725
3.300
2.900
4.070
Corn
16.400
15.622
14.867
2.400
1.900
1.500
Oats
2.940
3.379
3.920
2.350
2.350
2.350
Canola
21.000
19.200
21.809
8.000
7.500
8.500
Flaxseed
0.350
0.400
0.454
0.275
0.275
0.280
Soybeans
7.500
7.500
6.793
5.600
5.400
5.500
TOTAL
93.249
89.661
98.321
50.457
49.007
51.352
Domestic Usage
Ending Stocks
2026/27
2026/27
2025/26
2026/27
2026/27
2025/26
July
June
July
June
All wheat
8.015
7.403
8.725
5.500
5.600
6.500
Durum
0.697
0.501
1.039
1.200
1.300
1.000
Barley
6.090
5.909
6.054
0.900
0.700
0.900
Corn
15.900
15.722
15.251
2.100
2.000
1.800
Oats
0.960
1.249
1.296
0.450
0.600
0.800
Canola
13.751
13.201
12.301
2.074
1.306
2.707
Flaxseed
0.105
0.104
0.089
0.210
0.268
0.210
Soybeans
2.200
2.300
2.050
0.386
0.378
0.286
TOTAL
47.514
46.350
46.235
11.866
11.152
13.632
Pulse and Special Crops
Production
Exports
2026/27
2026/27
2025/26
2026/27
2026/27
2025/26
July
June
July
June
Dry peas
3.150
2.950
3.934
2.700
2.700
2.700
Lentils
2.650
2.350
3.363
2.300
2.300
2.300
Dry beans
0.450
0.310
0.438
0.380
0.370
0.405
Chickpeas
0.420
0.340
0.482
0.230
0.230
0.250
Mustard
0.140
0.152
0.140
0.095
0.095
0.095
Canaryseed
0.140
0.168
0.235
0.135
0.135
0.135
Sunflower
0.067
0.058
0.069
0.035
0.035
0.033
TOTAL
6.917
6.328
8.661
5.875
5.865
5.920
Domestic Usage
Ending Stocks
2025/26
2025/26
2025/26
2026/27
2026/27
2025/26
July
May
July
June
Dry peas
0.650
0.650
0.746
0.810
0.710
0.990
Lentils
0.300
0.300
0.254
1.540
1.240
1.415
Dry beans
0.070
0.070
0.073
0.030
0.005
0.060
Chickpeas
0.090
0.090
0.089
0.380
0.315
0.240
Mustard
0.053
0.051
0.051
0.145
0.160
0.145
Canaryseed
0.015
0.013
0.014
0.160
0.190
0.170
Sunflower
0.067
0.068
0.056
0.145
0.135
0.155
TOTAL
1.245
1.242
1.283
3.210
2.655
3.175