
Key Takeaway:
Water can store a lot of heat (compared to the air), which means the ocean can absorb excess heat from a warming atmosphere. About 90% of the excess heat from planetary warming over the past century has been absorbed by the ocean, causing ocean temperatures to rise. Modern recordkeeping for ocean temperatures began in 1955.
Latest Measurement: December 2024
372 (± 2) zettajoules since 1955
Water has a high heat capacity, which means it can store a lot of heat. The atmosphere has warmed from increased greenhouse gases. About 90% of that excess heat has been absorbed by the ocean. The year 2024 was the ocean’s warmest year on record.
The graph shows the rise in heat for the top 2,000 meters of the ocean since 1955, when modern recordkeeping began, as tracked by NOAA. The shaded blue region indicates the 95% margin of uncertainty. As measurements improved and became more accurate over time, the uncertainty gets smaller. Each data point represents a five-year average. For example, the 2022 value represents the average change in ocean heat content for the years 2020 up to and including 2024 compared to the value in 1955. The data is the latest available, updated annually.
The second graph tracks monthly changes in ocean heat content for the entire water column (from the top to the bottom of the ocean) from 1992 to 2024, integrating observations from satellites, instruments in the ocean, and computer models. NASA’s ECCO model blends data from in-water instruments — including Argo floats, conductivity- temperature-depth profilers (CTDs), and expendable bathythermographs (XBTs) — with satellite data from NASA and its partners.
Both graphs are expressed in zettajoules, a unit used to measure heat. Most of the added heat is stored near the surface, at depths of 0 to 700 meters.
The animation shows the ECCO model in action, depicting sea surface temperatures as ocean currents transport heat around the planet.
In addition to storing heat drawn from the warming atmosphere, water also expands as it heats up. As it expands, it causes the global sea level to rise. This expansion has led to about one third of the global sea level rise over the past century.
Related Missions
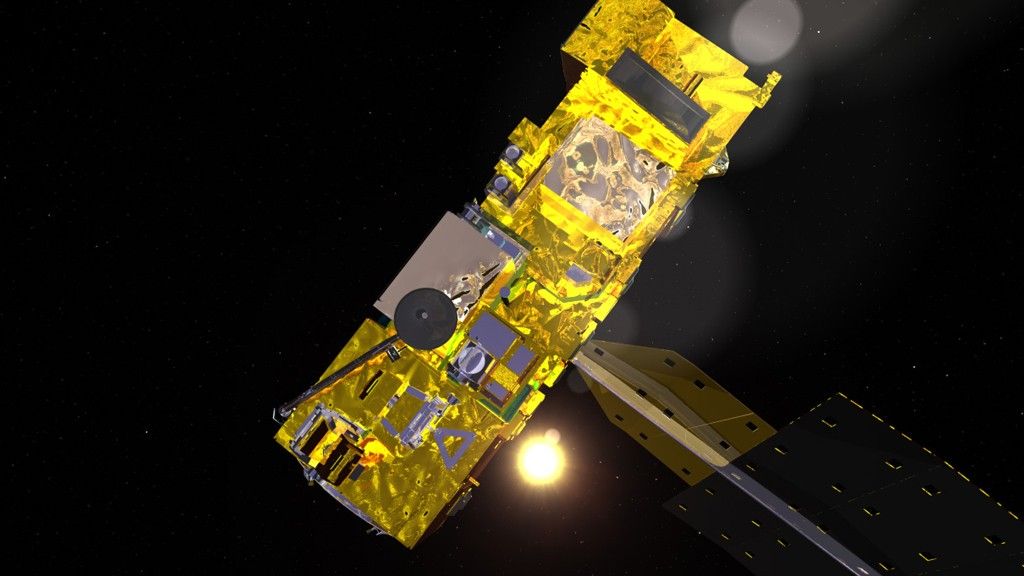
Aqua
Aqua is a NASA Earth Science satellite mission named for the large amount of information that the mission is collecting about the Earth’s water cycle, including evaporation from the oceans, water vapor in the atmosphere, clouds,precipitation, soil moisture, sea ice, land ice, and snow cover on the land and ice.
MODIS
MODIS (or Moderate Resolution Imaging Spectroradiometer) is a key instrument aboard the Terra (originally known as EOS AM-1) and Aqua (originally known as EOS PM-1) satellites.
VIIRS
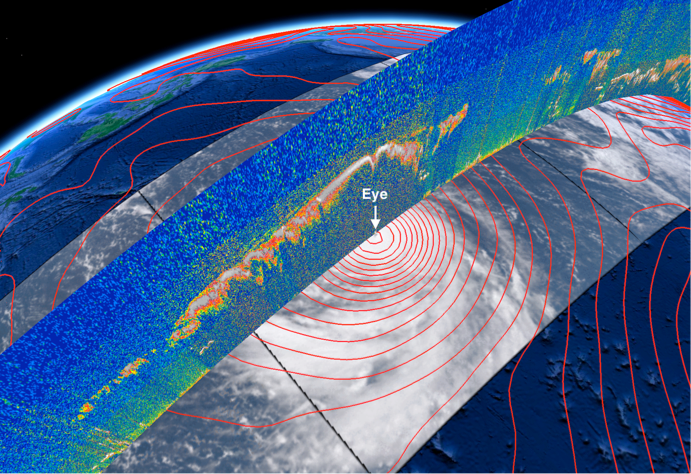
The Visible Infrared Imaging Radiometer Suite (VIIRS) is aboard the joint NASA/NOAA Suomi National Polar-orbiting Partnership (Suomi NPP) and NOAA-platforms. VIIRS collects visible and infrared imagery along with global observations of Earth’s land, atmosphere, cryosphere, and ocean.
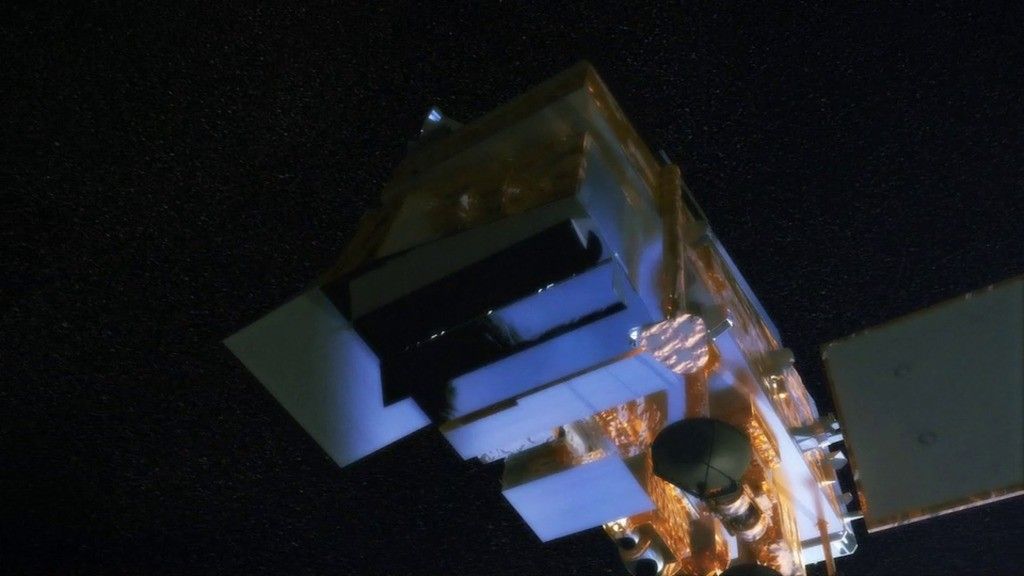
Terra
Terra explores the connections between Earth’s atmosphere, land, snow and ice, ocean, and energy balance to understand Earth’s climate and to map the impact of human activity and natural disasters on communities and ecosystems.
.png)
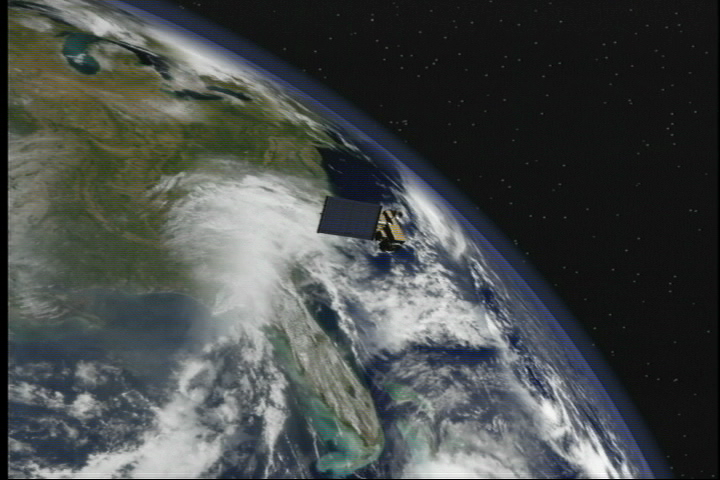
Suomi NPP
The Suomi National Polar-orbiting Partnership (Suomi NPP) is a joint mission to extend key measurements in support of long-term monitoring of climate trends and of global biological productivity.