
The Great Pacific Garbage Patch is usually pictured as a floating landfill, a raft of bottles and bags somewhere between California and Hawaii that a ship could sail up to and photograph. The physical reality is stranger and much thinner than that.
In a 2018 paper in Scientific Reports, Laurent Lebreton and colleagues at The Ocean Cleanup estimated that the patch holds about 79,000 metric tons of floating plastic spread across roughly 1.6 million square kilometers of ocean. Run those two numbers against each other and the average works out to somewhere near 50 kilograms of plastic per square kilometer. The paper’s own figure for concentration is a range of tens to hundreds of kilograms per square kilometer, higher toward the center and fading at the edges, which is why the patch has no real boundary. The 1.6 million square kilometer figure is simply the area inside which concentrations exceed 10 kilograms per square kilometer.
A square kilometer is about 140 soccer fields. The plastic in it weighs roughly what a large dog does.
That is not an argument that the patch does not matter. It is an argument that the mental image most people carry is wrong in a way that changes what the problem actually is.
What the debris turns out to be
The composition is the part that tends to surprise people who follow plastic pollution closely.
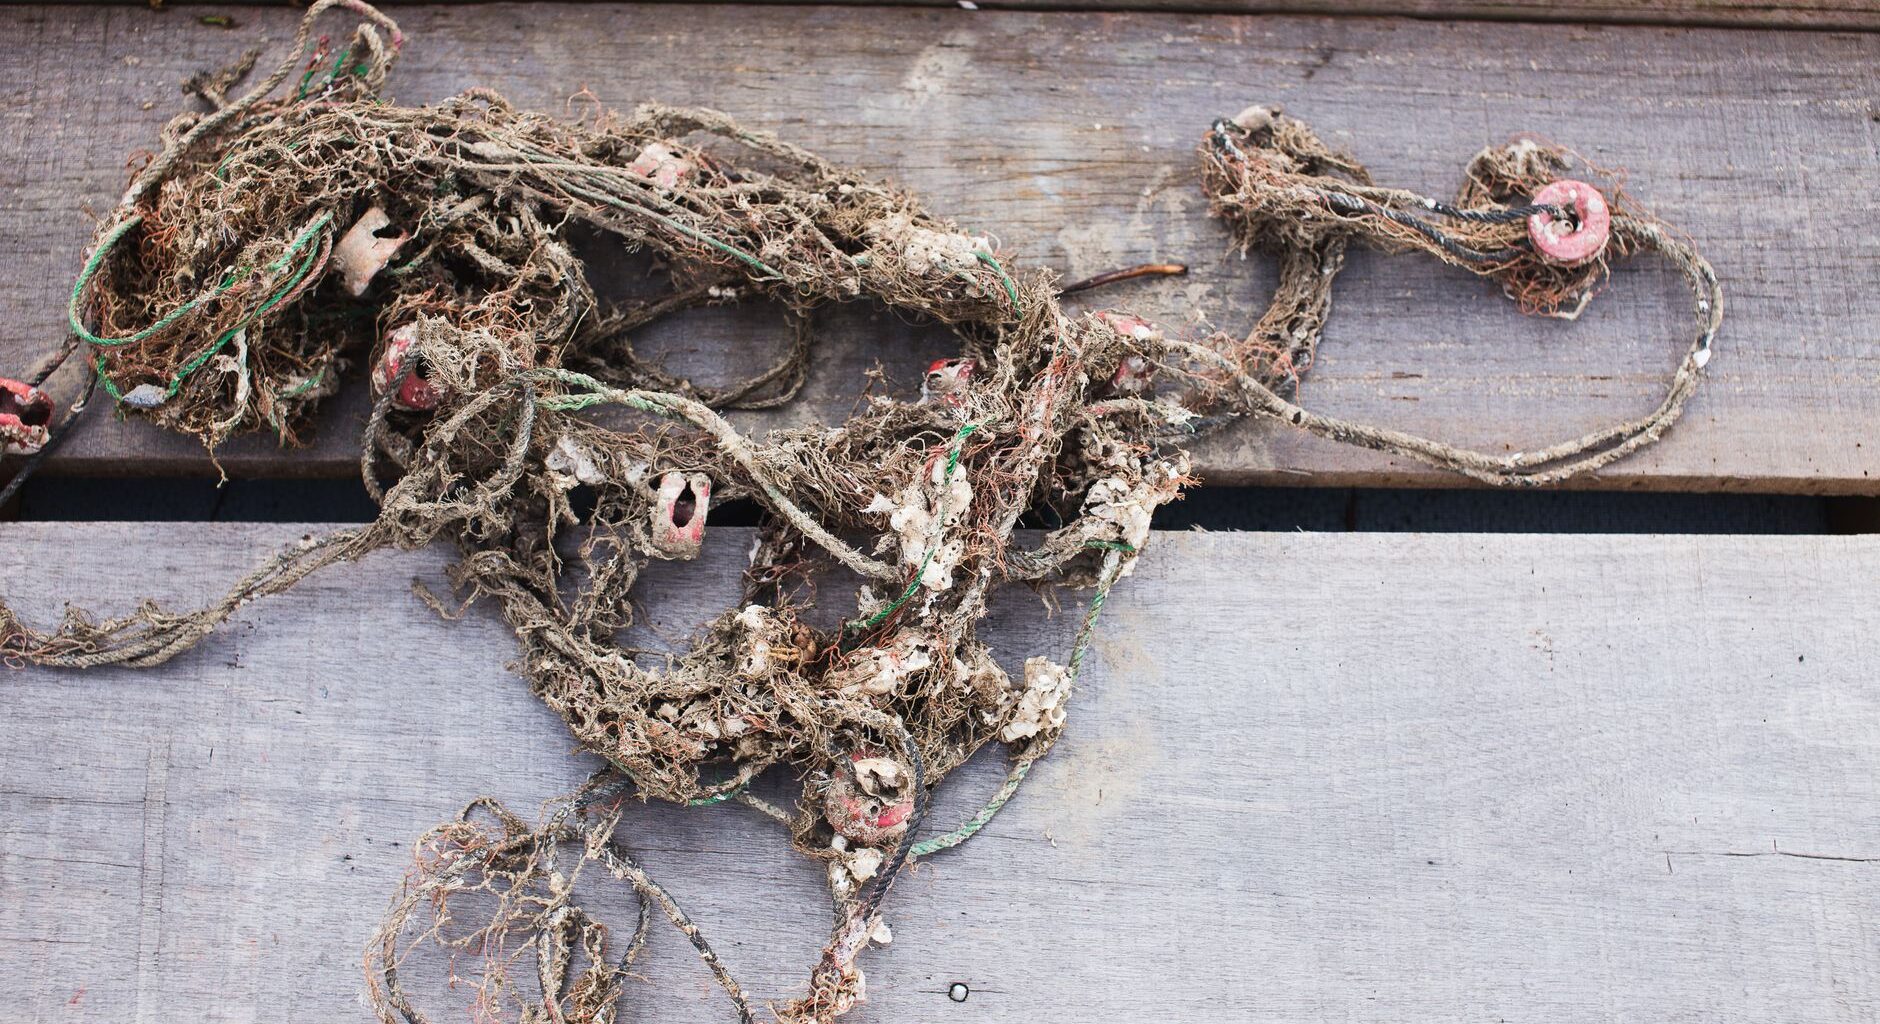
The 2018 analysis found that over three-quarters of the patch’s mass sat in objects larger than 5 centimeters, and that at least 46 percent of the total mass was fishing nets. A 2022 follow-up, also in Scientific Reports and also led by Lebreton, went further. A 2019 expedition retrieved more than 6,000 hard plastic items larger than 5 centimeters, sorted and weighed them, and looked for markings that indicated where they came from. Combining that with the mass already accounted for by nets and ropes, the authors estimated that between 75 and 86 percent of the floating plastic mass larger than 5 centimeters in the North Pacific gyre could be attributed to fishing activity.
Among the items carrying identifiable origin markings, five countries dominated: Japan, China, South Korea, the United States and Taiwan. The authors noted that these are not the countries usually named in assessments of land-based plastic leakage into the ocean. They are major North Pacific fishing nations.
The straws-and-grocery-bags picture is not what is sitting out there. Ropes, nets, floats, crates, buoys and eel traps are.
Where this gets over-applied
The finding travels well, and it travels badly. Read quickly, it becomes “ocean plastic is a fishing industry problem, not a consumer problem,” and that is a conclusion the studies do not support.
Three limits matter. The first is that this describes one gyre. The North Pacific accumulation zone is where buoyant, durable, offshore-generated debris ends up, and gear lost at sea starts much closer to that zone than a bottle dropped in a river 8,000 kilometers away. The second is that it describes what floats and stays large. Most plastic entering the ocean comes from land, and The Ocean Cleanup’s own summary of its work says as much, putting river emissions at 1.15 to 2.41 million metric tons a year and describing them as the main global source. The third is that this is a mass measurement. By piece count the patch is overwhelmingly microplastic: the 2018 paper put microplastics at 8 percent of the mass but 94 percent of an estimated 1.8 trillion fragments.
So the honest version is narrower and less quotable. In this particular accumulation zone, measured by weight, in debris big enough to identify, fishing gear dominates.
Who did the counting
Both papers were peer reviewed and published in Scientific Reports. Both were led by the head of research at The Ocean Cleanup, the Dutch nonprofit that has spent more than a decade raising money to extract plastic from this specific patch.
That is not a reason to discount the work, and no critique we have seen alleges anything improper in the measurements. It is a reason to notice who is characterizing the object they have also proposed to remove. An organization whose case rests on the patch being large, tractable and worth intercepting is the organization that produced the leading estimates of how large it is. Independent replication by a group with no stake in the cleanup would settle more than another paper from the same team.
The finding is worth taking seriously, but it should not be read as the final word. The 2018 mass estimate carries a range of 45,000 to 129,000 metric tons, which is a factor of nearly three between the low and high ends, and the 2022 origin analysis could only assign a country to items that still had legible markings on them. Debris that had weathered past the point of identification was, by definition, excluded from the country attribution.
What the numbers do agree on
Where the evidence is stronger is on direction of travel. A 2024 analysis in Environmental Research Letters examining seven years of survey data from the same region reported that small fragments in the 0.5 to 5 millimeter range have been increasing disproportionately faster than larger floating objects, with extreme local concentrations reaching over 10 million pieces per square kilometer in 2022.
That trend has an uncomfortable implication for cleanup as a strategy. Large objects are the ones a vessel can catch. Fragments are the ones that are multiplying, and they are the ones that are effectively impossible to filter out of open ocean water at scale without also removing the plankton.
Which is the practical reason the composition finding matters. If most of the recoverable mass out there is lost or discarded fishing gear, then gear marking, mandatory reporting of losses, port reception facilities and buy-back schemes are interventions aimed at the actual object, in a way that a plastic straw ban is not. That is a claim about this patch and this class of debris. It is not a ranking of what matters most for ocean plastic overall, and the studies here cannot support one.
What would settle it
The obvious test is whether the pattern holds in the other gyres. The South Pacific, North and South Atlantic and Indian Ocean accumulation zones have all been sampled far less thoroughly than the North Pacific, and their surrounding fishing industries and river systems differ. If fishing gear dominates the floating mass in every one of them, the finding generalizes. If it does not, the North Pacific result stays a North Pacific result, which would itself be useful to know.
Hannah Ritchie at Our World in Data has worked through the same figures and reaches a similar reading of what they do and do not establish.
Until that comparison exists, the accurate sentence is a modest one. In the best-studied patch of floating plastic on Earth, most of what has been weighed came off boats.