
Clinical samples and ethics of study
Sample acquisition: (1) Glioma tissues: 30 cases (25 grade II/III, 5 GBM; WHO 2021 criteria); (2) Normal brain controls: 5 cases obtained during neurosurgical resections for traumatic brain injury or intracerebral hemorrhage. Control tissues were sampled from morphologically normal cortex at least 2 cm away from the lesion margin, confirmed intraoperatively as non-pathological and verified by histopathological examination; (3) Peripheral blood: 25 glioma patients and 20 healthy donors. All glioma blood samples were collected preoperatively in the morning prior to anesthesia induction and before any adjuvant therapy, while control blood samples were obtained from age- and sex-matched healthy donors during routine health check-ups. Serum AFU levels were measured in all blood specimens.
Ethical oversight: Approved by Guilin Medical University, The First Affiliated Hospital IRB (2023YJSLL-78) following Declaration of Helsinki guidelines. Written informed consent preceded sample collection.
Data obtaining and processing
Data Acquisition: (1) GWAS: Brain cancer datasets (ebi-a-GCST90018800, ieu-b-4875, ebi-a-GCST90018580) from OpenGWAS (https://gwas.mrcieu.ac.uk/); (2) TCGA: RNA-seq (TPM), methylation, and clinical data for GBM (n = 168) and LGG (n = 516) from GDC Portal (https://portal.gdc.cancer.gov/); (3) GTEx-TCGA Integration: Paired tumor/normal TPM expression from UCSC Xena (tcga_RSEM_gene_tpm, gtex_RSEM_gene_tpm).
Validation Cohorts: (1) GEO: GSE16011 (n = 284), GSE108474 (n = 550), GSE15824 (n = 45); (2) CGGA: CGGA-301, CGGA-325, CGGA-693; (3) EMBL-EBI: E-MTAB-3892 (n = 179); (4) Proteomics: CPTAC-GBM (PDC000204).
Data Processing: (1) Histological classification followed WHO guidelines; (2) RNA-seq data transformed as log₂(TPM + 1) or standardized per sample: Z = (x—μ)/σ; (3) Outlier removal: |Z|> 3.0.
Genetic co-localization and methylation-expression integration analysis
Bayesian colocalisation was performed using the R package coloc to assess whether glioma GWAS loci and brain eQTL signals share the same causal variants. We analyzed three independent glioma GWAS datasets obtained from OpenGWAS (ebi-a-GCST90018800, ieu-b-4875, ebi-a-GCST90018580; Table S1). eQTL summary statistics were derived from GTEx v8 brain tissues, including cortex, hippocampus, and cerebellum. For each locus, we applied a ± 500 kb window around the lead SNP and used default priors (p1 = 1 × 10⁻4, p2 = 1 × 10⁻4, p12 = 1 × 10⁻5). Linkage disequilibrium (LD) was estimated using the 1000 Genomes Project Phase 3 European reference panel. Significant colocalisation was defined as posterior probability for hypothesis 4 (PP.H4.abf) > 0.8.
Analysis utilized preprocessed Level 3 methylation (450 K array) and RNA-seq data from TCGA. Additional probe filtering was applied: excluding probes with detection p-value > 0.01, on sex chromosomes, or containing SNPs/cross-reactive sites. Batch effects from the plate variable were corrected using ComBat. Processed β-values were then median-aggregated across regulatory regions: promoters (TSS200: 0-200 bp; TSS1500: 200-1500 bp), 5’UTRs, first exons, and enhancers. Spearman correlations linked methylation to log₂(TPM + 1) expression. FUCA1 and FUCA2 expression profiles alongside promoter/enhancer methylation values underwent cohort-wide Z-normalization.Samples were subsequently stratified into four molecularly defined subgroups based on directional deviation from population means: HyperMeth-HighExpr (methylation Z > 0 & expression Z > 0); HyperMeth-LowExpr (methylation Z > 0 & expression Z ≤ 0); HypoMeth-HighExpr (methylation Z ≤ 0 & expression Z > 0); and HypoMeth-LowExpr (methylation Z ≤ 0 & expression Z ≤ 0) subgroups for downstream analyses.
Spatial transcriptome gene localisation and expression
GBM WholeTranscriptomeAnalysis 10 × and UKF241-C-ST datasets were analyzed using 10 × Visium spatial transcriptomics. Cellular composition of each microregion was estimated by reference-based inverse convolution. A single-cell RNA-seq reference atlas was constructed from matched tumor samples after stringent quality control (genes per cell > 500, unique molecular identifiers > 1,000, mitochondrial RNA fraction < 20%), following established best practices. Cell-type signature matrices were derived from the top 25 marker genes per cell type, ranked by log fold-change.
Spatial deconvolution was performed using Cottrazm v1.2.0 (functions get_enrichment_matrix and enrichment_analysis) with the scRNA reference. To minimize batch effects across slides, data were log-normalized using Seurat v4.3.0 (NormalizeData function), and spatial alignment across tissue sections was harmonized according to the Sparkle database annotations. Cell-type distributions were visualized with Seurat’s SpatialFeaturePlot, where gradient intensity reflects relative cellular abundance. Microregions were classified into: (1) Malignant (enrichment score = 1 for malignant cells), (2) Normal (enrichment score = 0 for malignant cells), and (3) Mixed (0 < enrichment score < 1). Pathway activity was quantified with AUCell v1.24.0, where area under the curve (AUC) scores were calculated for each gene set. A threshold of the 75th percentile of AUC distribution within each sample was applied to define pathway-active zones.To assess robustness, we performed sensitivity analyses by varying the number of marker genes (20 vs. 30 per cell type) and altering QC thresholds. The results were highly consistent (Pearson’s r > 0.9 for enrichment scores), supporting the stability of our findings. Expression heatmaps were generated with pheatmap v1.0.12.
Single-cell transcriptomic profiling
Single-cell RNA-seq data from 28 glioblastoma samples [15] (20 adult, 8 pediatric; GSE131928, Neftel et al., Cell 2019) were analyzed using TISCH2 [16, 17]. After quality control (7,930 cells retained; median 5,730 genes/cell), FUCA1/FUCA2 expression patterns were visualized via UMAP dimensionality reduction. Cells were defined as FUCA1⁺ or FUCA2⁺ if log-normalized expression values were greater than zero, and FUCA1⁻ or FUCA2⁻ otherwise. Cellular composition differences between subgroups were quantified across annotated cell types. Pathway activity was assessed using AUCell, scoring 6 functional categories: Immune response.
Metabolic processes; Signaling cascades; Proliferation pathways; Cell death mechanisms; Mitochondrial function. Differential pathway enrichment between positive or negative cells was evaluated via limma with Benjamini–Hochberg correction (FDR < 0.05). CellChat was implemented to reconstruct intercellular communication networks altered by FUCA1 and FUCA2 status [18].
Correlation analysis of clinical traits, prognosis and diagnosis
Clinical trait associations were interrogated using Biomarker Exploration for Solid Tumors (BEST) [19]. We implemented a tiered survival analysis framework: first, univariate Cox regression identified candidate prognostic variables (retention threshold: P < 0.1), which were subsequently incorporated into multivariate Cox models using the survival package. Kaplan–Meier curves were generated to visualize survival distributions across molecular subgroups, with statistical significance assessed via log-rank testing (survfit function).
After Z-normalization of FUCA1 and FUCA2 expression, samples were stratified into four combinatorial subgroups based on directional deviation from cohort means: FUCA1⁺/FUCA2⁺ (Z > 0 both), FUCA1⁻/FUCA2⁺ (FUCA1 Z ≤ 0 & FUCA2 Z > 0), FUCA1⁻/FUCA2⁻ (Z ≤ 0 both), and FUCA1⁺/FUCA2⁻ (FUCA1 Z > 0 & FUCA2 Z ≤ 0). Survival differences were evaluated through pairwise subgroup comparisons and omnibus testing.
Prognostic hazard ratios underwent inverse-variance meta-analysis (Meta package) using log(HR) as the effect measure. Diagnostic performance was quantified through receiver operating characteristic (ROC) analysis (pROC package), reporting area under the curve (AUC) with 95% confidence intervals. Smoothed ROC curves were generated to evaluate tumor versus normal classification accuracy.
Tumor immune microenvironment characterization
To delineate relationships between cellular composition and gene expression in LGG, we applied consensus deconvolution algorithms (xCell, TIMER, EPIC) to estimate immune cell abundances. Scatter plots visualized Spearman correlations between FUCA1/FUCA2 expression and immune cell infiltration levels. Samples were dichotomized into high/low expression groups using median FUCA1/FUCA2 thresholds. Immune cell abundance differences between groups were assessed via Wilcoxon rank-sum tests across all algorithms, with results visualized in gradient heatmaps (red = high abundance; samples ordered by ascending gene expression).
Further stratification divided patients into expression quartiles (Q1: highest 25%; Q4: lowest 25%). Pathway activity scores were calculated using: Thorsson’s method (mean pathway scores per quartile): Heatmaps (pheatmap) compared pathway activities across quartiles. Wilcoxon tests identified differential pathway enrichment between median-based expression groups [20, 21]; PROGENy (easier package; 14 cancer pathways including MAPK/NF-κB) [22].
To further evaluate tumor immune-related epigenetic features, methylation-derived tumor-infiltrating lymphocyte (MeTIL) scores were calculated [23]. Briefly, principal component analysis (PCA) was applied to the methylation values of MeTIL markers, and the first principal component was extracted to generate MeTIL scores. Data were standardized into unit-free Z-scores using (x − μ)/σ transformation. Samples were then divided into high and low FUCA1/FUCA2 expression groups according to median values, and statistical differences in MeTIL scores between groups were assessed using Wilcoxon rank-sum tests.
α-L-fucosidase-related gene signature (AFURGS) enrichment analysis
Using TCGA-LGG data, we identified α-L-fucosidase-related genes (AFURGS) through integrated differential expression and co-expression profiling. Differentially expressed genes (DEGs) were defined by comparing FUCA1/FUCA2 high- versus low-expression groups (thresholds: |log₂FC|> 1.5 and Benjamini-Hochberg (BH) adjusted P < 0.05). Correlated genes (RGs) were identified via Spearman analysis between FUCA1/FUCA2 and all other genes using a dual threshold of |r|> 0.6 and BH adjusted P < 0.05. The robustness of the correlation filter was confirmed through bootstrap resampling. The intersection of DEGs and RGs yielded 71 AFURGS for functional characterization. Gene ontology (GO) and KEGG pathway enrichment analyses were performed using clusterProfiler after identifier conversion (org.Hs.eg.db). Gene Set Enrichment Analysis (GSEA) was conducted on full DEG sets for FUCA1 and FUCA2 separately, utilizing the ‘c2.cp.all.v2022.1.Hs.symbols’ gene set (MSigDB) and computed with GSVA. Pathway enrichment significance was established at BH adjusted P < 0.05.
α-L-fucosidase risk signature (AFURS) construction and validation
To establish a robust prognostic model for glioma, we developed a risk signature termed AFURS (α-L-Fucosidase Risk Score) through a structured feature selection pipeline [24]. Candidate variables were first filtered by univariate Cox regression (p < 0.05) and subsequently refined using Least Absolute Shrinkage and Selection Operator (LASSO) Cox regression with tenfold cross-validation to determine the optimal penalty parameter (λ-min). This process identified a parsimonious set of four genes, which were used to construct the final multivariate Cox model. The AFURS for each patient was calculated as: (0.126 × STEAP3) + (0.238 × TNFSF14) + (0.341 × EMP3) + (0.411 × RAB42). Patients were stratified into low- and high-risk groups based on the median AFURS value from the TCGA LGG + GBM training cohort (n = 658;Exclude patients with an excessively short or absent survival time). The model’s performance was rigorously evaluated. We performed sufficient external validation in independent CGGA datasets (CGGA-325, CGGA-693) using Kaplan–Meier analysis (log-rank test) and time-dependent ROC curves.
Immunotherapeutic relevance was evaluated using tumor immunophenotype scores from The Cancer Immunome Atlas (TCIA). Predictive efficacy was validated in two immunotherapy cohorts: IMvigor210 [25]: advanced urothelial carcinoma treated with anti-PD-L1 (atezolizumab); GSE100797 [26]: melanoma receiving adoptive T-cell therapy (ACT). Spatial transcriptomic validation was performed using 10 × Visium data (GBM WholeTranscriptomeAnalysis). Area under the curve (AUC) scores for AFURS were calculated across microregions, with Spearman correlations assessing relationships between AUC and tumor microenvironment components.
Screening of potential targeted drugs
Given the blood–brain barrier’s exclusion of large-molecule therapeutics in glioma, we employed Connectivity Map (cMAP) analysis to identify small-molecule inhibitors counteracting FUCA1/FUCA2-mediated oncogenicity. Gene signatures were constructed for FUCA1 and FUCA2 across GBM and LGG cohorts by identifying the top 150 upregulated and 150 downregulated genes (P < 0.001) in high- versus low-expression subgroups. Using the XSum (eXtreme Sum) feature-matching algorithm, these signatures were compared against 1,288 compound profiles in CMAP_gene_signatures.RData to compute perturbation similarity scores. Compounds with negative enrichment scores (indicating reversal of oncogenic signatures) were prioritized as potential therapeutics, following established computational pharmacology frameworks [27, 28].
Cell Culture and transfection
Human glioma cell lines (SHG44, LN229, U251) and normal glial cells (HEB) from Chinese Academy of Sciences were cultured in DMEM (10% FBS, 1% penicillin/streptomycin). Cells were transfected with FUCA1/FUCA2-targeting siRNAs or non-targeting negative controls (Gemma Genetics, Table S2) using Lipofectamine 2000 for 12 h prior to functional assays. All cell-based experiments were independently repeated at least three times, with each assay performed in triplicate. Negative control groups (non-targeting siRNA) and untreated baseline controls were included in parallel for all assays.
Molecular validation
RNA/protein were extracted 48 h post-transfection. RT-qPCR used SYBR Green Master Mix (Vazyme). Western blotting employed: 10% SDS-PAGE separation, PVDF membrane transfer, and overnight incubation at 4 °C with primary antibodies: FUCA1 (Proteintech 16,420–1-AP, 1:1000), FUCA2 (15,157–1-AP, 1:1000), β-actin (66,009–1-Ig, 1:20,000). HRP-conjugated secondaries were incubated 2 h at RT.
Functional assays
Proliferation: CCK-8 assays (Bio-sharp) measured OD450 at 0/24/48/72 h in 96-well plates (3,000 cells/well).
Clonogenicity: 2,000 cells/well were fixed (4% PFA) and stained (1% crystal violet) after 14 d; colonies > 50 cells counted.
Migration: (1) Transwell: 4 × 10⁴ cells in serum-free upper chamber vs 10% FBS lower chamber; migrated cells counted after 48 h. (2) Wound healing: Scratches created with pipette tip; closure quantified at 0/24 h with ImageJ.
Cell cycle and apoptosis
EDTA-free trypsinized SHG44/U251 cells were washed in cold PBS, stained with Annexin V-FITC/PI in binding buffer (37 °C, 25 min dark), and analyzed within 1 h using BD FACSVerse. Data processed with FlowJo v7.6.1.
Serum α-L-fucosidase levels
Serum AFU activity was measured using the p-nitrophenyl-α-L-fucopyranoside (CNFP) substrate method (Gcell, Beijing, China) on a Roche Cobas C8000 automated biochemical analyzer, with results expressed in U/L. The assay demonstrated a limit of detection (LoD) of 0.5 U/L and a limit of quantification (LoQ) of 1.0 U/L, with a linear range of 1.0–100.0 U/L. According to the manufacturer’s reference interval, serum AFU values ≤ 25.0 U/L were considered within the normal range for healthy adults. Quality control was performed using two levels of commercial QC sera, with within-run coefficients of variation (CVs) < 5% and between-run CVs < 10%, ensuring assay precision.
Immunohistochemistry
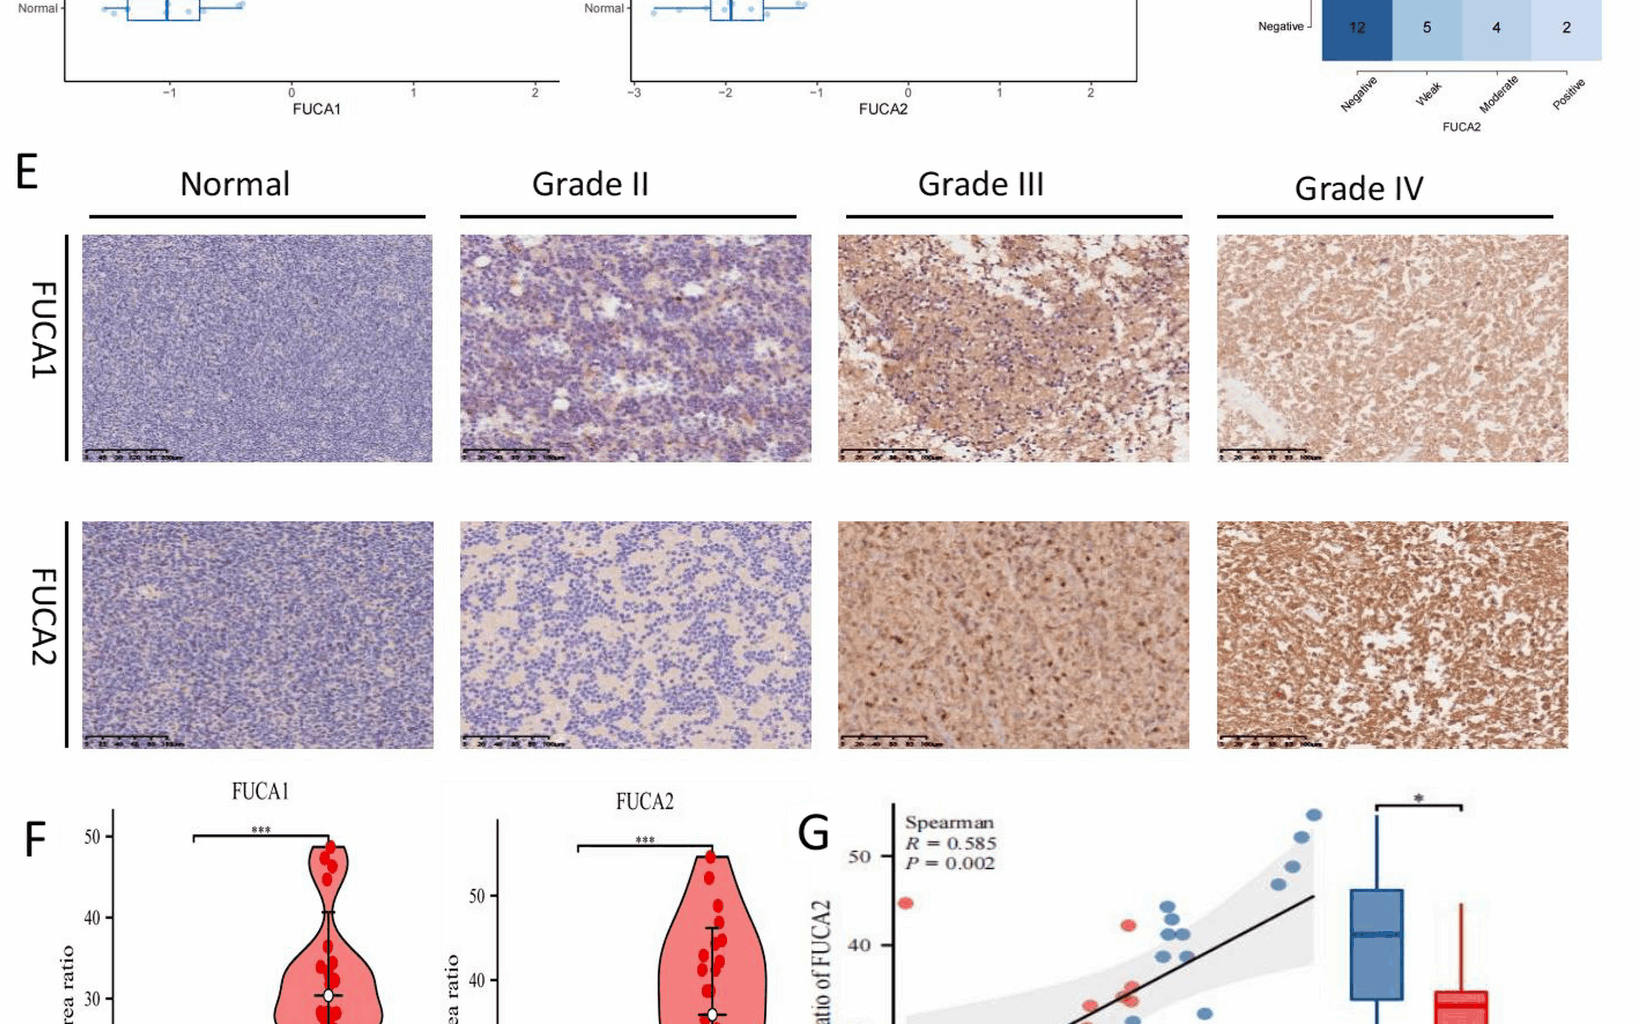
Human tissue experiments were approved by the Ethics Committee of Guilin Medical University The First Affiliated Hospital (2023YJSLL-78) following Declaration of Helsinki principles. Paraffin sections underwent dewaxing in xylene/alcohol gradients, antigen retrieval in EDTA buffer (pH 9.0) at 95 °C for 20 min in a pressure cooker, then cooled to room temperature, and peroxidase blocking with hydrogen peroxide. Primary antibodies included: FUCA1 (Proteintech 16,420–1-AP), FUCA2 (Proteintech 15,157–1-AP), CD68 (MXB Kit-0026), CD163 (MXB MAB-0869), BCL-2 (MXB MAB-0711), and IDH1 (MXB MAB-0733). After 1-h primary and 15-min secondary incubations with PBS washes, staining was developed with DAB and counterstained with hematoxylin. Tonsil tissue was used as a positive control for FUCA1/FUCA2, while sections processed without primary antibody served as negative controls. Regions of interest (ROIs) were selected by two independent pathologists blinded to clinical information, focusing on tumor-dense areas and excluding necrosis or hemorrhage. Inter-rater agreement for semiquantitative scoring was high (Cohen’s κ = 0.87).
Quantitative analysis used ImageJ to calculate integrated optical density/area ratios. Semiquantitative scoring combined: Intensity: 0 (blue), 1 (brown), 2 (tan); Positive cells: 1 (0–10%), 2 (11–30%), 3 (31–50%), 4 (> 50%). A combined score > 4 defined positivity. Ki-67 labeling index was calculated as the percentage of positive nuclei in 500 tumor cells.
Statistical analysis
All statistical analyses were performed using R v4.0.1 and SPSS v27.0. The normality of data distribution was evaluated with the Kolmogorov–Smirnov test. For normally distributed continuous variables, comparisons between two groups were conducted using Student’s t-tests, while non-normally distributed data were analyzed with Mann–Whitney U tests; multi-group comparisons were performed with Kruskal–Wallis tests, followed by pairwise contrasts corrected using the Benjamini–Hochberg procedure. Categorical variables were assessed by χ2 or Fisher’s exact tests. Survival analyses were carried out using Kaplan–Meier curves with log-rank tests, as well as univariate and multivariate Cox proportional hazards models, and hazard ratios were further combined by inverse-variance meta-analysis. For pathway and single-cell analyses, enrichment and activity scores were evaluated with limma or Wilcoxon rank-sum tests, with false discovery rate (FDR) control by the Benjamini–Hochberg method. Prognostic and diagnostic performance was assessed through receiver operating characteristic (ROC) analysis using the pROC package, and the AFURS model was established via LASSO Cox regression with tenfold cross-validation. All cell-based assays were independently repeated at least three times with triplicate wells, and included non-targeting siRNA as negative controls. Statistical significance was defined as P < 0.05, with P < 0.01 and P < 0.001 considered highly and extremely significant, respectively; the corresponding statistical tests and comparison groups are specified in figure legends.