
High harmonic spectra of atomically thin and bulk semiconductors
The experiments are carried out on monolayer WS2 and MoS2 transition metal dichalcogenides (TMDs) to avoid the influence of linear and nonlinear propagation effects. Further, we compare the results of atomically thin semiconductors to HHG obtained from a bulk polycrystalline CdSe thin film. TMD monolayers were obtained by mechanical exfoliation and transferred onto a c-cut sapphire substrate (see Supplementary Information Section 1). The bulk, polycrystalline, 140 nm thick, wurtzite symmetry CdSe film was prepared directly on the sapphire substrate via chemical bath deposition. We excite the samples with intense (up to 1.5 TW/cm2) femtosecond mid-IR pulses at different wavelengths in the range λ = 3–5 µm and measure high-order harmonic spectra within the 0.2–1 µm spectral region at a constant laser intensity (see “Methods” and Supplementary Information Section 2). In our analysis, we focus on harmonics with photon energies larger than the electronic bandgap, i.e., those that are generated predominantly by the interband mechanism.
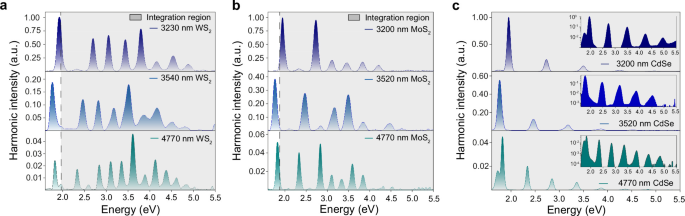
Figure 1 shows selected high harmonic spectra obtained from two different TMD monolayers (WS2, a, and MoS2, b), oriented along the zigzag direction relative to the laser polarization, and from the CdSe film (c) at a peak intensity of approximately 1.5 TW/cm2. In TMD monolayers, for symmetry reasons, both even and odd harmonics are generated up to 5 eV, and the spectra exhibit a clear plateau behavior with a cut-off near 4 eV. In contrast, harmonic spectra measured from the bulk CdSe contain only odd orders, and the intensities exponentially decay with increasing harmonic order. This can be explained by strong re-absorption of photons with energies above the bandgap (1.64 eV) of the material39. Note that for a thickness of 140 nm, CdSe film dispersion effects like phase and group velocity mismatch are negligible in the entire spectral range of harmonic measurements.
Fig. 1: Wavelength dependence in solid-state HHG.
HHG spectra on linear scale, corrected to the spectrometer and the detector sensitivity, for three selected laser wavelengths from a WS2 along the zigzag direction, b MoS2 along the zigzag direction and c CdSe polycrystalline film. The inset figures are the same, but in logarithmic scale for better visibility. The shaded area on all figures marks harmonics with energies of quanta above the bandgap (dashed line) and represents the integration region for the harmonic yield. Note the different y-axis range for the different driving wavelength, indicating the reduced harmonic yield for longer driving wavelengths.
Experimental wavelength dependence
Figure 2 displays the experimentally retrieved wavelength dependence of the integral harmonic yield, measured at different pump laser wavelengths but at a fixed laser intensity of 1.45 TW/cm2 (for details on the intensity calibration, see Supplementary Information Section 2.2). In our analysis, we focus on harmonics with photon energies larger than the electronic bandgap, i.e., those generated predominantly by the interband mechanism. We define the HHG yield as the detector- and grating-corrected spectral intensity integrated, in the frequency domain, over this spectral range within the experimentally accessible window indicated by the shaded area in Fig. 1. The same integration window is used in the comparison with numerical simulations. The presentation on a double logarithmic scale allows convenient fitting of a power-law decay λ-x with a linear function, characterizing the power index × of its decay by the value of the slope. For monolayer WS2 (Fig. 2a), we find values of the power index of −8.9 ± 1 and 8.2 ± 0.9 along the zigzag and armchair directions, respectively. Similarly, Fig. 2b shows the wavelength dependence of the total HHG yield from a MoS2 monolayer along the zigzag and armchair directions and from the CdSe film, with retrieved indices −6.6 ± 2 (MoS2 zigzag) and −6.2 ± 1.4 (both MoS2 (armchair) and CdSe). The power indices are only weakly dependent on the laser intensity, remaining almost unaffected (<10%) when the latter is changed by more than 70% (Fig. 2c). Note that in all cases, the harmonic yield does not decay monotonically but shows an oscillatory behavior instead. Similar oscillations have been numerically found before and were assigned to quantum path interferences34. In general, the experimentally retrieved power index is significantly larger than the theoretically proposed \({\lambda }^{-4}\) dependence expected assuming an infinite dephasing time (no dephasing processes)34.
Fig. 2: Wavelength dependence of the high harmonic yield.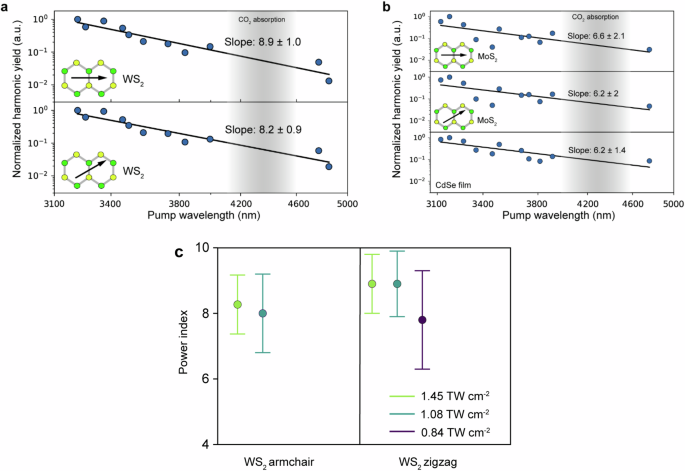
a Normalised harmonic yield (blue dots) as a function of the pump wavelength plotted in a double logarithmic scale from a monolayer WS2 along the zigzag (top figure) and the armchair (bottom figure) directions. b The same for MoS2, top figure along the zigzag direction, middle along the armchair and bottom for CdSe film. The values represent the integrated harmonic yield in the spectral region above the bandgap (marked in Fig. 1). The black line shows a linear fit and the absolute values of the slopes are shown. The shaded grey area represents the CO2 absorption region, where measurements are not possible under ambient conditions. The laser intensity was fixed to 1.45 TW/cm2. c Experimentally measured dependence of the power index in the wavelength-dependent decay of the harmonic yield on the driving laser intensity, for two different crystal orientations of WS2. The error bars indicate slope fitting error.
Benchmark against no dephasing or constant dephasing models
To elucidate the impact of the dephasing time in HHG of solids, we conducted (i) ab-initio real-time time- dependent density functional (rt-TDDFT) calculations of HHG in a WS2 monolayer and (ii) numerically solved the two-dimensional semiconductor Bloch equations (SBE) with infinite dephasing time (see “Methods” and Supplementary Information Section 4 for details). The results of the simulations are shown in Fig. 3a, b. The results of SBE simulations are in excellent agreement with the results of rt-TDDFT calculations yielding a \({\lambda }^{-3.4}\) dependence (\({\lambda }^{-3.3}\) dependence in rt-TDDFT calculations) and strong oscillations. However, both simulations did not include the dephasing time explicitly and failed to reproduce the much steeper experimentally measured dependence of the harmonic yield on the driving wavelength.
Fig. 3: Summary of the numerical simulations with infinite and a finite constant dephasing.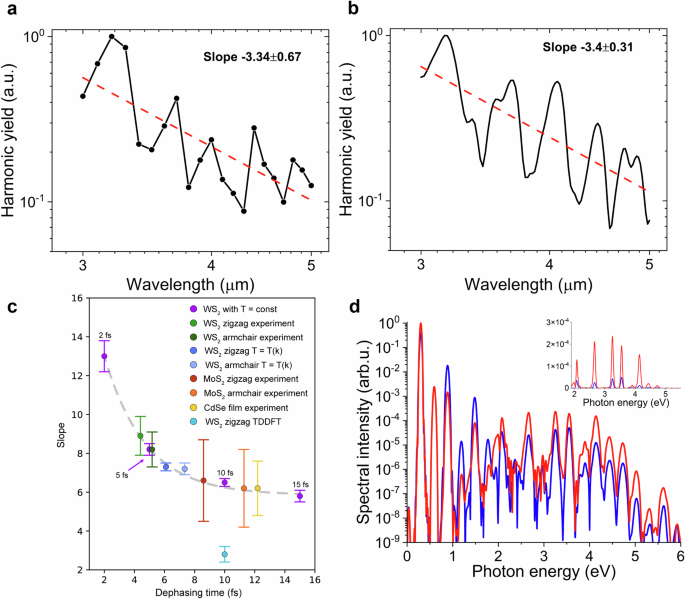
a rt-TDDFT and b 2D SBE numerical simulations without dephasing. The red line shows a fit with a power index given in the figure. Note the double log scale of the axes. c Summary of numerical calculations with constant dephasing time (magenta points). The dashed line shows the exponential fit. The slope values retrieved from the experimental measurements (green, dark green, red, yellow and orange points) and k-dependent simulations (blue and light blue points) are superimposed with constant dephasing time calculations for comparison. The error bars represent the error in fitting procedure. d Comparison of HHG spectra from 2D SBE numerical simulations with the best-to-experiment fit constant dephasing time T2 = 5 fs (blue curve) and \({T}_{2}({{\boldsymbol{k}}})\) (red line) for laser polarization oriented along armchair direction. The inset is for the spectral range measured in the experiments and plotted in linear scale.
We also compared the experimental wavelength scaling to SBE simulations using a momentum-independent dephasing time, as commonly assumed in phenomenological descriptions of solid-state HHG. The cumulative results are shown in Fig. 3c. Consistent with previous work34, we find that the retrieved wavelength-scaling exponent depends strongly on the chosen constant value of \({T}_{2}\), and the dependence of the slope upon the value of the dephasing time can be well approximated (R-square is 0.9987) by the exponential function \({{{\rm{e}}}}^{-\tau /\triangle \tau }\) with the decrement \(\triangle \tau \approx 2.76\pm 0.29\) (the dashed line in Fig. 3c). Thus, a suitably tuned constant \({T}_{2}\) can reproduce selected observables phenomenologically. However, it does not provide a microscopic explanation for why such ultrashort dephasing is required. Moreover, the value should be empirically adjusted not only for every material but also depending on the crystal orientation. By contrast, the momentum-dependent dephasing time \({T}_{2}\left(k\right)\) that we introduce later follows directly from the calculated scattering landscape and reproduces the observed scaling without invoking an ad hoc fitting parameter for each driving condition and material. This comparison shows that the main advance of the present work is not simply an improved fit, but a physically grounded interpretation of the effective HHG dephasing in terms of momentum-resolved scattering.
Finally, we compare the spectral shape and cutoff behavior in the harmonic spectrum for different laser wavelengths for \({T}_{2}\) = 5 fs (the constant dephasing value providing the best match for the wavelength dependence in the harmonic yield) and k-dependent \({{{\rm{T}}}}_{2}({{\bf{k}}})\). The exemplary spectra for 4.2 µm laser wavelength are shown in Fig. 3d. Briefly, we observe that the cutoff position remains roughly the same for both models of the dephasing. However, very short dephasing time values (roughly below 10 fs) result in strong suppression of the plateau structure at long driving wavelengths. In Fig. 3d, the cutoff harmonic’s intensity is two orders of magnitude lower than the intensity of the 5th harmonic, the last harmonic with the energy of quanta below the bandgap. This strong plateau suppression at long wavelengths was not observed in our experiments; the 5th harmonic remains comparable or even weaker than the plateau harmonics. Also, the plateau suppression in numerical simulations with very short dephasing times was reported before and was argued as a strong indication that dephasing times below 10 fs result in the wrong structure of solid HHG spectra and propagation effects should be carefully taken into account instead40.
Scattering processes and k-dependent dephasing time
To identify the physical origin of ultrafast dephasing, we recapitulate possible scattering processes occurring in solids: (i) The first collisional process, carrier multiplication, is much more efficient in 2D materials than in bulk semiconductors due to quantum confinement41,42,43. However, this process becomes efficient only if the excited electron has an excess energy equal or larger than the bandgap (i.e., a total energy larger than twice the bandgap), which is possible by single or several photon absorption from a light source with large photon energy. Under the conditions of strong-field excitation with photon energies much smaller than the bandgap, as it is realized in our experiments, the electron tunnels to the bottom of the conduction band, making carrier multiplication in TMDs inefficient and, thus, negligible. This was confirmed in experiments on transport phenomena under DC voltage where the carrier multiplication was identified primarily due to the carrier contribution from trap defects states44,45.
The second scattering process that can contribute to the dephasing in HHG is electron-electron scattering (ii). Electron-electron scattering depends sensitively on the number of excited carriers. Thus, if it were the dominant contribution for our experimental conditions, a substantial increase in the excited carrier density with laser intensity would be expected to modify the wavelength-scaling exponent significantly. Recent experiments on the influence of photodoping on HHG in 2D materials have shown that, under conditions of high density of the excited carriers, when screening effects can be neglected and electron-electron collisions play the major role, the dephasing time scales with the electron density as \(\sim 1/{N}_{e}\)36. Based on the Keldysh strong-field excitation rate in semiconductors46,47, we estimate that the carrier density increases by up to approximately one order of magnitude over the investigated intensity range. According to our numerical simulations and results from ref. 34, such a variation would be expected to induce a pronounced change in the effective dephasing time and hence in the scaling exponent. Experimentally, however, the extracted exponent changes by less than 10% when the laser intensity is varied by more than 70% (Fig. 2c). We therefore conclude that, under the excitation conditions studied here, carrier–carrier scattering is not the dominant contribution to the dephasing responsible for the steep wavelength scaling. This does not exclude a stronger role of carrier–carrier scattering at substantially higher excited-carrier densities, for example, in photo-doped35,36,37 or more strongly driven regimes.
Finally, we consider the contribution of electron-phonon scattering (e-ph scattering, iii). Using DFT methods, we calculate the total (summed over all phonon modes) band-specific electron-phonon scattering time in WS2 (see Supplementary Information Section 3 for details). From the band-specific scattering times, we introduce the k-dependent polarization dephasing time \({T}_{2,{mn}}\left({{\boldsymbol{k}}}\right)\) between two bands \(m\) and \(n\) as \(\frac{1}{{T}_{2,{mn}}({{\boldsymbol{k}}})}=\frac{1}{2}\left(\frac{1}{{{{\rm{\tau }}}}_{m}({{\boldsymbol{k}}})}+\frac{1}{{{{\rm{\tau }}}}_{n}({{\boldsymbol{k}}})}\right)\). The corresponding dephasing time \({T}_{2}\left({{\boldsymbol{k}}}\right)\) between the valence and the first conduction bands is shown in Fig. 4a. The striking feature of the dephasing time is its pronounced dependence on the electron lattice momentum. At the excitation point in the K-valley (or K′-valley), it is about 70 fs and drops abruptly to below 10 fs as soon as the electron leaves the valley and reduces to ≈4 fs in the vicinity of the Γ-point (Fig. 4a). This dephasing time enters the two-dimensional SBE (see “Methods” and Supplementary Information Section 4 for details) to simulate HHG. Figure 4b displays such calculated wavelength dependence of the harmonic yield for the laser pulse parameters and the spectral integration range used in the experiments. The retrieved slope of 7.3 ± 0.2 (7.2 ± 0.4) for the zigzag (armchair) orientation agrees rather well with the values retrieved from the experimental measurements. The remaining mismatch between experimental and simulated slope values likely reflects several factors. First, as shown previously34 and confirmed by our simulations (Fig. 3c), the wavelength scaling exponent is highly sensitive to the precise magnitude of the dephasing time. Second, the electron–phonon scattering rates used here are evaluated within a field-free perturbative framework. Under strong driving, dynamically dressed bands, nonthermal carrier distributions, and additional many-body channels may renormalize the effective scattering and dephasing rates. Noteworthy, the simulations based on the k-dependent scattering rates at higher lattice temperature (473 °K in Fig. 4c) essentially reproduce the experimentally determined slope value, suggesting that indeed nonthermal or some effective hot carrier distribution can change the scattering rates significantly. The present treatment should therefore be viewed as a first-principles-informed effective description for the experimentally studied regime. Its success in reproducing the measured trends nevertheless indicates that momentum-resolved electron–phonon scattering captures the leading contribution to ultrafast dephasing under these conditions.
Fig. 4: Numerical simulations for the k-dependent electron-phonon scattering time.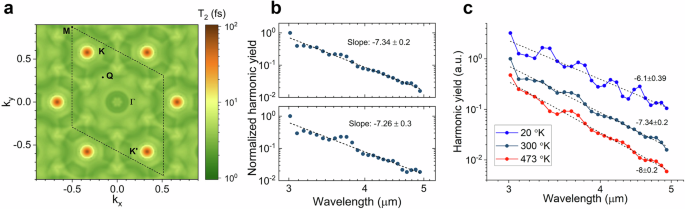
a Two-dimensional map of the dephasing time between the first conduction band and the valence band, calculated for the 300 °K temperature. Note the logarithmic scale for the false colour, showing the scattering time. The short-dashed line marks the borders of the Brillouin zone. Also, high symmetry points are marked. b Normalised harmonic yield as a function of the pump wavelength for the zigzag (top figure) and the armchair orientations (bottom figure), calculated by SBE with T2 = T2(k) shown in a. c Wavelength dependence of the harmonic yield for different lattice temperatures. The dotted lines are the linear fits with the slopes marked in the figure.
The numerical simulations also reproduce the oscillations in the dependence of the harmonic yield on the driving wavelength (Fig. 4b,c). These oscillations were attributed before to quantum path interference for HHG in gases48 and solids34. Detailed investigation of these oscillations is the subject of separate work. Here, we would like to note that the amplitude of the oscillations is directly linked to the value of the dephasing time: Larger values of the dephasing time result in increased amplitudes of the oscillations. Therefore, the modulation amplitude might be used as well as an indicator of the dephasing process’ timescales.
The identified origin of the dephasing as e-ph scattering suggests that the dephasing time might be temperature-dependent. Indeed, numerical simulations performed for a lattice temperature of 20 ˚K predict that the scattering time increases in the K (K’) valley up to 1 ps and by a factor 2-3 across the band, remaining ≈3 fs near the Γ- point (see Supplementary Fig. 6). The calculated scattering time at low temperatures suggests that the processes of phonon emission in electron-lattice collisions play the dominant role. Also, the increased values at low temperatures predict a significant increase in the harmonic yield. This is indeed confirmed by the numerical simulations, showing a reduction in the power index and up to one order of magnitude increase of the harmonic yield at long wavelengths (Fig. 4c). Noteworthy, also the amplitude of the oscillations increases significantly, mirroring longer dephasing times. Thus, our simulations suggest a possibility for a direct experimental determination of the contributions of the electron-electron and electron-phonon scatterings by conducting wavelength- and temperature-dependent HHG measurements for different laser intensities. Remarkably, a very recent publication on temperature-dependent measurements of HHG in crystalline silicon confirms our predictions, demonstrating a strong increase in harmonic yield at low temperatures for a fixed driving wavelength and explaining it by electron-phonon contribution to the dephasing processes49.
The calculated scattering times reveal a strong dichotomy between near-edge and strongly displaced states in momentum space. Near the band extrema, the scattering time remains on the order of 100 fs, whereas carriers driven away from these regions encounter scattering times below 10 fs and, in parts of the Brillouin zone, only a few femtoseconds. The HHG-relevant coherence time is therefore not only a single material constant but an effective trajectory-dependent average over the regions of momentum space sampled during the strong-field motion. In this sense, the few-femtosecond dephasing commonly required in HHG simulations emerges naturally from the underlying momentum-resolved scattering landscape. To demonstrate this, we performed a trajectory- resolved analysis of the dephasing time for a monochromatic driving laser field. There, the electron trajectory in the conduction band is \({{\boldsymbol{k}}}\left(\varphi \right)={{{\boldsymbol{k}}}}_{0}+\frac{e{{{\boldsymbol{E}}}}_{0}}{\hslash \omega }\left(\cos \varphi -\cos {\varphi }_{0}\right)\) where \({{{\boldsymbol{k}}}}_{0}\) is the initial lattice momentum of the electron at the K-point, \({{{\boldsymbol{E}}}}_{0}\) and \(\omega\) are the electric field strength vector and the angular frequency in the monochromatic laser wave, \(\varphi\) and \({\varphi }_{0}\) are the laser field phase and the phase of the electron birth correspondingly. Note that (a) lattice momentum conservation requires the hole to be excited in the K′ point and (b) for linear polarization, the electron is excited with equal probability also at the K′ point (the corresponding hole at the K-point). In Fig. 5 the exemplary electron trajectory, starting at the K point at the field phase (“birth” phase) \({\varphi }_{0}=\pi /2\) for a driving wavelength of 3.5 µm (Fig. 5a) and 4.5 µm (Fig. 5d), is superimposed with the dephasing time landscape. Using the dephasing time profile along the selected electron trajectory, we can calculate the cycle average, trajectory-specific dephasing time as \(\langle {T}_{2}\rangle ({\varphi }_{0})=\frac{2\pi }{{\int }_{0}^{2\pi }{d}_{\varphi }{T}_{2}({{\boldsymbol{k}}}(\varphi,{\varphi }_{0}))}\). For the exemplary trajectories in Fig. 5, we calculate \(\left\langle {T}_{2}\right\rangle\) values ≈ 4 fs for both, 3.5 µm and 4.5 µm driving wavelengths for the motion along zigzag direction and 4.2 fs and 4.4 fs for the motion along the armchair direction, correspondingly. Thus, the HHG-relevant effective coherence time is in the few-fs regime, despite much longer near-edge scattering times.
Fig. 5: Trajectory resolved dephasing.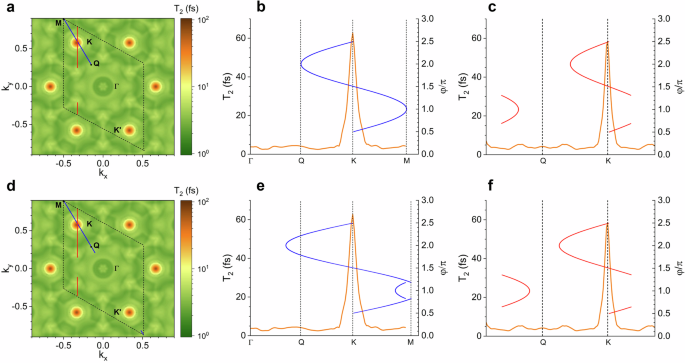
a Electron trajectory in k-space for the laser wavelength 3.5 µm and the polarization oriented along the zigzag symmetry direction (blue line) and armchair direction (red line). b The 2D profile of the dephasing time along the zigzag direction (orange curve) and the corresponding electron trajectory (blue line). c The 2D profile of the dephasing time along the armchair direction (orange curve) and the corresponding electron trajectory (red line). d–f The same as a–c for 4.5 µm laser wavelength.
Finally, simulations for monolayer MoS2 provide very similar results with slightly larger scattering times, which may explain the difference in the slopes retrieved for MoS2 and WS2 monolayers. Also, for CdSe in wurtzite structure, as for the TMD monolayer, the scattering time is strongly k-dependent and drops abruptly from ≈100 fs at the Γ-point to a few femtoseconds for larger lattice momenta (see Supplementary Fig. 7). Therefore, the ultrashort nature of the e-ph scattering outside the bandgap minima is a universal phenomenon in solids, now experimentally assessable by the nonlocal processes of HHG.
Concluding this section, we emphasize that the wavelength scaling of the HHG yield is not determined by dephasing alone. It also reflects the band structure, the driven trajectory length in momentum space, and the relative interband and intraband contributions. However, within our multi-band full-Brillouin zone simulations, the steepness of the experimentally observed scaling is controlled primarily by the dephasing term: calculations without dephasing or with long constant dephasing time yield substantially weaker scaling, whereas introducing momentum-resolved dephasing reproduces the observed trend. We therefore interpret dephasing as the dominant contribution governing the scaling exponent in the present experimental conditions, while other ingredients shape the detailed spectral response.