
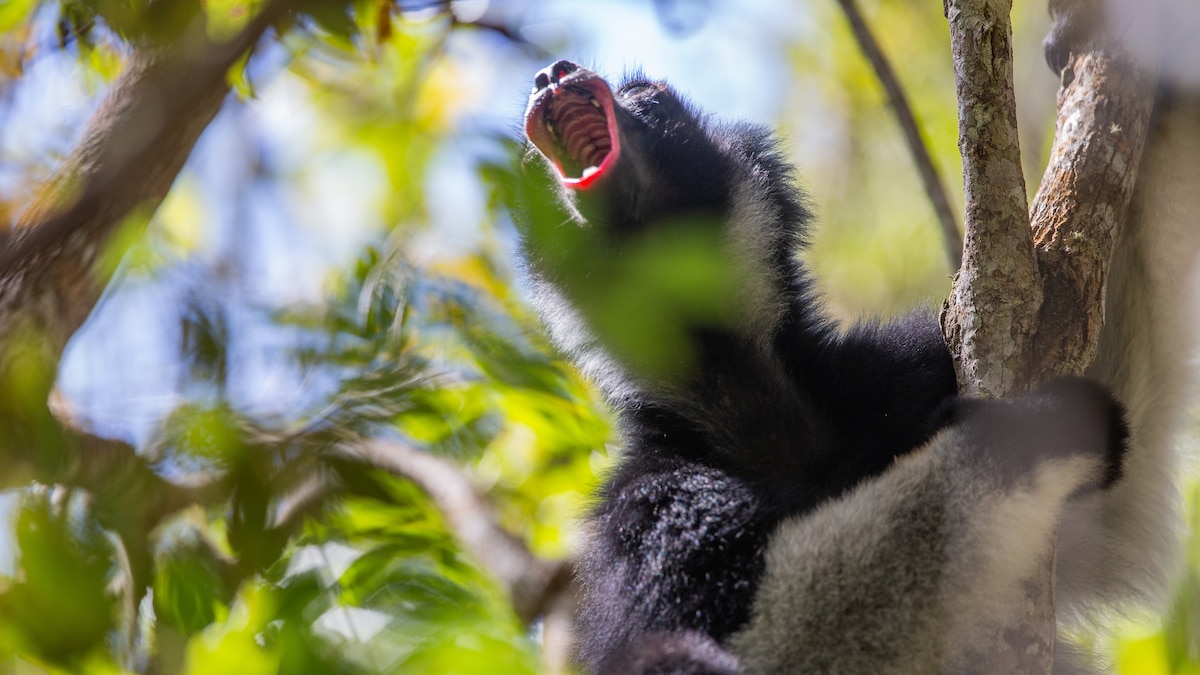
However, there was a complication. Hearing one indri song isn’t the same as counting an indri group. The same family can sing more than once. Some songs, drowned out by the din of the forest, may not reach a microphone at all. To turn thousands of detections into an estimate of population density, the researchers needed to know both how frequently indri groups sing and how likely their microphones were to hear them.
Ferrario solved this by using a visual representation of sound called a spectrogram to decode the vocalizations. A spectrogram is a digital graph that shows how the frequency and intensity of a sound evolves over time, letting researchers see which species are vocalizing, just by looking at the shape of the sound.
On a spectrogram, the dark color of notes indicates the intensity—the nearer to the song being recorded, the darker the color. The further the song is, the notes are more of a light gray. “Based on the spectrogram, you can understand which group is singing,” says Ferrario.
The team based its research on 12 families of indris whose identities and general locations were already known. When one group sang, the researchers knew the origination point and which ARUs had recorded it. They could then estimate the likelihood of picking up songs based on distance and orientation.