
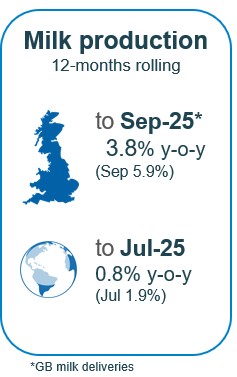
Milk production
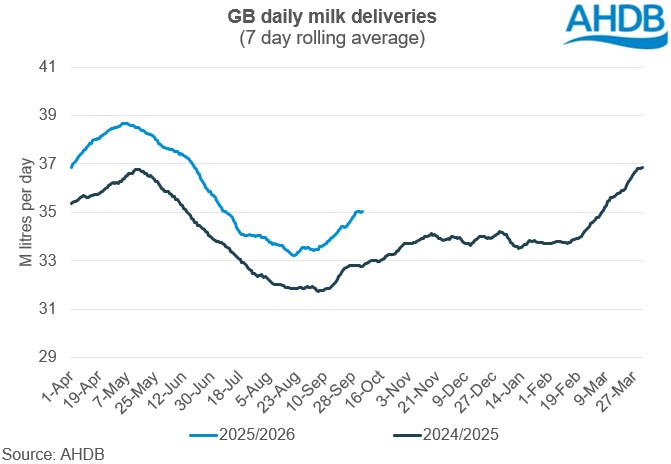
GB milk deliveries through Q3 remained hefty, reaching 5.0% up on the same quarter in 2024. July increased by 4.3%, August 4.9% and September by 5.9%. We are annualising against a fairly weak year but are still up by 4% against the 5-year average. For 2025 so far, higher farmgate prices and cheap feed, driving the highest milk-to-feed-price ratio in 20 years have meant record-breaking milk volumes were recorded.
This is in spite of widespread dry conditions for most regions through August. Arguably the need to supplementary feed to make up for lack of forage drove some of the volume gains. Milk composition has been well above average all year as well.

The increase in Q3 deliveries brings the GB forecast for the 2025/26 season to 12.89bn litres, a significant increase of 3.6% compared to the previous season and a record high. The expectation is for strong growth to continue until the end of 2025, with the rate slowing down into the new year and to see some decline as we head to the flush.
The milk to feed price ratio remains firmly in the expansion zone, at an almost 20-year high, incentivising farmers to continue to push production. Feed costs continue to decline, standing at almost 3% lower year-on-year (as of June-25).
Autumn rain after the drought is producing a flush of grass growth which could take some pressure off forage stocks for a time and may enable a late silage cut. However, forage costs and availability this winter will be a challenge for some.
Inflation of overall key input costs, which constitute a vital part of cost of production, nudged up slightly by 0.3% in July-25 compared to the previous year. However, there was variable performance across fertiliser, energy and feed. Easing feed and fuel costs will continue to boost farmer’s confidence. This index does not account for labour costs which have continued to increase though, and the cost of borrowing remains high. Forage costs will also be abnormally high for some (although by no means all) this year. However, high production levels will continue as long as milk prices remain high enough to support the favourable milk-to-feed price ratio.
The risk of Bluetongue virus which was threatening in the early part of the year, and has caused significant milk supply issues on the continent, has not yet impacted on milk production at a national level. However, it remains a risk next year and is a risk to fertility as well as production and the advice is still for farmers to discuss vaccination with their vets.
Cow numbers are declining, with the size of the GB milking herd in July 2025 0.6% lower than a year earlier. This is mainly driven by the decline in the under 4-years of age categories highlighting the issue of shortage of replacement heifers for the future. Lower milk prices, teamed with the need to buy-in costly forage supplies for some and increased bedding and labour availability and cost challenges (+8.6% in June year-on-year), will cause many to assess their herd size. Exceptional beef prices and lower culling rates through the summer is likely to cause cow numbers to fall by Spring as more come forward for slaughter. This will start to slow production.
GB organic milk deliveries have continued to recover since the nadir in production seen last year and production was up by 12.2% for the milk year to date.
Global milk production averaged 775.5 million litres per day in July, an increase of 14.7 million litres per day (+1.9%) across the selected regions, compared to the same period last year.
Milk deliveries in the EU averaged 392.8 million litres per day in July, a marginal decline of 0.2 million litres per day compared to the same month of the previous year. High variance in EU: Italy down -42.43 (-4.1%), Belgium, down 25 million litres (-6.5%) and Germany, down by 23 million litres (-0.9%), year-on-year. Irish milk production up by 35 million litres (3.6%) and Poland by 32.85 million litres (3.0%). Important to note that later local reports from the EU mention growing milk supplies in France, Belgium and Germany with delayed calving due to Bluetongue one of the drivers. More milk from the EU will further pressure prices.
US production was up 4.2% year-on-year, with production at 280.1 million litres per day in July. Increasing herd size, yields and improved margins have been drivers of growth.
Australia declined (-4.0%) due to dry weather conditions in the south west but New Zealand deliveries were up by 0.1 million litres per day (0.6%). High farmer confidence supported by positive milk prices and higher feed input increased milk flows.
Argentina’s production also increased in July, up 7.7% year-on-year. Favourable prices and weather conditions boosted production.
Rabobank estimate that milk supply growth for H2 2025 will be 2% before slowing to 0.4% growth in 2026. That will be driven by robust growth in both the US (recovery in Californian production and growth in herd size and yields) and New Zealand (good margins and weather starting the season strongly). The EU is also expected to return to growth with the easing of Bluetongue virus and good margins, although summer drought has impacted many. South America is also predicting growth. On the other hand, Australian production is to be negatively impacted by drought.
Wholesale markets
Record milk volumes have resulted in building up of stocks whilst demand remained subdued. Whilst milk price announcements for October have been mixed, those for November are showing a number of very sharp falls which will start to damage farmer confidence.
Overall price movements on UK wholesale markets have seen a big shift over the quarter. Prices stayed fairly steady in July and August, however, rising milk volumes have started to pressure commodity prices in September. Butter and cheese prices have seen a significant decline of £510/t and £410/ton respectively in September month-on-month following the lead on the continent.
Butter stocks have been said to build as a result of increased production on the back of continued high milk supplies.
After a steady start, Bulk cream prices began to fall away, with average pricing sitting £140/t lower in September compared to August.
Mild cheddar prices followed the trajectory of butter pricing, with a substantial drop of £410/t month on month. Sellers are actively looking to shift product but still require pricing that covers higher milk costs. There were some comments that the increase in very competitively priced US cheddar was shifting export dynamics.
SMP prices saw the least movement but did ease £80/t in September.
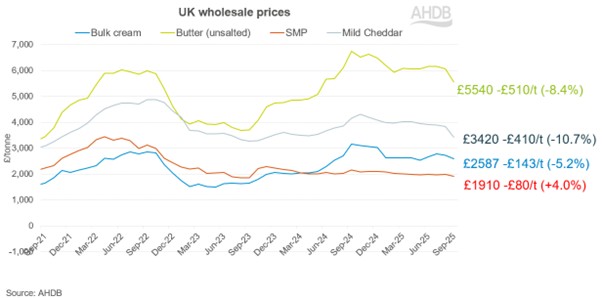
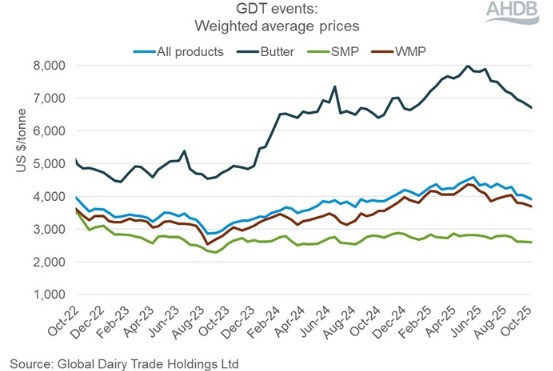
The GDT has shown some weakness throughout the quarter, especially for butter, although prices remain high compared to two years ago.
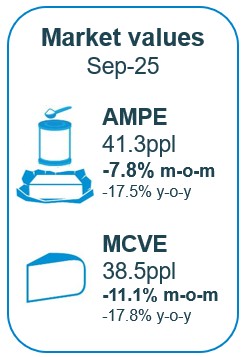
As of September, milk market values (which is a general estimate on market returns and the current market value of milk based on UK wholesale price movements and typical milk utilisation) fell sharply to 39.0ppl. AMPE declined by 7.8% to 41.3ppl, MCVE declined by 11.1% to 38.5ppl. AMPE and MCVE are now behind this time last year by 17% respectively. A fall in the MMV is generally predictive of a fall in farmgate milk prices three months later.
Please note: AHDB reviewed the market indicators in September and all quoted values are based on the revised calculations. More detail can be found on the market indicators page.
Farmgate milk prices
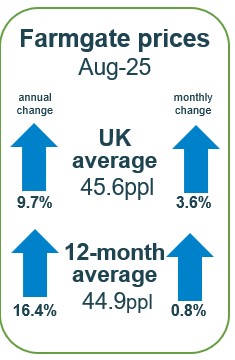
The latest published farmgate price was for August, with a UK average of 45.6ppl. Please note we are currently checking the last few months’ UK price movements with Defra. Latest announced farmgate prices were stable for October, although this excludes November price movements which have in some cases been aggressively negative. The question is how widespread and how fast the milk price falls will be, and how that will marry up with costs. Organic and some other speciality dairy prices have remained strong due to a shortage of organic milk. Some processors have taken a short, sharp correction approach, whilst others so far look to be taking a more progressive approach. Those farmers on the latter contracts will not feel significant falls until the new year. For those on manufacturing contracts very strong fat and protein levels in the milk will also compensate for some of the headline price falls. This may lead to a delay in falls in the yield over what headline milk prices may predict.
For October, price announcements for retail aligned liquid contracts showed some increases. Sainsburys increased by 2.85ppl and M&S saw an increase of 0.88ppl after holding their price for the previous five months. Co-op and Tesco held their price.
Non-aligned liquid contracts showed mixed movements. Pembrokeshire Creamery decreased their price by 0.45ppl. Muller held on to their price after an increase of 0.5ppl in September.
Paynes Dairies and Freshways both increased their price by 2ppl, restoring the 2ppl reductions made from May this year. Crediton Dairy has held steady for the last ten months after continuous increases over the previous year.
Cheese contracts showed downwards signals with First Milk, Leprino and South Caernarfon Creameries announcing a price decrease of 1ppl. Wensleydale decreased by 0.20ppl. Other participants on the league table made no change to their price in September (Lactalis, Belton, Barbers and Saputo). Wyke made no price announcement.
Manufacturing contracts saw stability, with the exception of UK Arla Manufacturing decreasing their price by 1.66ppl. Pattemore Dairy has held on to their price for the last eleven months. Meadow announced no change in price.
Trade
Total UK dairy export volume for H1 2025 increased by 2.5% at 688,800t and value for H1 2025 increased by 20% at £1.1bn .Exports were boosted by a volume increase in exports of milk powders, whey and butter. Milk powders saw the biggest volume increase of 15,300t (28.3%) mostly bound for non-EU nations (Algeria, Pakistan, Malaysia, Egypt, Saudi Arabia, United Arab Emirates, Nigeria, Indonesia). Also growth in exports of whey and whey products and butter by 7,700t (26.6%) and 2,100t (9.5%) respectively. However, exports of yoghurt, milk and cream and cheese dropped by 3,900t (16%), 3,800t (0.9%) and 700t (0.7%), respectively.
In H1 2025, value growth was witnessed across the board, led by milk and cream (23.7%), followed by cheese and curd (10.9%), butter (37.8%) and powders (23.7%).
Total import volumes in H1 2025 are up over 27,000t (4.6%) from 2024 levels to 637,000t, most from the EU. The most significant increase was seen in cheese imports by 11,600t (5.3%) followed by yoghurt with 5,600t growth (3.7%) and milk powders at 3,700t (9.5%). Whey and whey products, butter and milk and cream contributed to the increase by 2900t (7.3%), 2800t (9.2%) and 1300t (1%) respectively.
There has been a surge of dairy imports from New Zealand from 2024 onwards with imports increasing by 5900t (81.2%) in H1 2025 compared to the same period in the previous year. Most of the dairy imports from New Zealand constituted of cheese and curd followed by butter and milk powders.
Demand
Please note, latest retail data has been delayed due to a data provider issue. New data should be available w/c 20th October. However, during the 52 weeks ending 12 July 2025, volumes of cows’ dairy declined by 1.2% year-on-year (NIQ Homescan POD, Total GB). Spend on cows’ dairy increased by 4.0% year-on-year, driven by a growth in average prices of 5.3%.
Cows’ milk volumes continued to decrease, seeing a 2.6% year-on-year decline (NIQ, 52 w/e 12 July 2025). Spend also saw a decline (-0.7%), despite seeing a 2.0% increase in average prices paid. Plant based and other animal sourced milk also saw volume declines this period, with plant based seeing steeper average price increases (+3.3%). Whole milk was the only category to see volume growth, up 2.4% (27.4 million litres), driven by an increase in buyers during the period.
Cows’ cheese remained in volume growth, up 2.1% year-on-year, with spend during the period increasing by 2.9% (NIQ, 52 w/e 12 July 2025). Cheddar, which represents 41.5% of all cow cheese volumes, saw a 2.6% (3.7 million kilos) increase in volumes purchased, and combined with strong performance seen by specialty and continental (2.2%) snacking (+0.9%), and other cow cheese (which include cottage cheese, quark and soft white) (+5.8%), offset declines seen by processed, British regionals and stilton and British blue. Overall, cow cheese benefitted from an increase in volumes purchased per shopper, as well as an increase in shopper numbers during the period.
Cows’ butter, at a total level, experienced a 2.6% decline in volume but a 7.0% increase in spend, which was driven by 10.0% increase in average price paid (NIQ, 52 w/e 12 July 2025). Despite this, block butter continued to see volume increases of 5.5% (+3.6 million kilos), driven by an increase in shopper numbers and an increase in shopper frequency of purchase.
Cows’ yoghurt, yoghurt drinks and fromage frais volumes continue to see growth (+6.3%), with spend increasing by 10.0% (NIQ, 52 w/e 12 July 2025), with an increase in buyers and frequency of purchase driving this performance. All products saw volume growth during the period, apart from fromage frais (-9.9%) and standard flavoured yogurts (-3.0%). Cows’ fat free yoghurt saw the greatest actual growth with an additional 14.2 million kilos purchased year-on-year (+9.4%), while cows’ standard plain yoghurt saw the fastest growth of 24.3% year-on-year.
Cows’ cream volumes experienced a 1.4% increase year-on-year and combined with a 6.4% increase in average prices paid, resulted in a 7.8% increase in spend (NIQ, 52 w/e 12 July 2025). Cows’ cream performance was driven by an increase in shopper numbers, as well as an increase in volumes purchased per shopper. Double (+3.4%, equivalent to +1.2 million litres) and sour cream (+4.4%, equivalent to +371 thousand litres) drove the overall category performance, but aerosol (+0.8%) and clotted (+2.8%) also contributed to volume growth.
See the full data and these insights visualised on our GB household dairy purchases retail dashboard.