
Liver samples
All liver samples were collected with written informed consent from Addenbrooke’s Hospital, Cambridge, UK, according to procedures approved by Local Research Ethics Committees (20/NI/0109, 16/NI/0196). All participants consented to publication of the research results. The liver samples were snap-frozen in liquid nitrogen and stored at −80 °C in the Human Research Tissue Bank of the Cambridge University Hospitals NHS Foundation Trust.
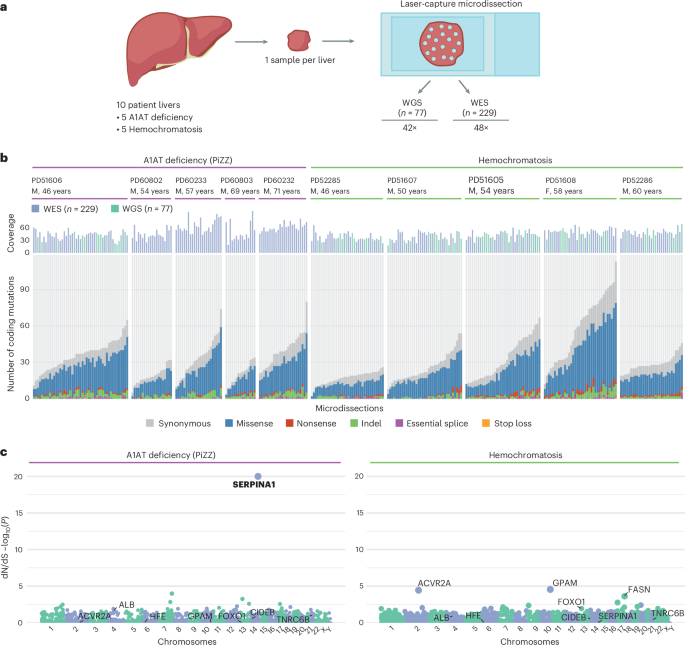
Background diseased liver tissue was obtained from individuals with A1AT deficiency or hemochromatosis who were undergoing liver transplantation for hepatocellular carcinoma or liver failure (Supplementary Table 1). Patients were identified from clinical history, pre-operative investigations and explant histology (Extended Data Fig. 1 and Supplementary Table 1). All patients with hemochromatosis had current or previously elevated serum ferritin with significant hepatocellular siderosis by Perls’ stain. Pre-operative clinical genotyping was only performed for the common C282Y and H63D variants of the HFE gene. Patients with A1AT deficiency were diagnosed based on PiZZ A1AT electrophoretic phenotype and sub-normal serum A1AT levels. The SERPINA1, HFE, HJV, HAMP, TFR2, SLC40A1, BMP2 and RAB6B genotypes3 were derived from WGS or WES data (Extended Data Fig. 1 and Supplementary Table 2). Clinical and sequencing data from patients with SLD were derived from previous publications5,11.
The explant liver histology was reviewed by a specialist liver histopathologist (A.D., blinded to the other study results) and scored according to the Kleiner35 system on formalin-fixed paraffin-embedded samples away from the fresh–frozen block used for the LCM. The Kleiner score, developed for MASLD (to generate a cumulative MASLD activity score), was used in the absence of a validated scoring system for A1AT deficiency or hemochromatosis, allowing comparability between all study samples regardless of disease etiology. The histological findings were scored for siderosis by Perls’ staining using the Scheuer system36 and dPAS-positive globule deposition (Extended Data Fig. 1) as previously described37. Fibrosis was assessed using both the Kleiner35 and the Ishak38 scoring systems (Supplementary Table 1).
Sample preparation
The protocols for preparing liver tissue sections, LCM and subsequent cell lysis, DNA extraction and WGS have been previously described11,39. In brief, for six biopsies (PD51605b, PD51606b, PD51607b, PD51608b, PD52285b and PD52286b), 20 µm-thick tissue sections (prepared with a Leica cryotome) were fixed with 70% ethanol. The other four biopsies (PD60232b, PD60233b, PD60802b and PD60803b) were fixed in PAXgene solutions (PreAnalytiX), processed using a Tissue Tek VIP 6 AI tissue processor (Sakura Finetek) and embedded in paraffin, and 16 µm-thick sections were generated using an Accu-Cut SRM 200 microtome (Sakura Finetek). All LCM sections were mounted on polyethylene naphthalene membrane glass slides (Leica Microsystems) and stained with H&E for subsequent LCM generation using a Leica Microsystems LMD 7000.
LCM
For six biopsies (PD51605b, PD51606b, PD51607b, PD51608b, PD52285b and PD52286b), 48 microdissections were cut with a target area of 86,000 µm2, with the same x,y-region cut into the same well from two adjacent z-stacks. For the remaining four biopsies (PD60232b, PD60233b, PD60802b and PD60803b), cuts were taken at 166,000 µm2 without z-stacking. Overall, microdissection sizes corresponded to 800–1,000 hepatocytes. Images were taken before and after LCM. The microdissected samples were then lysed using the Arcturus PicoPure DNA Extraction Kit (Thermo Fisher Scientific) following the manufacturer’s instructions. DNA libraries for Illumina sequencing were prepared using a protocol optimized for low input amounts of DNA39. The resulting libraries were submitted for paired-end WGS or WES.
Exome sequencing
Exome capture was performed using either SureSelect All Exon v5 bait set (Agilent, S04380110) or Twist Human Core Exome (Twist Biosciences) bait set. Samples were multiplexed and sequenced using 150 bp paired-end reads on an Illumina NovaSeq 6000 (average pool size of 40). Paired-end reads were aligned to human genome assembly GRCh38 using BWA-MEM40. Duplicate reads were marked using biobambam41 and sample contamination estimates were calculated using VerifyBamID42. Library complexity and coverage statistics were calculated using Picard (http://broadinstitute.github.io/picard). The mean on-target coverage across all samples and genes was 48×. Across donors, median coverage ranged from 39× (PD52285b) to 65× (PD60233b).
WGS
WGS was performed using 150 bp paired-end reads on an Illumina NovaSeq 6000. DNA sequences were aligned to the GRCh38 reference genome using BWA-MEM. Duplicate reads were marked using biobambam41. The calculation of library statistics was performed using the CollectWgsMetrics function of Picard Tools, rather than the CollectHsMetrics function used for exome sequencing data. The mean coverage across all samples was 42×.
Calling of single nucleotide variants and indels from exome and WGS data
Single nucleotide variants (SNVs) were called using the CaVEMan (cancer variants through expectation maximization) algorithm43 against an in silico unmatched normal: a BAM file generated from the human reference genome (GRCh38). Indel calling was performed using cgpPindel44, with filtering strategies the same as for SNVs. In addition to the default CaVEMan filters, putative SNVs were required to have a median alignment score of reads showing the variant allele of at least 0.87 and fewer than half supporting reads being clipped (median number of soft-clipped bases, CLPM = 0). Duplicate reads and LCM library preparation-specific artifactual variants resulting from the incorrect processing of secondary cruciform DNA structures were removed with bespoke post-processing filtering39. Across all samples from the same patient, we force-called the SNVs and indels that were called in any sample, using a cutoff for read mapping quality (30) and base quality (25). To filter shared artifacts, we applied a beta-binomial-based filtering approach as previously described45. Mutations with a dispersion estimate of ≥0.1 were considered true somatic variants. Putative germline variants were filtered using a one-sided exact binomial test used on the aggregated counts of reads supporting the variant and the total depth at that site, as described previously45. This tests whether the observed variant counts are likely to have come from a germline distribution or from a distribution with a lower true VAF (probably somatic). For sex chromosomes in male individuals, the binomial probability (true VAF) for comparison was set to 0.95 rather than 0.5. The resulting P values were corrected for multiple testing using a Benjamini–Hochberg correction. Any variant with a q-value of ≤10−5 was classified as a putative somatic variant.
SV calling from WGS data
SVs were called with GRIDDS46 (v.2.9.4), used with default settings. SVs larger than 1 kb in size with QUAL ≥ 250 were included. For SVs smaller than 30 kb, only SVs with QUAL ≥ 300 were included. Furthermore, SVs that had assemblies from both sides of the breakpoint were only considered if they were supported by at least four discordant and two split reads. SVs with imprecise breakends (that is, the distance between the start and end positions of >10 bp) were filtered out. We further filtered out SVs for which the standard deviation of the alignment positions at either ends of the discordant read pairs was smaller than five. To remove potential germline SVs and artifacts, we generated the panel of normals by adding in-house normal samples (n = 350) to the GRIDSS panel of normals. SVs found in at least three different samples in the panel of normals or in matched normal tissues were removed.
Copy number variant calling from WGS data
Somatic copy number variants were called using the Allele-Specific Copy number Analysis of Tumors (ASCAT) algorithm47 as part of the ascatNGS package48 (https://github.com/Crick-CancerGenomics/ascat). ASCAT was run with default parameters with the exception of a segmentation penalty of 100. A bespoke filtering algorithm, ascatPCA, was used to reduce the number of false-positive calls that can arise when analyzing genome sequences from normal tissue (https://github.com/hj6-sanger/ascatPCA). ascatPCA extracts a noise profile by aggregating the logR ratio from across a panel of normal unrelated samples and subtracts this signature from that observed in the sample being analyzed using principal component analysis.
Extraction of mutational signatures
As previously described5,11, the hierarchical Dirichlet process (HDP) algorithm, as implemented in the HDP R package (https://github.com/nicolaroberts/hdp), was used to extract mutational signatures based on a reference catalog of 65 previously identified 192-context-based mutational signatures from the Pan-Cancer Analysis of Whole Genomes (PCAWG) study49 as well as a novel liver signature identified previously in CLD5.
Bayesian Dirichlet process for clustering VAFs across multiple samples
The nonparametric Bayesian HDP was used to group SNVs based on similar VAFs identified across multiple microdissections in each liver sample. This method, called N-dimensional Dirichlet process (NDP) clustering, has been detailed previously11. We ran the algorithm with 15,000 burn-in iterations, followed by 25,000 iterations of posterior Gibbs sampling for the clustering process. During each iteration, there is a defined probability that mutations will be allocated to new clusters that did not exist in the previous iteration. Existing clusters can also be eliminated if member mutations are reassigned to another cluster. This adaptive process allows for the dynamic adjustment of the number of clusters throughout the sampling. To prevent the formation of uninformative clusters, we capped the number of SNV clusters at 100 per patient. We also used a multi-threaded version of the ECR algorithm, adapted from the label.switching R package (https://doi.org/10.18637/jss.v069.c01), to correct for label switching efficiently. For subsequent reconstruction of phylogenetic trees, we only considered SNV clusters that included at least 50 distinct mutations.
Construction of phylogenetic trees
The statistical pigeonhole principle50 was used to deduce the phylogenetic clonal relationships among SNV clusters identified in each patient by the NDP algorithm. Here, each cluster forms a branch on a phylogenetic tree. Evidence that a cluster is considered nested within another is considered strong if its mutation-carrying cell fraction is consistently lower than that of another cluster across all sampled microdissections, and if the combined mutant cell fractions exceed 100%. A combined cell fraction of ≤100% indicates only weak evidence of such nesting. If only certain microdissections show a lower cell fraction for one SNV cluster compared to another, these clusters are deemed independent, not nested within one another. Our analysis was restricted to clusters with a mutant cell fraction of >0.05. We calculated the cell fraction for each SNV cluster by doubling the median VAF in each microdissection, assuming diploidy. SNV clusters with microdissections lacking shared mutations with others in the same cluster were divided into new, independent clusters. These were then reassessed for their phylogenetic relationships to all other clusters from the same patient biopsy, using the pigeonhole principle. Additionally, a naive Bayes algorithm was used to categorize each identified indel into the SNV clusters detected by the NDP algorithm.
Analysis of driver variants
To determine whether any coding variants were under selection in diseased liver tissues, the dN/dScv method12 on the gene level was used. This algorithm identifies genes with an excess of non-synonymous mutations relative to the expected number from the synonymous mutation rate. For this analysis, variants called from whole genomes were collapsed to unique events per SNV cluster identified by the NDP algorithm. Any variants identified in exome data that were not already called in whole genomes from the same patient were collapsed to unique mutations per individual and added to the dN/dScv input. In addition, we conservatively collapsed SNVs separated by ≤10 bp within the same LCM sample into multinucleotide variants. Genes with q values of <0.1 were considered to be under positive selection.
Extraction of mutational signatures from SNV contexts using HDP
To identify possibly undiscovered mutational signatures in the liver from A1AT deficiency and hemochromatosis patients, the HDP (https://github.com/nicolaroberts/hdp) was run on the 96 trinucleotide counts of all microdissected samples, collapsed to unique mutations across samples. To avoid over-fitting, samples with fewer than 50 mutations were not included in the signature extraction. HDP was run with individual patients as the hierarchy, in 20 independent chains, with a burn-in of 20,000 and the collection of 100 posterior samples off each chain with 200 iterations between each. Owing to the lack of novel signatures in this data set, the remainder of the mutational signature analysis was performed by fitting the identified set of signatures from HDP to trinucleotide counts from each microdissection using the R package sigfit (https://doi.org/10.1101/372896).
Protein structure prediction modeling
Structural predictions of the Z-K367*, Z-E387* and Z-M398delFS somatic mutant A1AT proteins were performed using Pymol (v.2.5.2, Schrodinger) to map amino acid sequences onto the crystal structure of native human A1AT (PDB 1QLP)15, identifying secondary structures lost in somatic mutant proteins. To predict the ability of somatic mutant proteins to form mixed polymers with full-length Z-A1AT, their sequences were mapped onto a single protomer within the crystal structure of a human Z-A1AT polymer (PDB 3T1P)16. Atoms of the 3T1P protomer that are lost through truncation of somatic mutants were removed from the displayed image to highlight any incompatibility with polymerization. The two missense residues in Z-M398delFS (F396Y, L397D) were modeled using the Pymol mutagenesis function, selecting side chain rotamers of Y396 and D397 that best conserved the resolved density in 3T1P. Somatic mutant structural models did not undergo energy minimization or geometry optimization processes and hence are used only to predict the feasibility of polymerization, not changes to the protein fold. Structural prediction of Z-M398delFS A1AT was carried out using AlphaFold 3 (ref. 51), in which the top-ranked model is displayed.
Cloning and constructs
Somatic variants of Z-A1AT (Z-K367*, Z-E387*) were generated by site-directed mutagenesis of the Z-A1AT coding sequence (untagged and N-terminally tagged with HaloTag) used previously17. The sequences of primers used in this study are provided in Supplementary Table 3. Bicistronic vectors for co-expression of A1AT with an ER marker protein were generated from pGL4.2 encoding A1AT tagged with HaloTag (M-A1AT, Z-A1AT, Z-K367*-A1AT and Z-E387*-A1AT variants) and the ER marker protein moxsynGFP-KDEL by Gibson assembly (New England Biolabs) to form pGL4.2_HaloTag-A1AT_ER-moxGFP-KDEL variants. For the expression of two A1AT forms to mimic heterozygosity, the ER-moxGFP-KDEL in pGL4.2_HaloTag-Z-A1AT_ER-moxGFP-KDEL (SJM1134) was replaced with untagged A1AT variant coding sequences using Gibson assembly. Sequencing of the plasmids was carried out at Plasmidsaurus (Oxford Nanopore Technologies).
Mammalian cell culture
CHO cells (Clontech) were cultured in F12 Ham’s nutrient mixture (Merck) supplemented with 10% FBS and 2 mM GlutaMAX (Thermo Fisher Scientific) at 37 °C and 5% CO2. CHO Tet-ON cells with inducible expression of Z-A1AT were cultured in high-glucose DMEM (Merck) supplemented with 10% tetracycline-free FBS, 2 mM GlutaMAX and non-essential amino acids (Thermo Fisher Scientific). COS7 cells (MERCK) were cultured in high-glucose DMEM supplemented with 10% FBS and 2 mM GlutaMAX.
Live-cell imaging
CHO parental cells were transfected with a bicistronic vector encoding moxGFP-KDEL and HaloTag-A1AT (M, Z, Z-K367* and Z-E387* variants), performed according to the Lipofectamine LTX reagent protocol (Life Technology). Then, 24 h later, cells were sorted for a GFP-positive population using the BD Influx Cell Sorter and then seeded at 1 × 10⁴ cells per cm2 in an eight-well ibidi slide. Imaging was performed 48 h after seeding. Before imaging, cells were labeled with 0.5 µM JFX549 (Janelia Fluor) in Opti-MEM for 15 min at 37 °C. Airyscan images were collected on an LSM880 (Zeiss) confocal microscope using an Airyscan detector and processed using the Zen (v.2.6) software package (Black edition, Zeiss). Quantitation of ER morphology using co-expression of ER-moxGFP-KDEL was performed using standard confocal imaging using the ImageJ (Fiji, v.2.14.0/1.54f) software package. Cells were counted based on ER morphology and categorized as either reticular ER or as containing ER inclusions. Quantitation was performed using the moxGFP-KDEL channel to avoid bias introduced by variable accumulation (and hence fluorescence intensity) of different A1AT variants. To quantify ER morphology in cells co-expressing variants of untagged antitrypsin with HaloTagged Z-A1AT, as a mimic of heterozygous expression, CHO cells were transfected as described above with the relevant bicistronic vector. Cells were labeled with JFX549 HaloTag ligand after 48 h expression, then imaged using a Zeiss LSM980 in Airyscan mode. Images were processed using Zen blue software before a gamma correction of 0.5 was applied to allow simultaneous visualization of high-intensity and low-intensity features. Cells were then categorized as having either reticular or inclusion-containing ER morphology.
Single-particle tracking
Single-particle tracking of HaloTag-A1AT variants was performed as described previously18 using Trackmate (v.7) software22. In brief, COS7 cells were transfected 4 h after seeding using 1 µg DNA and 3 µl Fugene 6 (Promega) as per the manufacturer’s instructions, to drive expression of an ER marker protein (mEmerald-KDEL) and HaloTag-A1AT variants. Cells were imaged 18 h after transfection, following labeling with PA-JF646 photoactivatable ligand52.
Sandwich ELISA for A1AT
CHO cells were seeded at a density of 2.08 × 10⁴ cells per cm2 in six-well cell culture plates (Greiner Bio-One), as described above for CHO parental cells. Cell culture media was substituted with 1 ml of Opti-MEM reduced serum medium (ThermoFisher Scientific) 24 h after transfection. Conditioned Opti-MEM and cell lysates were collected 48 h after transfection and subject to ELISA for A1AT as described previously17, using the monoclonal anti-A1AT antibody mAb3C11 (ref. 53) (a kind gift from David Lomas).
Native PAGE and SDS–PAGE
Native PAGE and SDS–PAGE were performed as described previously18. In brief, parental CHO and Tet-On CHO cells were seeded at a density of 2.08 × 10⁴ cells per cm2 and transfected as described above for CHO parental cells. For native PAGE, sonicated soluble lysate containing 80 μg of protein, or an equivalent volume of the corresponding insoluble lysate, was loaded onto an acrylamide native gel (resolving gel composition: 7.5% w/v acrylamide–bisacrylamide mixture (37.5:1), 0.37 mM Tris-HCl pH 8.8, 0.12% w/v APS, 0.2% v/v TEMED; stacking gel composition: 5.3% w/v acrylamide–bisacrylamide mixture (37.5:1), 110 mM Tris-HCl pH 6.8, 0.125% w/v APS, 0.15% v/v TEMED). For SDS–PAGE, soluble lysate containing 80 μg of protein, or an equivalent volume of the corresponding insoluble lysate, was loaded on a 10% acrylamide gel. A monoclonal α1-antitrypsin antibody (MA5-15521, Thermo Fisher Scientific) raised against a peptide consisting of amino acids 40–184 of human A1AT was used for SDS–PAGE immunoblotting. A polyclonal antibody raised against full-length human A1AT (A0409, Sigma-Aldrich) was used for native PAGE western blot (total α1-antitrypsin pool). The human A1AT polymer-specific mAb2C1 antibody (HM2289, Hycult Biotechnology) was used for native PAGE detection of polymers.
Z-A1AT polymer immunohistochemistry
Immunohistochemistry staining was performed on liver tissue sections from subjects with A1AT deficiency, adjacent to those on which LCM was previously performed. Sections (5 µm thick) were cut from PAXgene-fixed paraffin-embedded tissue blocks and mounted on Superfrost Plus glass microscope slides. Sections were dewaxed by sequential immersion in xylene two times for 2 min, 100% ethanol two times for 2 min, 70% ethanol for 1 min and then deionized water for 1 min. Endogenous peroxidase was blocked by soaking slides in methanol with 0.3% hydrogen peroxide solution for 30 min. After washing the slides in TBS, off-target secondary antibody was blocked by soaking the tissue sections in 3% normal horse serum (VECTASTAIN Elite ABC-HRP Mouse IgG Kit, Vector Laboratories) in TBS for 1 h. Tissue sections were washed in TBS and incubated overnight in 1:50 dilution of the polymer-specific mAb2C1 antibody (Hycult Biotech, cat. no. HM2289). The next day, tissue sections were incubated with horseradish peroxidase (HRP)-conjugated horse anti-mouse IgG secondary antibody (1:200, VECTASTAIN Elite ABC-HRP Mouse IgG Kit, Vector Laboratories) for 1 h. After the removal of unbound antibodies, HRP activity was developed with diaminobenzene. The sections were then counterstained with Mayer’s hematoxylin, rinsed, rehydrated, mounted and imaged using a NanoZoomer 2.0-HT slide scanner (Hamamatsu Photonics).
The 2C1 staining intensity from regions of interest was scored (0–3) by four independent scorers (V.K., J.C., S.J.M. and T.C.) who were blinded to the genotype of the region of interest; a mean of these scores was reported. Regions of interest were grouped based on SERPINA1 genotype: non-truncating variants included L12delFS, F47InsFS, L124delFS, L144delFS, Q180delFS, K192insFS, V205delFS, Q236delFS and L397delIF. Truncating variants included K367*, G373delFS, G373insFS, M382delFS, S383insFS, P386insFS, E387insFS, E387* and F396delFS.
HaloTag pulse–chase of A1AT
CHO parental cells were transfected using the Invitrogen Neon Transfection System with 5 μg of DNA encoding HaloTag-A1AT (M, Z, Z-K367* and Z-E387* variants) per 5 × 10⁵ cells using three electric pulses at 1,400 V and 10 ms width. Cells were labeled with PA-JF646 photoactivatable ligand after 42 h and chased for a further 24 h. Cells were collected at 0, 1.5, 3, 6, 12 and 24 h time points. Cell lysates were sonicated in a water bath sonicator for 30 min at 4 °C (whole-cell lysate). Then, 60 μg of protein lysates from the first time point and an equivalent volume of protein lysates from subsequent time points were prepared in SDS loading buffer for SDS–PAGE analysis. Gel fluorescence was detected using a Li-Cor CLx scanner.
HaloTag pulse–chase of Z-K367* with inhibitors of degradation
CHO parental cells were transfected using the Invitrogen Neon Transfection System as above. Cells were labeled with PA-JF650 photoactivatable ligand after 42 h and substituted with media containing 5 μM lactacystin, 100 nM bafilomycin or both and chased for a further 6 h. Cells were collected at 0, 1.5, 3 and 6 h. Then, 50 μg of protein lysates from the first time point and equivalent volumes of protein lysates from subsequent time points were prepared in SDS loading buffer for SDS–PAGE analysis as previously described. Gel fluorescence was detected using a Li-Cor CLx scanner.
HaloLink pulldown of A1AT
CHO Tet-ON cells with inducible expression of untagged Z-A1AT, as described above, were treated with 1 μg ml−1 doxycycline for 48 h. Cells were collected by washing twice with PBS on ice before applying 200 µl of ice-cold lysis buffer (50 mM Tris-HCl pH 7.4, 150 mM NaCl, 1% Triton) containing 1× protease inhibitor (G6521, Promega). The cell lysate supernatant was used for the subsequent steps of the HaloLink pulldown analysis. Equal amounts of protein lysates were incubated with Magne HaloTag beads (Promega, cat. no. G7281) overnight at 4 °C in a rotor. Beads were washed four times with lysis buffer, and protein interactors of HaloTag fusion proteins were liberated with 2× SDS–PAGE sample buffer (312.5 mM Tris-HCl pH 6.8, 50% v/v glycerol, 10% w/v SDS, 0.05% w/v Bromophenol Blue, 50 mM dithiothreitol) by heating at 75 °C for 10 min and separation from HaloTag bead. SDS–PAGE was performed on eluted material and 80 μg of input, followed by immunoblotting as described above.
Statistics and reproducibility
Statistical analyses were performed using R (v.4.3.1) or GraphPad Prism (v.9); statistical tests used, numbers of biological replicates and the P values are described in the figure legends; q values were calculated using the Benjamini–Hochberg correction for multiple hypothesis testing. No data were excluded from the analyses. The experiments were not randomized and the investigators, apart from the pathologist, were not blinded to allocation during the experiments and outcome assessment.
Reporting summary
Further information on research design is available in the Nature Portfolio Reporting Summary linked to this article.