

Sep 1, 2025
IndexBox has just published a new report: United Kingdom – Whey – Market Analysis, Forecast, Size, Trends and Insights.
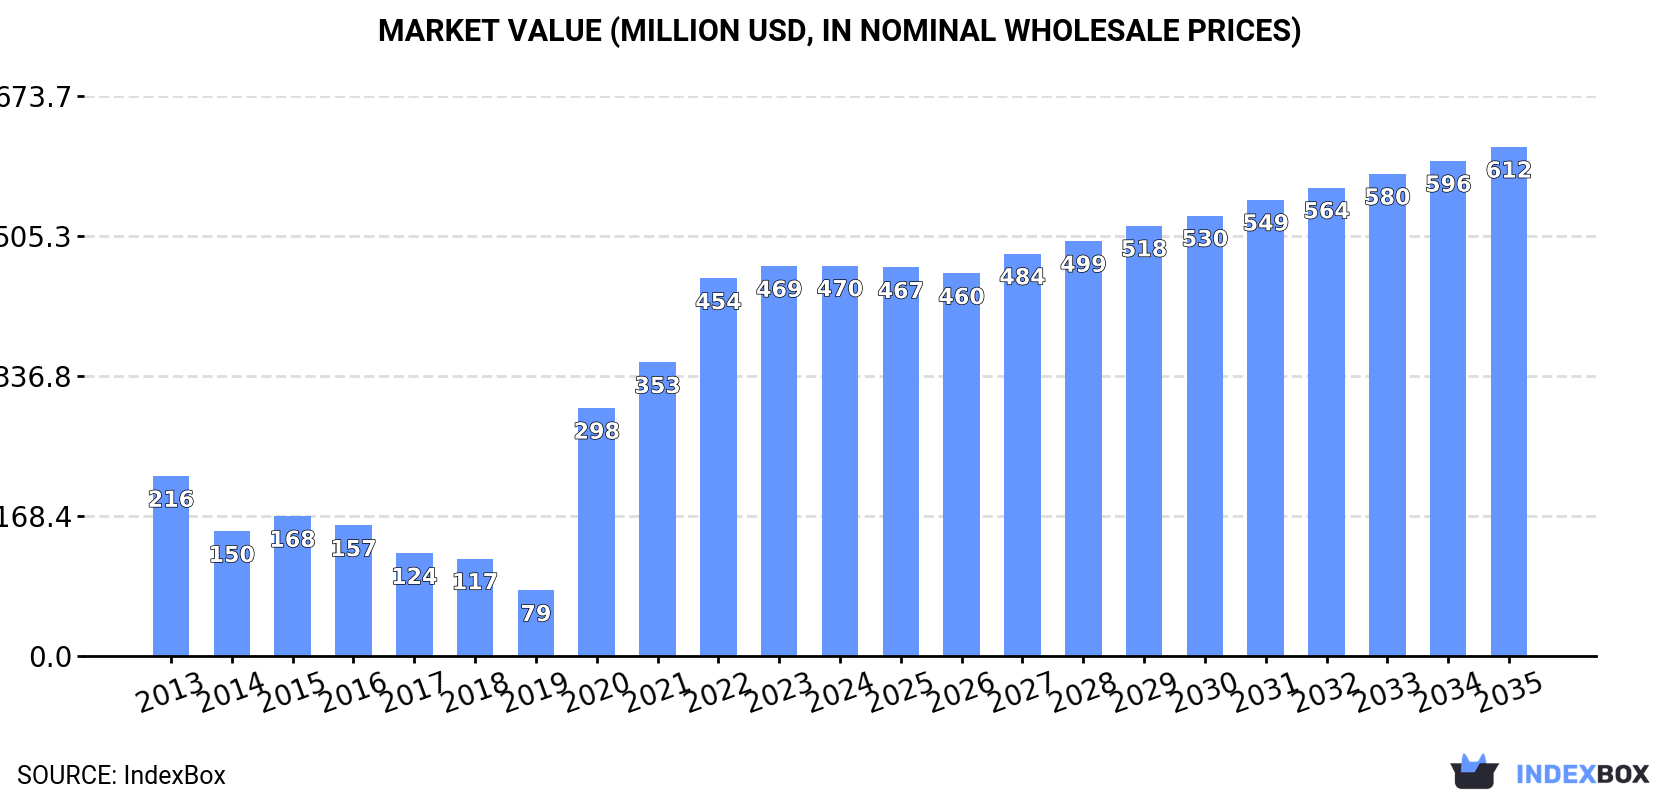
The UK whey market is expected to see a steady increase in consumption over the next decade driven by growing demand. With an anticipated CAGR of +2.3% for volume and +2.4% for value from 2024 to 2035, the market is forecasted to reach 319K tons in volume and $612M in value by the end of 2035.
Market Forecast
Driven by increasing demand for whey in the UK, the market is expected to continue an upward consumption trend over the next decade. Market performance is forecast to accelerate, expanding with an anticipated CAGR of +2.3% for the period from 2024 to 2035, which is projected to bring the market volume to 319K tons by the end of 2035.
In value terms, the market is forecast to increase with an anticipated CAGR of +2.4% for the period from 2024 to 2035, which is projected to bring the market value to $612M (in nominal wholesale prices) by the end of 2035.
 ConsumptionUnited Kingdom’s Consumption of Whey
After four years of growth, consumption of whey decreased by -0.3% to 249K tons in 2024. In general, the total consumption indicated slight growth from 2013 to 2024: its volume increased at an average annual rate of +1.4% over the last eleven-year period. The trend pattern, however, indicated some noticeable fluctuations being recorded throughout the analyzed period. Based on 2024 figures, consumption increased by +71.2% against 2017 indices. Whey consumption peaked at 275K tons in 2016; however, from 2017 to 2024, consumption failed to regain momentum.
The value of the whey market in the UK totaled $470M in 2024, remaining relatively unchanged against the previous year. This figure reflects the total revenues of producers and importers (excluding logistics costs, retail marketing costs, and retailers’ margins, which will be included in the final consumer price). Overall, consumption, however, showed a strong increase. Over the period under review, the market reached the peak level in 2024 and is likely to continue growth in years to come.
ProductionUnited Kingdom’s Production of Whey
In 2024, production of whey in the UK totaled 245K tons, leveling off at 2023 figures. Overall, production showed a relatively flat trend pattern. The most prominent rate of growth was recorded in 2018 with an increase of 45% against the previous year. Whey production peaked at 259K tons in 2016; however, from 2017 to 2024, production stood at a somewhat lower figure.
In value terms, whey production fell modestly to $481M in 2024 estimated in export price. Over the period under review, production recorded a resilient expansion. The growth pace was the most rapid in 2020 when the production volume increased by 239% against the previous year. Over the period under review, production attained the peak level at $485M in 2023, and then contracted slightly in the following year.
ImportsUnited Kingdom’s Imports of Whey
In 2024, purchases abroad of whey increased by 16% to 65K tons, rising for the third year in a row after two years of decline. Over the period under review, total imports indicated prominent growth from 2013 to 2024: its volume increased at an average annual rate of +6.5% over the last eleven-year period. The trend pattern, however, indicated some noticeable fluctuations being recorded throughout the analyzed period. Based on 2024 figures, imports increased by +41.6% against 2021 indices. The growth pace was the most rapid in 2015 with an increase of 70%. Imports peaked in 2024 and are likely to see steady growth in the near future.
In value terms, whey imports surged to $120M in 2024. The total import value increased at an average annual rate of +3.1% from 2013 to 2024; however, the trend pattern indicated some noticeable fluctuations being recorded in certain years. As a result, imports attained the peak and are likely to continue growth in the immediate term.
Imports By Country
In 2024, Ireland (40K tons) constituted the largest whey supplier to the UK, accounting for a 61% share of total imports. Moreover, whey imports from Ireland exceeded the figures recorded by the second-largest supplier, the Netherlands (8.7K tons), fivefold. The third position in this ranking was held by Germany (6.1K tons), with a 9.4% share.
From 2013 to 2024, the average annual rate of growth in terms of volume from Ireland amounted to +15.1%. The remaining supplying countries recorded the following average annual rates of imports growth: the Netherlands (+5.2% per year) and Germany (-2.3% per year).
In value terms, Ireland ($63M) constituted the largest supplier of whey to the UK, comprising 53% of total imports. The second position in the ranking was taken by the Netherlands ($17M), with a 14% share of total imports. It was followed by Austria, with a 12% share.
From 2013 to 2024, the average annual growth rate of value from Ireland totaled +11.5%. The remaining supplying countries recorded the following average annual rates of imports growth: the Netherlands (-4.7% per year) and Austria (+134.7% per year).
Import Prices By Country
In 2024, the average whey import price amounted to $1,846 per ton, increasing by 14% against the previous year. Overall, the import price, however, showed a pronounced shrinkage. The most prominent rate of growth was recorded in 2014 when the average import price increased by 27% against the previous year. As a result, import price attained the peak level of $3,364 per ton. From 2015 to 2024, the average import prices failed to regain momentum.
There were significant differences in the average prices amongst the major supplying countries. In 2024, amid the top importers, the country with the highest price was Austria ($6,520 per ton), while the price for France ($952 per ton) was amongst the lowest.
From 2013 to 2024, the most notable rate of growth in terms of prices was attained by Austria (+15.5%), while the prices for the other major suppliers experienced more modest paces of growth.
ExportsUnited Kingdom’s Exports of Whey
In 2024, overseas shipments of whey increased by 25% to 61K tons for the first time since 2019, thus ending a four-year declining trend. In general, total exports indicated a measured increase from 2013 to 2024: its volume increased at an average annual rate of +2.2% over the last eleven years. The trend pattern, however, indicated some noticeable fluctuations being recorded throughout the analyzed period. The most prominent rate of growth was recorded in 2014 with an increase of 79% against the previous year. As a result, the exports reached the peak of 85K tons. From 2015 to 2024, the growth of the exports remained at a lower figure.
In value terms, whey exports skyrocketed to $132M in 2024. Over the period under review, exports enjoyed a buoyant increase. The most prominent rate of growth was recorded in 2019 with an increase of 79%. The exports peaked in 2024 and are likely to see gradual growth in the immediate term.
Exports By Country
The Netherlands (14K tons), Ireland (7.2K tons) and China (7K tons) were the main destinations of whey exports from the UK, with a combined 46% share of total exports. France, Germany, Denmark, South Africa, Poland, Singapore, New Zealand and Belgium lagged somewhat behind, together comprising a further 27%.
From 2013 to 2024, the most notable rate of growth in terms of shipments, amongst the main countries of destination, was attained by New Zealand (with a CAGR of +122.5%), while the other leaders experienced more modest paces of growth.
In value terms, the Netherlands ($13M), Ireland ($13M) and China ($9M) appeared to be the largest markets for whey exported from the UK worldwide, with a combined 27% share of total exports. France, Denmark, Germany, Singapore, South Africa, Poland, New Zealand and Belgium lagged somewhat behind, together accounting for a further 19%.
New Zealand, with a CAGR of +83.8%, saw the highest growth rate of the value of exports, among the main countries of destination over the period under review, while shipments for the other leaders experienced more modest paces of growth.
Export Prices By Country
The average whey export price stood at $2,167 per ton in 2024, dropping by -2.4% against the previous year. Over the period under review, export price indicated a measured expansion from 2013 to 2024: its price increased at an average annual rate of +2.9% over the last eleven years. The trend pattern, however, indicated some noticeable fluctuations being recorded throughout the analyzed period. Based on 2024 figures, whey export price increased by +63.4% against 2018 indices. The most prominent rate of growth was recorded in 2022 an increase of 35%. The export price peaked at $2,220 per ton in 2023, and then declined slightly in the following year.
There were significant differences in the average prices for the major external markets. In 2024, amid the top suppliers, the country with the highest price was Denmark ($2,851 per ton), while the average price for exports to Belgium ($824 per ton) was amongst the lowest.
From 2013 to 2024, the most notable rate of growth in terms of prices was recorded for supplies to Ireland (+2.3%), while the prices for the other major destinations experienced more modest paces of growth.