
This economy feels very strange.
Today, the Bureau of Labor Statistics did its usual thing, putting out its monthly jobs report characterizing how the economy is doing. The BLS showed a modestly stagnant labor force. It’s a muddled picture. Unemployment is low, but there were just 22k new jobs, which is much less than the 75k expected. Manufacturing is doing poorly, as is oil and gas, health care jobs are fine. Last quarter’s gross domestic product increased more than most economists expected, and the stock market up is because of a belief that the Federal Reserve will relax borrowing costs.
There’s a little bit of something for everyone’s narrative in these new numbers. Employ America’s Skanda Amarnath says these kinds of numbers usually only occur before a recession. Conservative Trump supporter Oren Cass says that less immigration has successfully kept joblessness low.
At the same time, there’s a level of creepiness in what used to be standard data releases. Government numbers clearly don’t illustrate what people are experiencing, and Donald Trump fired the head of the Bureau of Labor Statistics, which casts further doubt on the credibility of the data. If you ask Americans, they are deeply pessimist, at levels worse than we experienced during the financial crisis. Here’s the University of Michigan’s consumer sentiment number.
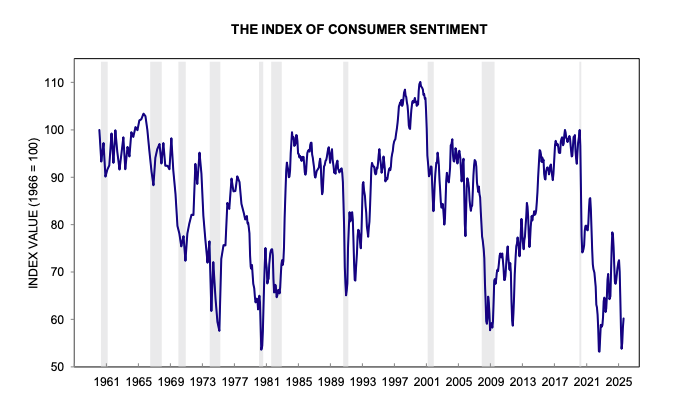
While you can peer into today’s BLS release and find some modestly bad news, Americans writ large are telling pollsters that they feel we are in a severe recession. And despite all the wailing over Biden’s Presidency and now Trump’s administration, the theme here is continuity. On economic matters, Trump is performing about as well as Biden at his lowest, and certainly nowhere near how he did in his first term. Yet, the business press is full of stories of how spending keeps chugging along, thanks to the mighty American consumer, but also showing a rise in Americans taking out loans to buy groceries and missing payments on those loans. Something is off.
This situation isn’t new. For most of Obama’s second term, Americans had a sour view of the economy, despite similar low inflation and unemployment numbers. Except for a brief period during Trump’s first term, the economy has felt weird for almost two decades. Some part of this dynamic is a result of the dread about high cost of essentials, like health care, day care, higher education, or housing. Some of it might be a result of performative luxury being thrown in our faces through social media.
One reason that things feel weird is that the economic statistics we use to convey whether things are doing well were built in a different era, and so they don’t reflect the lived reality we have today. The most common metrics for understanding our economy are (1) the consumer price index of goods and services, aka inflation (2) wage and employment data (3) consumer spending. These answer three big questions. How much does stuff cost? How much are people making? How much are people buying?
But there have been two structural transformations that makes these statistics less useful than they used to be. First, we’re a much more unequal society. Take this other piece of news today about a different labor market, that of the oligarchs.
There really is a different world for the superrich. In 2024, CEO to worker pay ratio was 285 to 1, versus 20 to 1 in 1950. In terms of wealth skews, the differences are comical. The top three richest men in America own more than the bottom 50% of the country.
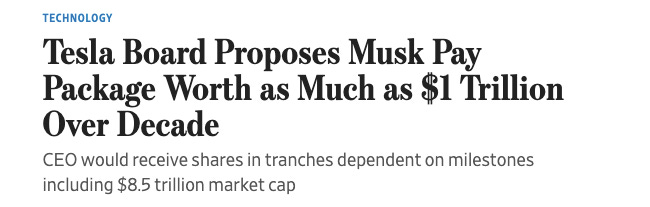
Traditionally, we have understood income and wealth as different things. And that’s true for most of us. But the inequality has skewed our society so dramatically that the stats don’t mean the same things they used to. For someone like Jeff Bezos, his wage income is trivial, his “income” comes in the form of wealth appreciation. So we’re already sort of confused about wage data, excluding what are de facto wage changes for the superrich. I mean, Elon Musk was granted a pay package of a trillion dollars over ten years if Tesla meets some unlikely goals. That would be 0.4% of all compensation received by American workers in 2025. We’ve never seen anything remotely close to that.
Second, financial assets have increased in relative importance to wage income. This chart from the Fed’s flow of funds shows the financial assets of American households, in aggregate, as a percent of income. What does it show? Households have a lot more financial assets relative to income than in 1981. We used to have around three and a half times our income in aggregate financial assets, now we have around six times that amount.
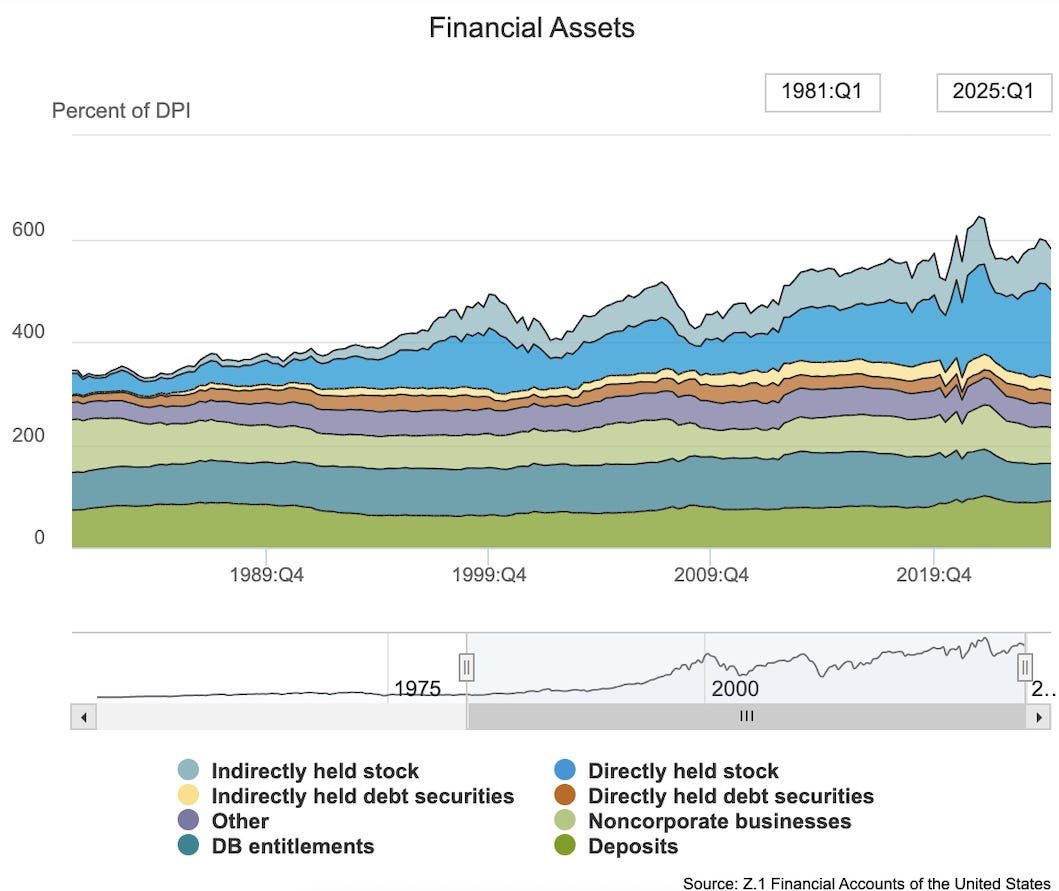
Why? Where are the new assets coming from? The answer is the stock market and real estate. The top three categories are how much stocks and bonds households own. The bottom three are cash, pensions, and small business “non-corporate ownership” stakes. You can see, immediately, that stock ownership has exploded over time, and the higher share of financial assets as a percentage of disposable income are a result of higher equity values. Today, 68% of households own stock.
Real estate isn’t included on this chart, but its importance has also gone up. In 1981, its value was 137% of household disposable income, today it’s 220% of of household disposable income. So the parts of our wealth associated with increasing or declining financial markets are much bigger than they used to be.
Most of the other categories stayed the same, but one did not. The biggest decline was in the small business stake, which fell by 30% since 1981. The independent farmer, hardware store owner, auto dealer, grocer, pharmacist, or doctor is ebbing, and that is showing up in household balance sheet statistics. The value of such assets is tied less to financial markets and more to income. A doctor’s practice, for instance, is contingent upon the incomes of those in the community.
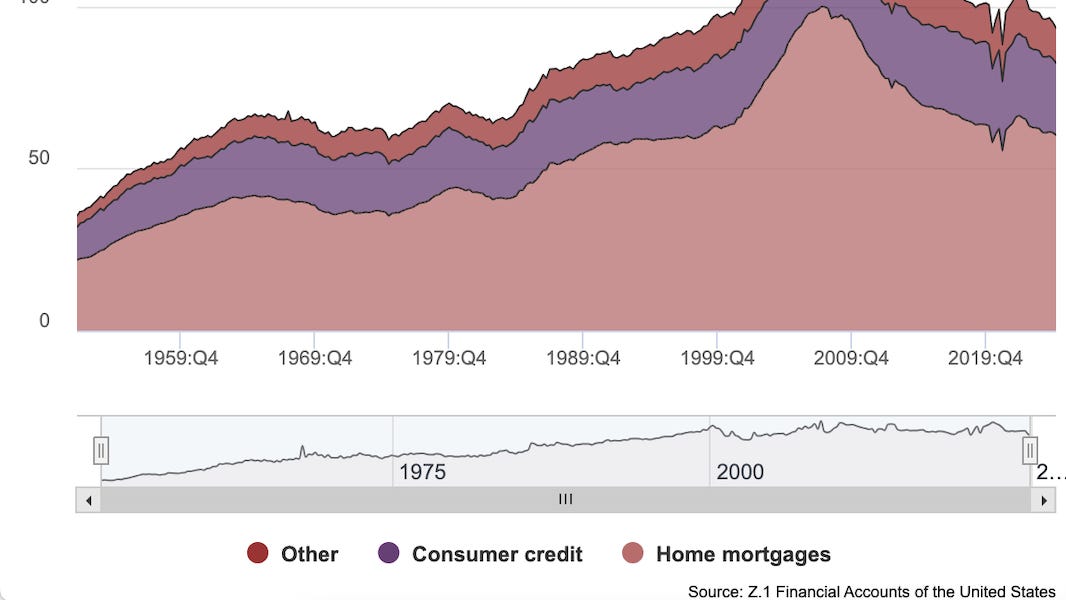
Even as exposure to financial markets has gone up, so has debt. Here’s the household liability side.
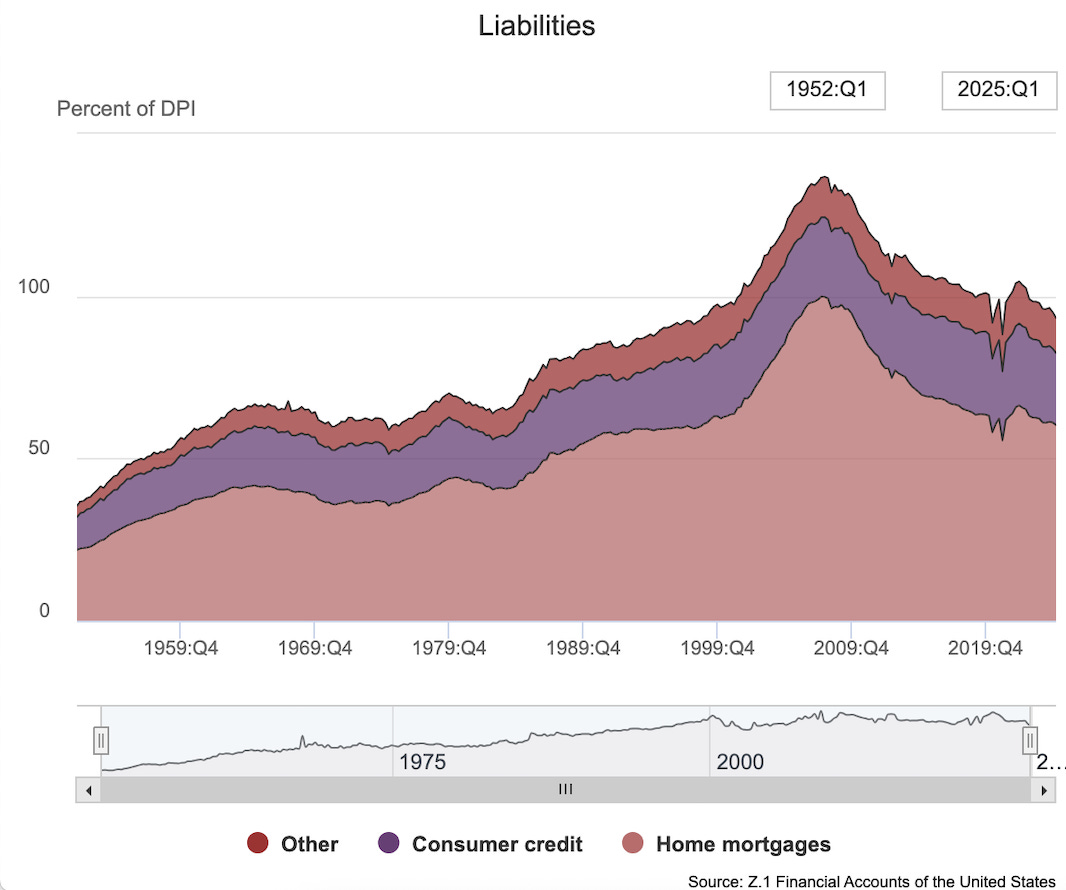
This one I’ve taken back to 1952 because it makes the shift easier to understand. Though debt loads have declined substantially since the financial crisis, there’s a lot more consumer and mortgage debt than there was from the 1950s to the 1980s. And that has a couple of big implications. One is that it messes up the Consumer Price Index, which largely excludes interest payments. But another is that it makes households much more dependent on Wall Street for consumer purchases.
We’re basically back to the late 1990s/early 2000s era of indebtedness. That was the period Elizabeth Warren wrote her important book The Two Income Trap on how the increased price of real estate and the fixed costs of debt payments were making it increasingly impossible for ordinary people to get ahead. (Warren’s main point is that debt traps were also ruining gender relationships.)
What these shifts mean, as she explained, is that the American economy is far more financially fragile. In today’s economy, buying a house means having a lot of debt, which brings high fixed payments. So a downturn in the market or a job loss means a family could be in trouble. In the 1950s, housing was cheap, there were no credit cards or student loans. Most families paid expenses out of income, and had little debt. Fixed expenses were low. So families could manage a job loss by cutting spending or having a spouse get a new part-time job to tide them over.
The growing dependence on financial assets means that something called the “wealth effect” becomes more important. That is, when the stock market goes up, people feel wealthier, and spend more. Prior to the 1980s, people might sock some money away for retirement or a rainy day, and the stock market didn’t matter much to their immediate spending. What did matter was whether you get a raise or a bonus. So the wealth effect was low, an increase of stock market wealth didn’t affect consumer spending.
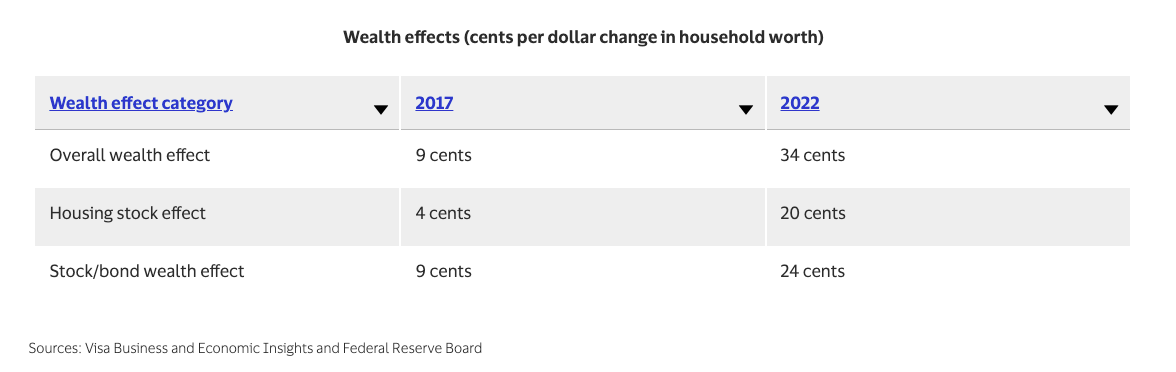
If, however, asset appreciation becomes something that people get used to as a form of compensation, then the wealth effect should grow. And that’s what we’ve seen. During the Covid stock market spike in 2022, the wealth effect increased dramatically. Visa put out some numbers on the phenomenon.
According to our estimates, the wealth effect between 2002 and 2017 was 9 percent. Said another way, for every $1 increase in household wealth, consumer spending increased by 9 cents. Over the last few years, however, something changed dramatically. Using data through the third quarter of 2022, we find that the wealth effect has increased to 34 cents, almost quadruple the pre-pandemic average.
That’s a huge jump. Another way we’d see the wealth effect in action is if those who are experiencing it become a more important part of spending. And that’s what we’re seeing. Equity ownership is concentrated among the very wealthy. And lo and behold! Here’s a Wall Street Journal headline from February:
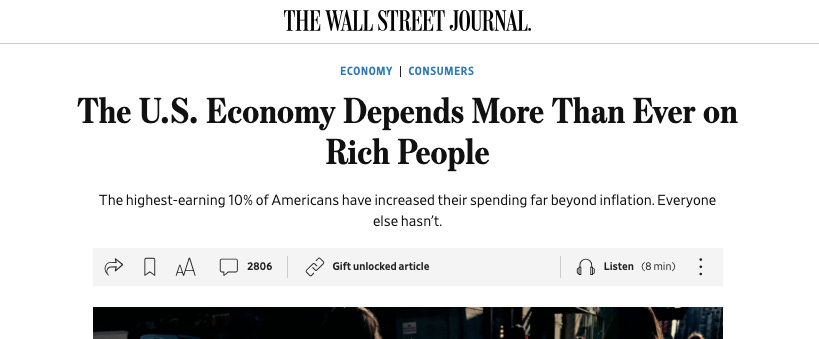
The top ten percent of earners “now account for 49.7% of all spending, a record in data going back to 1989, according to an analysis by Moody’s Analytics. Three decades ago, they accounted for about 36%.”
And that gets me back to something I noted above, Americans in the aggregate are increasingly taking raises in the form of asset appreciation. But the aggregate, just like the flow of funds household balance sheets, hides a lot, because it doesn’t take into account the distribution of wealth. The average net worth of ten people, one of whom is a billionaire and nine of whom have no money, is $100 million each. Writ large, that’s the story of Elon Musk and his trillion dollar pay package, versus everyone else. Most people still depend on direct income, it’s almost entirely the wealthy who are getting raises in the form of higher financial asset values.
That’s why Americans feel gaslit by economists. People making policy for the economy have to rely on metrics to estimate what’s going on. They measure social wellbeing by the consumer price index for inflation, jobs, and consumer purchases. That made sense in a more egalitarian 1950s, when financial assets just weren’t that important. But today, the CPI excludes a big cost (interest payments), jobs are less important to the rich than the poor, and consumer spending is increasingly a proxy for the buying habits of the top 10% richest people in America. Economists haven’t adopted new widely understood metrics to understand social wellbeing, which would incorporate financial fragility and inequality. They keep talking like it’s the economy of 1965.
There’s also a brooding sense of fear, which economists have chalked up to the irrationality of normal people. When asked about “the economy,” people often say it’s doing badly, but when asked about their personal circumstances, they say they are fine. Aha! Look at those fools, goes the claim. But is it really irrational? Or are people actually articulating a sense of heightened risk?
After all, unlike a salary, financial assets are volatile. Being dependent on a stock market, versus a thriving local industrial and agricultural ecosystem, is a different experience. While asset appreciation causes spending, market declines foster consumer spending reductions. For instance, a big driver of spending in the early 2000s during the housing bubble was something called mortgage equity withdrawals, which meant people taking out equity from their rapidly appreciating houses through second mortgages and refinancings. MEWs were so important to the economy that Alan Greenspan actually co-authored an academic paper on them in 2007, showing that a large chunk of aggregate consumer spending was coming from them. During the financial crisis, this part of consumer demand evaporated, worsening the recession.
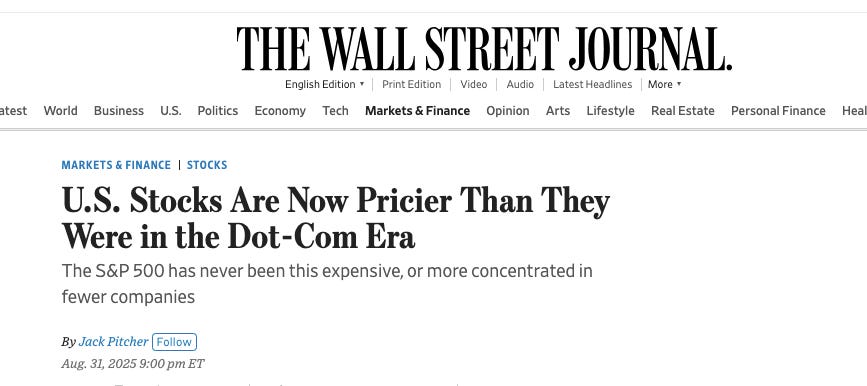
Today, we may have a similar dependency on the stock market and wealth effect. Here’s a story from last week showing stock market values are higher than they’ve ever been, measured by what investors are willing to pay for a dollar of revenue.
There’s a monopoly story here, since it likely means that corporations are more profitable than they should be. This dynamic is an economic Chinese finger trap. If consumer spending is dependent on the rich getting raises via higher asset values, then corporations that boost their stock prices by extracting from the bottom 90% through junk fees, layoffs, crypto frauds, and coercive behavior, are keeping the economy afloat. The very notion of doing something to prohibit the acquisition of ill-gotten profits for some sort of social benefit, well that’s not just absurd, but dangerous, because a stock market swoon really could devastate us. It’s even worse if there’s a bubble, or if something like AI doesn’t generate the revenues to justify the immense capital investment.
This dynamic might be a reason our economy feels so icky and unsustainable. Surely, a political economy this unfair, this unproductive, it can’t go on forever. And yet, it continues to plug along, producing more billionaires and junk fees, but we don’t even have the language to discuss our lived experiences, and the fear we feel. After all, the metrics used to measure it, well they say that inflation is low, jobs are plentiful, and consumer spending is fine. And maybe that’s true, in the aggregate. But it feels pretty sour regardless, and quite scary.
So are we headed into recession? I’m not good at predictions, and the Fed can always try blowing up another bubble. But I think it’s time for policymakers to start preparing ideas for what to do in a downturn.