

Sep 7, 2025
IndexBox has just published a new report: United Kingdom – Veneer Sheets – Market Analysis, Forecast, Size, Trends and Insights.
The UK veneer sheets market is forecast to experience growth over the next decade, with an anticipated CAGR of +3.4% in volume (reaching 9.7K cubic meters by 2035) and +6.2% in value (reaching $12M by 2035). This follows a period of significant contraction, with 2024 consumption at 6.8K cubic meters (-1.4% YoY) and market value at $6.4M (-7.3% YoY). Domestic production is minimal (3 cubic meters in 2024), making the UK heavily reliant on imports, which stood at 7.5K cubic meters (valued at $35M) in 2024. Germany, China, and Estonia are the leading suppliers by volume, while Germany, Spain, and China lead by value. The primary import type is ‘other wood’ sheets (80% share). Export volumes fell dramatically to 694 cubic meters in 2024, with the US, Slovenia, and Ireland as the main destinations. A key market characteristic is the high and rising import/export prices, with the average import price at $4.7K per cubic meter and the average export price surging 112% to $7.7K per cubic meter in 2024.
Key Findings
UK veneer sheet market to enter a decade-long upward consumption trendMarket volume forecast to grow at a CAGR of +3.4% from 2024 to 2035Market volume is projected to reach 9.7K cubic meters by 2035Market value expected to increase at a higher CAGR of +6.2%Market value projected to reach $12M (nominal prices) by the end of 2035Market Forecast
Driven by rising demand for veneer sheets in the UK, the market is expected to start an upward consumption trend over the next decade. The performance of the market is forecast to increase slightly, with an anticipated CAGR of +3.4% for the period from 2024 to 2035, which is projected to bring the market volume to 9.7K cubic meters by the end of 2035.
In value terms, the market is forecast to increase with an anticipated CAGR of +6.2% for the period from 2024 to 2035, which is projected to bring the market value to $12M (in nominal wholesale prices) by the end of 2035.
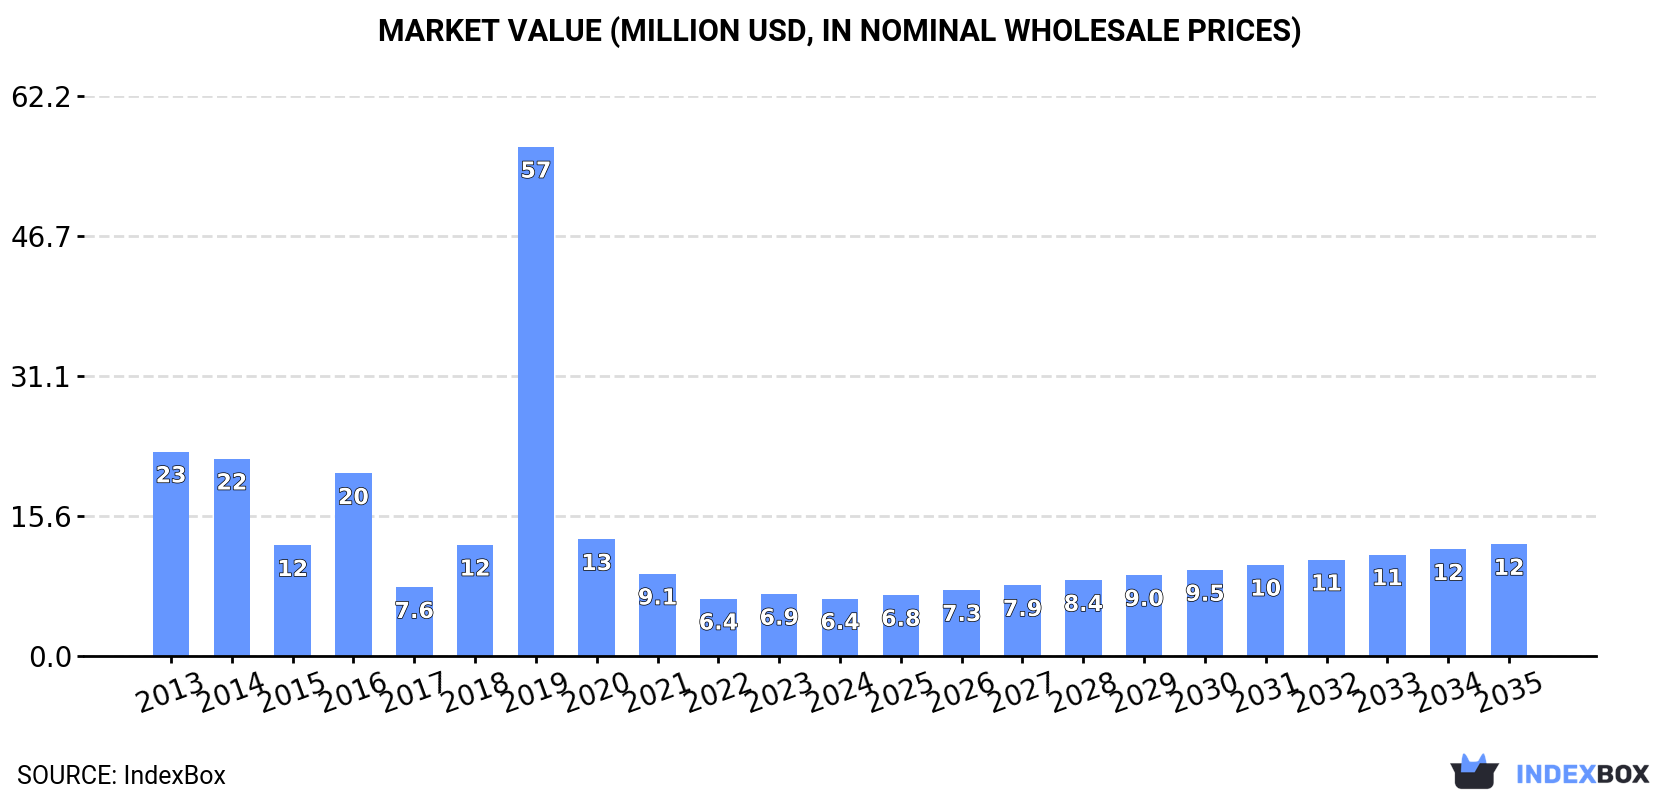 ConsumptionUnited Kingdom’s Consumption of Veneer Sheets
In 2024, consumption of veneer sheets decreased by -1.4% to 6.8K cubic meters, falling for the fifth year in a row after two years of growth. In general, consumption recorded a abrupt decrease. As a result, consumption attained the peak volume of 65K cubic meters. From 2020 to 2024, the growth of the consumption remained at a somewhat lower figure.
The size of the veneer sheets market in the UK contracted to $6.4M in 2024, shrinking by -7.3% against the previous year. This figure reflects the total revenues of producers and importers (excluding logistics costs, retail marketing costs, and retailers’ margins, which will be included in the final consumer price). Over the period under review, consumption continues to indicate a abrupt descent. As a result, consumption reached the peak level of $57M. From 2020 to 2024, the growth of the market failed to regain momentum.
ProductionUnited Kingdom’s Production of Veneer Sheets
In 2024, the amount of veneer sheets produced in the UK soared to 3 cubic meters, picking up by 50% on 2023. Over the period under review, production, however, saw a abrupt setback. Over the period under review, production hit record highs at 18 cubic meters in 2015; however, from 2016 to 2024, production remained at a lower figure.
In value terms, veneer sheets production soared to $23K in 2024 estimated in export price. Overall, production, however, recorded a abrupt downturn. Veneer sheets production peaked at $61K in 2013; however, from 2014 to 2024, production remained at a lower figure.
ImportsUnited Kingdom’s Imports of Veneer Sheets
In 2024, supplies from abroad of veneer sheets decreased by -14.9% to 7.5K cubic meters, falling for the fifth year in a row after two years of growth. Overall, imports continue to indicate a abrupt contraction. The most prominent rate of growth was recorded in 2018 with an increase of 181% against the previous year. Over the period under review, imports attained the peak figure at 68K cubic meters in 2019; however, from 2020 to 2024, imports failed to regain momentum.
In value terms, veneer sheets imports shrank to $35M in 2024. In general, imports showed a pronounced setback. The growth pace was the most rapid in 2022 when imports increased by 69%. Over the period under review, imports hit record highs at $56M in 2013; however, from 2014 to 2024, imports failed to regain momentum.
Imports By Country
Germany (1.9K cubic meters), China (1.1K cubic meters) and Estonia (612 cubic meters) were the main suppliers of veneer sheets imports to the UK, with a combined 48% share of total imports. Spain, Romania, the United States, Slovenia, Italy, Portugal, Ukraine, Ireland, the Netherlands and Belgium lagged somewhat behind, together accounting for a further 39%.
From 2013 to 2024, the biggest increases were recorded for Ukraine (with a CAGR of +19.4%), while purchases for the other leaders experienced more modest paces of growth.
In value terms, the largest veneer sheets suppliers to the UK were Germany ($5M), Spain ($4.4M) and China ($4.1M), with a combined 38% share of total imports. Romania, Italy, the United States, Slovenia, Estonia, Portugal, Ireland, Ukraine, the Netherlands and Belgium lagged somewhat behind, together accounting for a further 51%.
In terms of the main suppliers, Ukraine, with a CAGR of +31.3%, recorded the highest growth rate of the value of imports, over the period under review, while purchases for the other leaders experienced more modest paces of growth.
Imports By Type
In 2024, wood; n.e.s. in heading no. 4408, sheets for veneer or plywood, other wood sawn lengthwise, sliced or peeled, whether or not planed, sanded or finger-jointed, not thicker than 6mm (6K cubic meters) constituted the largest type of veneer sheets supplied to the UK, with a 80% share of total imports. Moreover, wood; n.e.s. in heading no. 4408, sheets for veneer or plywood, other wood sawn lengthwise, sliced or peeled, whether or not planed, sanded or finger-jointed, not thicker than 6mm exceeded the figures recorded for the second-largest type, wood; coniferous, sheets for veneer or plywood, other wood sawn lengthwise, sliced or peeled, whether or not planed, sanded or finger-jointed, not thicker than 6mm (870 cubic meters), sevenfold. Wood, tropical; (as in subheading note 1, chapter 44, customs tariff), n.e.s. in item no. 4408.31, sheets for veneer or plywood, other wood sawn length wise, sliced or peeled, whether or not planed, sanded or finger-jointed, not thicker than 6mm (575 cubic meters) ranked third in terms of total imports with a 7.7% share.
From 2013 to 2024, the average annual growth rate of the volume of wood; n.e.s. in heading no. 4408, sheets for veneer or plywood, other wood sawn lengthwise, sliced or peeled, whether or not planed, sanded or finger-jointed, not thicker than 6mm imports stood at -9.9%. With regard to the other supplied products, the following average annual rates of growth were recorded: wood; coniferous, sheets for veneer or plywood, other wood sawn lengthwise, sliced or peeled, whether or not planed, sanded or finger-jointed, not thicker than 6mm (-9.7% per year) and wood, tropical; (as in subheading note 1, chapter 44, customs tariff), n.e.s. in item no. 4408.31, sheets for veneer or plywood, other wood sawn length wise, sliced or peeled, whether or not planed, sanded or finger-jointed, not thicker than 6mm (-13.5% per year).
In value terms, wood; n.e.s. in heading no. 4408, sheets for veneer or plywood, other wood sawn lengthwise, sliced or peeled, whether or not planed, sanded or finger-jointed, not thicker than 6mm ($28M) constituted the largest type of veneer sheets supplied to the UK, comprising 79% of total imports. The second position in the ranking was held by wood, tropical; (as in subheading note 1, chapter 44, customs tariff), n.e.s. in item no. 4408.31, sheets for veneer or plywood, other wood sawn length wise, sliced or peeled, whether or not planed, sanded or finger-jointed, not thicker than 6mm ($4.6M), with a 13% share of total imports. It was followed by wood; coniferous, sheets for veneer or plywood, other wood sawn lengthwise, sliced or peeled, whether or not planed, sanded or finger-jointed, not thicker than 6mm, with a 7.6% share.
From 2013 to 2024, the average annual growth rate of the value of wood; n.e.s. in heading no. 4408, sheets for veneer or plywood, other wood sawn lengthwise, sliced or peeled, whether or not planed, sanded or finger-jointed, not thicker than 6mm imports totaled -3.9%. With regard to the other supplied products, the following average annual rates of growth were recorded: wood, tropical; (as in subheading note 1, chapter 44, customs tariff), n.e.s. in item no. 4408.31, sheets for veneer or plywood, other wood sawn length wise, sliced or peeled, whether or not planed, sanded or finger-jointed, not thicker than 6mm (-6.3% per year) and wood; coniferous, sheets for veneer or plywood, other wood sawn lengthwise, sliced or peeled, whether or not planed, sanded or finger-jointed, not thicker than 6mm (-1.6% per year).
Import Prices By Type
The average veneer sheets import price stood at $4.7 thousand per cubic meter in 2024, leveling off at the previous year. Overall, the import price recorded a strong increase. The pace of growth was the most pronounced in 2020 when the average import price increased by 313% against the previous year. The import price peaked in 2024 and is likely to continue growth in the immediate term.
There were significant differences in the average prices amongst the major supplied products. In 2024, the product with the highest price was wood, tropical; (as in subheading note 1, chapter 44, customs tariff), n.e.s. in item no. 4408.31, sheets for veneer or plywood, other wood sawn length wise, sliced or peeled, whether or not planed, sanded or finger-jointed, not thicker than 6mm ($7.9 thousand per cubic meter), while the price for wood, tropical; dark red meranti, light red meranti, meranti bakau, sheets for veneer or plywood, other wood sawn lengthwise, sliced or peeled, whether or not planed, sanded or finger-jointed, not thicker than 6mm ($1.6 thousand per cubic meter) was amongst the lowest.
From 2013 to 2024, the most notable rate of growth in terms of prices was attained by wood; coniferous, sheets for veneer or plywood, other wood sawn lengthwise, sliced or peeled, whether or not planed, sanded or finger-jointed, not thicker than 6mm (+9.0%), while the prices for the other products experienced more modest paces of growth.
Import Prices By Country
In 2024, the average veneer sheets import price amounted to $4.7 thousand per cubic meter, approximately reflecting the previous year. Over the period under review, the import price posted resilient growth. The most prominent rate of growth was recorded in 2020 an increase of 313%. Over the period under review, average import prices hit record highs in 2024 and is expected to retain growth in years to come.
There were significant differences in the average prices amongst the major supplying countries. In 2024, amid the top importers, the country with the highest price was Italy ($13 thousand per cubic meter), while the price for Estonia ($1.9 thousand per cubic meter) was amongst the lowest.
From 2013 to 2024, the most notable rate of growth in terms of prices was attained by Slovenia (+19.4%), while the prices for the other major suppliers experienced more modest paces of growth.
ExportsUnited Kingdom’s Exports of Veneer Sheets
In 2024, veneer sheets exports from the UK contracted notably to 694 cubic meters, waning by -63.5% compared with 2023. In general, exports recorded a deep reduction. The growth pace was the most rapid in 2018 with an increase of 445% against the previous year. As a result, the exports attained the peak of 21K cubic meters. From 2019 to 2024, the growth of the exports failed to regain momentum.
In value terms, veneer sheets exports shrank dramatically to $5.4M in 2024. Over the period under review, exports saw a pronounced descent. The most prominent rate of growth was recorded in 2022 when exports increased by 42%. Over the period under review, the exports hit record highs at $10M in 2014; however, from 2015 to 2024, the exports remained at a lower figure.
Exports By Country
Slovenia (249 cubic meters), the United States (153 cubic meters) and Ireland (128 cubic meters) were the main destinations of veneer sheets exports from the UK, with a combined 76% share of total exports.
From 2013 to 2024, the biggest increases were recorded for Slovenia (with a CAGR of +47.8%), while shipments for the other leaders experienced more modest paces of growth.
In value terms, the largest markets for veneer sheets exported from the UK were the United States ($2.1M), Slovenia ($1.2M) and Ireland ($454K), together comprising 71% of total exports. South Africa, Germany, Denmark, the Dominican Republic, Spain, France, the United Arab Emirates and Indonesia lagged somewhat behind, together comprising a further 22%.
Among the main countries of destination, Denmark, with a CAGR of +100.8%, saw the highest rates of growth with regard to the value of exports, over the period under review, while shipments for the other leaders experienced more modest paces of growth.
Exports By Type
Wood; n.e.s. in heading no. 4408, sheets for veneer or plywood, other wood sawn lengthwise, sliced or peeled, whether or not planed, sanded or finger-jointed, not thicker than 6mm (484 cubic meters) was the largest type of veneer sheets exported from the UK, with a 70% share of total exports. Moreover, wood; n.e.s. in heading no. 4408, sheets for veneer or plywood, other wood sawn lengthwise, sliced or peeled, whether or not planed, sanded or finger-jointed, not thicker than 6mm exceeded the volume of the second product type, wood; coniferous, sheets for veneer or plywood, other wood sawn lengthwise, sliced or peeled, whether or not planed, sanded or finger-jointed, not thicker than 6mm (107 cubic meters), fivefold. Wood, tropical; dark red meranti, light red meranti, meranti bakau, sheets for veneer or plywood, other wood sawn lengthwise, sliced or peeled, whether or not planed, sanded or finger-jointed, not thicker than 6mm (55 cubic meters) ranked third in terms of total exports with a 7.9% share.
From 2013 to 2024, the average annual growth rate of the volume of wood; n.e.s. in heading no. 4408, sheets for veneer or plywood, other wood sawn lengthwise, sliced or peeled, whether or not planed, sanded or finger-jointed, not thicker than 6mm exports totaled -8.7%. With regard to the other exported products, the following average annual rates of growth were recorded: wood; coniferous, sheets for veneer or plywood, other wood sawn lengthwise, sliced or peeled, whether or not planed, sanded or finger-jointed, not thicker than 6mm (-18.7% per year) and wood, tropical; dark red meranti, light red meranti, meranti bakau, sheets for veneer or plywood, other wood sawn lengthwise, sliced or peeled, whether or not planed, sanded or finger-jointed, not thicker than 6mm (-0.6% per year).
In value terms, wood; n.e.s. in heading no. 4408, sheets for veneer or plywood, other wood sawn lengthwise, sliced or peeled, whether or not planed, sanded or finger-jointed, not thicker than 6mm ($4.4M) remains the largest type of veneer sheets exported from the UK, comprising 82% of total exports. The second position in the ranking was taken by wood, tropical; (as in subheading note 1, chapter 44, customs tariff), n.e.s. in item no. 4408.31, sheets for veneer or plywood, other wood sawn length wise, sliced or peeled, whether or not planed, sanded or finger-jointed, not thicker than 6mm ($415K), with a 7.8% share of total exports. It was followed by wood; coniferous, sheets for veneer or plywood, other wood sawn lengthwise, sliced or peeled, whether or not planed, sanded or finger-jointed, not thicker than 6mm, with a 7.7% share.
From 2013 to 2024, the average annual growth rate of the value of wood; n.e.s. in heading no. 4408, sheets for veneer or plywood, other wood sawn lengthwise, sliced or peeled, whether or not planed, sanded or finger-jointed, not thicker than 6mm exports stood at -3.6%. With regard to the other exported products, the following average annual rates of growth were recorded: wood, tropical; (as in subheading note 1, chapter 44, customs tariff), n.e.s. in item no. 4408.31, sheets for veneer or plywood, other wood sawn length wise, sliced or peeled, whether or not planed, sanded or finger-jointed, not thicker than 6mm (-4.8% per year) and wood; coniferous, sheets for veneer or plywood, other wood sawn lengthwise, sliced or peeled, whether or not planed, sanded or finger-jointed, not thicker than 6mm (-8.3% per year).
Export Prices By Type
In 2024, the average veneer sheets export price amounted to $7.7 thousand per cubic meter, jumping by 112% against the previous year. In general, the export price enjoyed strong growth. The pace of growth appeared the most rapid in 2019 an increase of 516% against the previous year. The export price peaked in 2024 and is likely to continue growth in the near future.
Prices varied noticeably by the product type; the product with the highest price was wood; n.e.s. in heading no. 4408, sheets for veneer or plywood, other wood sawn lengthwise, sliced or peeled, whether or not planed, sanded or finger-jointed, not thicker than 6mm ($9.1 thousand per cubic meter), while the average price for exports of wood, tropical; dark red meranti, light red meranti, meranti bakau, sheets for veneer or plywood, other wood sawn lengthwise, sliced or peeled, whether or not planed, sanded or finger-jointed, not thicker than 6mm ($2.2 thousand per cubic meter) was amongst the lowest.
From 2013 to 2024, the most notable rate of growth in terms of prices was recorded for the following types: wood; coniferous, sheets for veneer or plywood, other wood sawn lengthwise, sliced or peeled, whether or not planed, sanded or finger-jointed, not thicker than 6mm (+12.8%), while the prices for the other products experienced more modest paces of growth.
Export Prices By Country
The average veneer sheets export price stood at $7.7 thousand per cubic meter in 2024, increasing by 112% against the previous year. Overall, the export price showed a resilient expansion. The most prominent rate of growth was recorded in 2019 when the average export price increased by 516%. The export price peaked in 2024 and is expected to retain growth in the near future.
Prices varied noticeably by country of destination: amid the top suppliers, the country with the highest price was South Africa ($32 thousand per cubic meter), while the average price for exports to Ireland ($3.5 thousand per cubic meter) was amongst the lowest.
From 2013 to 2024, the most notable rate of growth in terms of prices was recorded for supplies to Denmark (+49.8%), while the prices for the other major destinations experienced more modest paces of growth.